| Issue |
A&A
Volume 695, March 2025
|
|
|---|---|---|
| Article Number | L16 | |
| Number of page(s) | 7 | |
| Section | Letters to the Editor | |
| DOI | https://doi.org/10.1051/0004-6361/202452581 | |
| Published online | 17 March 2025 | |
Letter to the Editor
Radio emission from a massive node of the cosmic web
A discovery powered by machine learning
1
INAF – Istituto di Radio Astronomia, Via P. Gobetti 101, 40129 Bologna, Italy
2
INAF – Osservatorio di Astrofisica e Scienza dello Spazio di Bologna, via Piero Gobetti 93/3, 40129 Bologna, Italy
3
INFN, Sezione di Bologna, Viale Berti Pichat 6/2, 40127 Bologna, Italy
4
Academia Sinica Institute of Astronomy and Astrophysics (ASIAA), No. 1, Section 4, Roosevelt Road, 10617 Taipei, Taiwan
5
Laboratoire d’Astrophysique de Marseille, Aix-Marseille Univ., CNRS, CNES, Marseille, France
6
Institut d’Astrophysique de Paris, UMR 7095, CNRS & Sorbonne Université, 98 bis Boulevard Arago, 75014 Paris, France
7
Dipartimento di Fisica e Astronomia, Universitá di Bologna, Via P. Gobetti 92/3, 40129 Bologna, Italy
⋆ Corresponding author; ccstuardi@gmail.com
Received:
11
October
2024
Accepted:
17
February
2025
Context. The recent detection of radio emission extending beyond the scales typically associated with radio halos challenges our understanding of how energy is transferred to the non-thermal components on the outskirts of galaxy clusters, suggesting the crucial role of mass accretion processes. So far, discoveries have relied on the visual identification of prominent clusters within limited samples. Today, machine learning promises to automatically identify an increasing number of such sources in wide-area radio surveys.
Aims. We aim to understand the nature of the diffuse radio emission surrounding the massive galaxy cluster PSZ2 G083.29-31.03, at z = 0.412, already known to host a radio halo. Our investigation was triggered by Radio U-Net, a novel machine learning algorithm for detecting diffuse radio emission that was previously applied to the Low Frequency Array (LOFAR) Two Meter Sky Survey (LoTSS).
Methods. We re-processed LoTSS (120–168 MHz) data and analysed archival XMM-Newton (0.7–1.2 keV) observations. We also analysed optical and near-infrared data from the Dark Energy Spectroscopic Instrument (DESI) Legacy Imaging Surveys and assessed the mass distribution with weak-lensing analysis based on archival Subaru observations.
Results. We report the discovery of large-scale diffuse radio emission around PSZ2 G083.29-31.03, with a projected largest linear size of 5 Mpc at 144 MHz. The radio emission is aligned with the thermal X-ray emission and the distribution of galaxies, unveiling the presence of two low-mass systems, at similar redshifts on either side of the central cluster. The weak lensing analysis supports this scenario, demonstrating the presence of an extended and complex mass distribution.
Conclusions. We propose to interpret the two faint radio sources as connected to the central cluster, illuminating the presence of two substructures merging into a massive node of the cosmic web. However, because of uncertainties in redshift and mass estimates, combined with the low resolution required to detect these sources, classification of the two sources as independent radio halos associated with nearby low-mass clusters or even as a mixture of different types of diffuse radio emission cannot be definitively ruled out.
Key words: galaxies: clusters: intracluster medium / galaxies: clusters: individual: PSZ2 G083.29-31.03 / large-scale structure of Universe
© The Authors 2025
 Open Access article, published by EDP Sciences, under the terms of the Creative Commons Attribution License (https://creativecommons.org/licenses/by/4.0), which permits unrestricted use, distribution, and reproduction in any medium, provided the original work is properly cited.
This article is published in open access under the Subscribe to Open model. Subscribe to A&A to support open access publication.
1. Introduction
The presence of diffuse radio emission filling the volume of massive galaxy clusters up to the characteristic radius R2001, and extending even beyond, has become the subject of significant interest from the radio astronomy community in recent years, particularly due to advances in low-frequency observations (Govoni et al. 2019; Shweta et al. 2020; Rajpurohit et al. 2021; Cuciti et al. 2022; Botteon et al. 2022b; Bruno et al. 2023). Theoretical studies, supported by state-of-the-art magneto-hydrodynamical simulations, suggest that this kind of emission can originate from the turbulence injected in the intra-cluster medium (ICM) by the large-scale structure formation process (Beduzzi et al. 2023; Nishiwaki et al. 2024). Whether this type of radio emission exists in all systems but remains below the noise level for most, or whether it is only activated in particularly massive and dynamically disturbed systems, remains to be investigated. In this context, a multi-wavelength analysis is necessary to understand the connection between the diffuse radio emission and the dynamical state of the galaxy cluster.
In this Letter, we report the discovery of a large-scale diffuse radio emission around PSZ2 G083.29-31.03 (a.k.a. MACS J2228.5+2036 or RXJ2228.6+2037) at z = 0.412 ± 0.002 (Amodeo et al. 2018), made using a machine learning (ML) algorithm. To our knowledge, this is the first radio diffuse emission discovered thanks to ML that went unnoticed by human analysis. In Sect. 2, we explain how the radio emission was discovered with the use of Radio U-Net (Stuardi et al. 2024). In Sect. 3, we describe radio, X-ray, optical, near-infrared, and weak lensing (WL) analysis. In Sect. 4, we compare multi-wavelength observations and discuss possible interpretations, and in Sect. 5 we provide concluding remarks. Appendices A, B, and C provide additional information on the data analysis. We used a Λ Cold Dark Matter cosmological model, with ΩΛ = 0.7, Ωm = 0.3, and H0 = 70 km s−1 Mpc−1, where 1″ corresponds to 5.47 kpc at the galaxy cluster’s redshift.
2. Discovery
With the advent of new-generation wide-area radio surveys, such as the Low Frequency Array (LOFAR; van Haarlem et al. 2013) Two Metre Sky Survey (LoTSS; Shimwell et al. 2017, 2019) and the Evolutionary Map of the Universe (EMU; Norris et al. 2011), traditional cataloguing methods are becoming less efficient. Machine learning algorithms are gaining increasing prominence, owing to their ability to automate the detection and classification of sources in large imaging datasets (e.g. Mostert et al. 2021; Slijepcevic et al. 2024; Gupta et al. 2024; Alegre et al. 2024; Lastufka et al. 2024). However, the application of such algorithms to the detection of diffuse radio emission in galaxy clusters and the cosmic web remains poorly explored (Gheller et al. 2018).
Recently, we developed an ML tool based on the U-Net architecture, named Radio U-Net, which facilitates the rapid detection and segmentation of diffuse radio sources in large image datasets directly retrieved from archives (Stuardi et al. 2024). We tested this algorithm on a catalogued sample of galaxy clusters observed within the LoTSS second data release (DR2; Botteon et al. 2022a). The output of the network consists of an image with the same dimensions as the original radio image, where each pixel is assigned a value ranging from 0 to 1, with higher values corresponding to regions of diffuse radio emission. We refer to these outputs as probability maps, though their precise definition is provided in Stuardi et al. (2024). Notably, despite Radio U-Net being applied to archival images at 20″ resolution, the network detected emission visible only after smoothing the images to lower resolutions. Additionally, in some cases, the regions highlighted by the probability maps extended beyond those detected at the reference 3σ level, demonstrating the network’s capability to detect diffuse radio emission even below the nominal noise.
One particularly noteworthy cluster included in the sample was PSZ2 G083.29-31.03. Its probability map revealed the presence of diffuse radio emission extending beyond R500, a feature that had been overlooked during the visual inspection of the original image (see Fig. A.1). Radio U-Net clearly identified a peculiar morphology below the noise threshold, triggering a deeper investigation into this system.
PSZ2 G083.29-31.03 was first listed as a galaxy cluster in the ROSAT All-Sky Survey (RASS) bright source catalogue (Voges et al. 1999) and identified in the optical by Bade et al. (1998). It was then classified as a hot and massive galaxy cluster by combining Sunyaev-Zel’dovich (SZ) and X-ray observations (Pointecouteau et al. 2002). XMM-Newton observations estimated a cluster mass of MX, 500 = (1.19 ± 0.35)×1015 M⊙ at RX, 500 = 1.61 ± 0.16 Mpc and a temperature of  keV (Jia et al. 2008). The cluster was listed in the second catalogue of Planck Sunyaev Zel’dovich (PSZ2 Planck Collaboration XXVII 2016), in which its mass estimate is MSZ, 500 = (8.3 ± 0.4)×1014 M⊙.
A radio diffuse source centred on the cluster X-ray emission was first detected by Giovannini et al. (2020) at 1.5 GHz and classified as a radio halo. They observed radio emission with irregular morphology, with a maximum linear extension of 1.09 Mpc. The presence of the halo was recently confirmed by LOFAR observations (Botteon et al. 2022a). The morphology of the radio halo at 144 MHz is similar to that observed at 1.5 GHz, although more extended, reaching a linear size of 1.5 Mpc in the north-west to south-east direction.
3. Data analysis
In the following sections, we present the multi-frequency data we have investigated to disclose the origin of the newly detected radio emission around PSZ2 G083.29-31.03. More details on the data analysis can be found in Appendices A, B, and C.
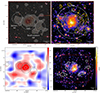 |
Fig. 1. Multi-wavelength view of the PSZ2 G083.29-31.03 galaxy cluster. The dashed red square marks the same region in all the panels. Top left panel: Optical image obtained from the Legacy Surveys/D. Lang (Perimeter Institute). Red stripes are saturation artefacts. The white circles mark the systems listed in Table 2 and have a radius equal to their estimated R500. The filled shaded white-to-red contours are at [2,3,6,12,24,48]×σ, with σ = 0.59 mJy/beam, of the low-resolution uv-subtracted 144 MHz LOFAR image (97″ × 100″). Top right panel: XMM-Newton image (0.7–1.2 keV) with a smoothing kernel of 3 pixels. Solid orange contours are [3,6,12,24]×σ, with σ = 0.58 mJy/beam, of the uv-subtracted LOFAR image with restoring beam of 68″ × 81″. The dash-dotted yellow contour is the 2σ level of the low-resolution LOFAR image. The two white circles are R500 and R200 of PSZ2 G083.29-31.03 (Jia et al. 2008). Bottom left panel: WL mass map created with a |


3.1. Radio data analysis
We re-analysed the LoTSS DR2 observation of the PSZ2 G083.29-31.03 galaxy cluster already presented by Botteon et al. (2022a). Data reduction and imaging procedures are described in Appendix A, while more details on the radio images produced can be found in Table 1.
Details of the LOFAR images (144 MHz).
There is a clear similarity between the segmentation of the original image produced by Radio U-Net (Fig. A.1) and the diffuse radio emission emerging in the low-resolution image of the cluster, shown in the top panels of Fig. 1 (see also Fig. A.2). Beyond the emission centred at the cluster position, two fainter ‘ears’ extend to the east and the south-west of the cluster. The eastern extension has a roundish morphology and is connected to the brightest part of the central radio halo. The south-western one is instead elongated in the north-west to south-east direction. The morphology of the two ears at 69″ × 81″ resolution is shown by the orange contours in Fig. 1.
We computed the average surface brightness and the flux density of the two ears from the 69″ × 81″ image to avoid contamination from the radio halo. They were computed in two polygonal regions encompassing the 2σ contours. The east and south-western ears have an average surface brightness of 2.01 ± 0.58 mJy/beam (i.e., 0.32 μJy/arcsec2) and 1.79 ± 0.58 mJy/beam (i.e., 0.28 μJy/arcsec2), where the uncertainty is the root-mean-square (rms) noise of the image. The central radio halo has an average surface brightness that is a factor ∼2.7 higher (0.84 μJy/arcsec2). We computed a flux density of 20 ± 3 mJy and 18 ± 3 mJy for the east and south-western ear, respectively. The uncertainty on the flux density was computed as in Botteon et al. (2022a), and more details are given in our Appendix A.
3.2. X-ray data analysis
Two available observations of PSZ2 G083.29-31.03 are present in the XMM-Newton archive (ObsIDs: 0147890101, 0827360901). The data reduction procedure is detailed in Appendix B, and the resulting X-ray image is shown in Fig. 1.
The brightest part of the cluster is elongated in the north-west to south-east direction. However, we notice two clumps of X-ray emission in the east and south-west of the cluster, coincident with the position of the two radio ears. The eastern clump has a brighter spot at the centre and is connected to the central cluster with a faint emission. The distance between the bright spot and the X-ray peak of the cluster is 310″ (∼1.7 Mpc). The fainter clump to the south-west is at a similar projected distance from the central peak.
3.3. Optical and near-infrared analysis
We searched for optical counterparts of the two X-ray clumps in the catalogue of candidate clusters of galaxies compiled by Wen & Han (2024) from data release 9 and 10 of the Dark Energy Spectroscopic Instrument (DESI) Legacy Imaging Surveys (Dey et al. 2019). Within a matching distance of 5 Mpc at the cluster redshift from the X-ray peak and Δz = ±0.02(1 + z), we found four candidate clusters and groups (see Table 2 and Fig. 1). Two systems with M500 < 2 × 10¹⁴ M⊙ coincides with the positions of the two ears.
Neighbour candidate clusters and groups.
Based on their precise redshift estimates, the four systems lie within a region of radius 15–20 Mpc. However, the large uncertainties in the photometric redshift and the mass of the systems, derived from their richness by Wen & Han (2024), prevent us from determining whether the systems are physically connected or merely aligned in projection.
The dynamical mass of Mσ, 500 = (9.4 ± 3.6)×1014 M⊙ based on the velocity dispersion of the member galaxies (Sereno et al. 2025) is larger than the richness-based mass of the main clump, but it agrees with the total mass of the four structures.
3.4. Weak lensing analysis
The cluster was targeted for WL analyses by Foëx et al. (2012) and Applegate et al. (2014), who identified a massive structure with MWL, 500 = (6.1 ± 1.3)×1014 M⊙ or MWL, 500 = (9.7 ± 2.6)×1014 M⊙, respectively, as was reported by Sereno (2015). We conducted a WL analysis of the system to derive the mass distribution on large scales. More detail on the data used is given in Appendix C. In the bottom right panel of Fig. 1, we compare the resulting mass map, smoothed with a  FWHM Gaussian kernel, with the XMM-Newton image. The rms reconstruction error, estimated from the B-mode map, is σκ ≃ 0.03, consistent with random shape noise. We also performed a mass reconstruction with a
  FWHM Gaussian kernel to better match the size of these structures (see the bottom left panel of Fig. 1). The WL analysis provides additional evidence for the existence of a triple system and the mass distribution aligns well with that derived from X-ray emission and galaxy distribution.
4. Discussion
The multi-wavelength analysis gave us valuable insights into the dynamical state of the PSZ2 G083.29-31.03 galaxy cluster. The presence of the central radio halo and the irregular X-ray morphology testify that PSZ2 G083.29-31.03 is a merging galaxy cluster. The mass comparison between independent methods confirms that the node is very massive, but differences hint at an irregular and dynamically active system. The WL, SZ, or optical-based mass estimates differ to some degree, even though they are compatible within the statistical uncertainties and they are lower than the X-ray estimate. This might suggest that the gas temperature is temporarily boosted by the ongoing merger.
The elongation toward the north-west of both the X-ray and radio emission suggests that a component of the merger is in this direction. Beyond this, the presence of two structures is detected by X-rays, WL, and photometric analysis. The current data do not definitively clarify whether these smaller systems are the conclusive part of cosmic-web filaments channelling mass toward the central cluster, as was claimed for example for Abell 2744 (Eckert et al. 2015), or whether they are low-mass satellites located outside the outer regions of the cluster itself.
Considering the available data, we take into account the following potential interpretations for the detected large-scale radio emission: that they are (i) associated with radio galaxies, (ii) radio relics, or (iii) radio halos. If the two sub-structures are indeed accreting into the central one, there is also the possibility that (iv) the diffuse emission originates from the dynamically active regions forming a massive node of the cosmic web.
(i) The alignment of the two ears with the identified sub-structures is clear, which rules out the possibility of a coincidental alignment of radio emission associated with active galactic nuclei. However, we note that a minor contribution from sources that are not fully subtracted to the flux density of the newly discovered emission cannot be excluded (see Appendix A).
(ii) Typical radio relics are elongated in the direction perpendicular to the merger axis that generates the central radio halo, while in this case the merger axis of the central cluster is in the opposite direction. The two candidate relics would be located between the two sub-structures and the main cluster, where the radio emission appears elongated. This would suggest the presence of compression rather than shocks, but deeper X-ray observations, as well as multi-frequency radio data, are needed to firmly discard this hypothesis.
(iii) The mass of the two sub-structures is low (see Table 2). There is a scaling relation between the radio power of halos and the mass of the system (e.g., Cuciti et al. 2023), which indicates that in low-mass galaxy clusters the amount of energy conveyed into non-thermal components is small. A radio halo has previously been detected in a low-mass system (M500 < 2 × 10¹⁴ M⊙), although at very low redshift and with low-resolution observations (Botteon et al. 2021), and in this case its power was consistent with the extrapolation of the power-mass relation. The two ears instead have power of P144MHz ∼ 1 × 1025(1 + z)(α − 1) W/Hz (where α is the unknown spectral index of the radio emission), which is one order of magnitude higher than what is expected from the correlation. However, due to the large uncertainties in the mass of the systems, it is not possible to rule out the hypothesis that they are two powerful radio halos observed coincidentally aligned in projection. The high radio power could also be due to the mixture of different kinds of diffuse radio emissions.
(iv) The newly detected sources could finally represent the tip of the iceberg of the radio emission originating from the energy released by the mass accretion processes around a particularly massive node of the cosmic web. To understand if this system is unique, we considered all the PSZ2 clusters in the Legacy Survey area (676). For each of them, we found the galaxy clusters and groups in a projected comoving radius of 5 Mpc and within a separation of Δz = ±0.02(1 + z). In terms of the number of neighbours, PSZ2 G083.29-31.03 is not peculiar: ∼37% of PSZ2 clusters have an equal or greater number of neighbouring clusters and groups. However, if we limit the computation to neighbours with M500 ≥ 1014 M⊙, PSZ2 G083.29-31.03 is at the 90th percentile. When we consider the total mass of the neighbours, we again find that only ∼10% has an equal or greater mass in the surrounding systems.
The average surface brightness of the two ears (see Sect. 3.1) is lower than 0.5 μJy/arcsec2 at 144 MHz, similarly to other systems where the diffuse radio emission extends outside R500 and is sometimes referred to as a mega-halo (e.g. Shweta et al. 2020; Rajpurohit et al. 2021; Cuciti et al. 2022; Botteon et al. 2022b; Bruno et al. 2023). A similar value also characterizes the so-called bridges that connect nearby galaxy clusters (Govoni et al. 2019; Botteon et al. 2020; Pignataro et al. 2024). However, the average surface brightness obtained from stacked filaments between galaxy clusters is two orders of magnitude lower at the same frequency (Vernstrom et al. 2021). If the detected emission results from energy released by accretion processes, deeper observations could potentially reveal its connection to the cosmic web.
With current data, the classification remains uncertain. However, considering the proximity of the three systems, multiple indicators of large-scale merger activity, and the radio power of the two ears, we favour the last proposed scenario.
5. Conclusions
In this Letter, we provide a comprehensive, radio, X-ray, optical, and WL analysis of the PSZ2 G083.29-31.03 galaxy cluster and its surroundings. In this system, we detected an extension to the previously known radio halo. The total projected linear extent of the 144 MHz radio emission reaches 5 Mpc. This emission is aligned with the X-ray emission detected by XMM-Newton and the mass distribution derived from galaxies and WL, which identified two low-mass systems at a redshift consistent with that of the main cluster, within the uncertainties. The detection was driven by the application of the Radio U-Net network (Stuardi et al. 2024) to the LoTSS survey.
If the three structures were connected to the same massive node of the cosmic web, the newly detected emission would reach R200. Emission on such large scales has been observed in an increasing number of massive (M500 > 5 × 10¹⁴ M⊙) galaxy clusters; however, this would be the first case of large-scale radio emission linked to merging sub-structures at such a relatively high redshift (z = 0.41). Conversely, if the three structures are merely aligned in projection, the two faint sources could represent powerful radio halos hosted by low-mass clusters. In either scenario, this system warrants particular attention for follow-up studies.
Finally, this work demonstrates the potential of ML in exploiting vast datasets such as the one provided by current generation wide-area radio surveys such as LoTSS and EMU. These methodologies will be even more necessary with the approaching advent of the Square Kilometre Array2.
Acknowledgments
We thank the Referee who stimulated the improvement of this manuscript. This paper is supported by the Fondazione ICSC, Spoke 3 Astrophysics and Cosmos Observations. National Recovery and Resilience Plan (Piano Nazionale di Ripresa e Resilienza, PNRR) Project ID CN_00000013 “Italian Research Center for High-Performance Computing, Big Data and Quantum Computing” funded by MUR Missione 4 Componente 2 Investimento 1.4: Potenziamento strutture di ricerca e creazione di “campioni nazionali di R&S (M4C2-19)” – Next Generation EU (NGEU), and it’s also supported by (Programma Operativo Nazionale, PON), “Tematiche di Ricerca Green e dell’Innovazione”. We acknowledge the CINECA award under the ISCRA initiative, for the availability of high performance computing resources and support. The HPC tests and benchmarks this work is based on, have been produced on the Leonardo Supercomputer at CINECA (Bologna, Italy) in the framework of the ISCRA programme IscrC_RICK (project: HP10CDUNG6). This work used LOFAR data, for which complete credits can be found at https://lofar-surveys.org/credits.html. This work made use of the DESI Legacy Imaging Surveys. The complete acknowledgements can be found at https://www.legacysurvey.org/acknowledgment/. M.S. acknowledges the financial contribution from INAF Theory Grant 2023: Gravitational lensing detection of matter distribution at galaxy cluster boundaries and beyond (1.05.23.06.17) and from the contract Prin-MUR 2022 supported by Next Generation EU (M4.C2.1.1, n.20227RNLY3 The concordance cosmological model: stress-tests with galaxy clusters). K.U. acknowledges support from the National Science and Technology Council of Taiwan (grant NSTC 112-2112-M-001-027-MY3) and the Academia Sinica Investigator Award (grant AS-IA-112-M04). R.G. acknowledges the Agence Nationale de la Recherche (ANR Grant ‘AMALGAM’) and Centre National des Etudes Spatiales (CNES) for financial support. Part of the WL analysis benefited from the infinity and morphomatic computing facilities at IAP.
References
- Alegre, L., Best, P., Sabater, J., et al. 2024, MNRAS, 532, 3322 [CrossRef] [Google Scholar]
- Amodeo, S., Mei, S., Stanford, S. A., et al. 2018, ApJ, 853, 36 [NASA ADS] [CrossRef] [Google Scholar]
- Applegate, D. E., von der Linden, A., Kelly, P. L., et al. 2014, MNRAS, 439, 48 [Google Scholar]
- Bade, N., Engels, D., Voges, W., et al. 1998, A&AS, 127, 145 [NASA ADS] [CrossRef] [EDP Sciences] [Google Scholar]
- Beduzzi, L., Vazza, F., Brunetti, G., et al. 2023, A&A, 678, L8 [NASA ADS] [CrossRef] [EDP Sciences] [Google Scholar]
- Botteon, A., van Weeren, R. J., Brunetti, G., et al. 2020, MNRAS, 499, L11 [Google Scholar]
- Botteon, A., Cassano, R., van Weeren, R. J., et al. 2021, ApJ, 914, L29 [NASA ADS] [CrossRef] [Google Scholar]
- Botteon, A., Shimwell, T. W., Cassano, R., et al. 2022a, A&A, 660, A78 [NASA ADS] [CrossRef] [EDP Sciences] [Google Scholar]
- Botteon, A., van Weeren, R. J., Brunetti, G., et al. 2022b, Sci. Adv., 8, eabq7623 [NASA ADS] [CrossRef] [Google Scholar]
- Bruno, L., Botteon, A., Shimwell, T., et al. 2023, A&A, 678, A133 [NASA ADS] [CrossRef] [EDP Sciences] [Google Scholar]
- CHEX-MATE Collaboration (Arnaud, M., et al.) 2021, A&A, 650, A104 [NASA ADS] [CrossRef] [EDP Sciences] [Google Scholar]
- Cuciti, V., de Gasperin, F., Brüggen, M., et al. 2022, Nature, 609, 911 [NASA ADS] [CrossRef] [Google Scholar]
- Cuciti, V., Cassano, R., Sereno, M., et al. 2023, A&A, 680, A30 [NASA ADS] [CrossRef] [EDP Sciences] [Google Scholar]
- Dey, A., Schlegel, D. J., Lang, D., et al. 2019, AJ, 157, 168 [Google Scholar]
- Eckert, D., Jauzac, M., Shan, H., et al. 2015, Nature, 528, 105 [Google Scholar]
- Foëx, G., Soucail, G., Pointecouteau, E., et al. 2012, A&A, 546, A106 [NASA ADS] [CrossRef] [EDP Sciences] [Google Scholar]
- Gheller, C., Vazza, F., & Bonafede, A. 2018, MNRAS, 480, 3749 [NASA ADS] [CrossRef] [Google Scholar]
- Giovannini, G., Cau, M., Bonafede, A., et al. 2020, A&A, 640, A108 [EDP Sciences] [Google Scholar]
- Govoni, F., Orrù, E., Bonafede, A., et al. 2019, Science, 364, 981 [NASA ADS] [CrossRef] [Google Scholar]
- Gupta, N., Norris, R. P., Hayder, Z., et al. 2024, PASA, 41 [Google Scholar]
- Jia, S. M., Böhringer, H., Pointecouteau, E., Chen, Y., & Zhang, Y. Y. 2008, A&A, 489, 1 [NASA ADS] [CrossRef] [EDP Sciences] [Google Scholar]
- Lastufka, E., Bait, O., Taran, O., et al. 2024, A&A, 690, A310 [NASA ADS] [CrossRef] [EDP Sciences] [Google Scholar]
- Mandelbaum, R., Rowe, B., Armstrong, R., et al. 2015, MNRAS, 450, 2963 [Google Scholar]
- Mostert, R. I. J., Duncan, K. J., Röttgering, H. J. A., et al. 2021, A&A, 645, A89 [NASA ADS] [CrossRef] [EDP Sciences] [Google Scholar]
- Nishiwaki, K., Brunetti, G., Vazza, F., & Gheller, C. 2024, ApJ, 961, 15 [NASA ADS] [CrossRef] [Google Scholar]
- Norris, R. P., Hopkins, A. M., Afonso, J., et al. 2011, PASA, 28, 215 [Google Scholar]
- Offringa, A. R., & Smirnov, O. 2017, MNRAS, 471, 301 [Google Scholar]
- Offringa, A. R., McKinley, B., Hurley-Walker, N., et al. 2014, MNRAS, 444, 606 [Google Scholar]
- Pignataro, G. V., Bonafede, A., Bernardi, G., et al. 2024, A&A, 691, A99 [NASA ADS] [CrossRef] [EDP Sciences] [Google Scholar]
- Planck Collaboration XXVII. 2016, A&A, 594, A27 [NASA ADS] [CrossRef] [EDP Sciences] [Google Scholar]
- Pointecouteau, E., Hattori, M., Neumann, D., et al. 2002, A&A, 387, 56 [NASA ADS] [CrossRef] [EDP Sciences] [Google Scholar]
- Rajpurohit, K., Vazza, F., van Weeren, R. J., et al. 2021, A&A, 654, A41 [NASA ADS] [CrossRef] [EDP Sciences] [Google Scholar]
- Sereno, M. 2015, MNRAS, 450, 3665 [Google Scholar]
- Sereno, M., Maurogordato, S., Cappi, A., et al. 2025, A&A, 693, A2 [NASA ADS] [CrossRef] [EDP Sciences] [Google Scholar]
- Shimwell, T. W., Röttgering, H. J. A., Best, P. N., et al. 2017, A&A, 598, A104 [NASA ADS] [CrossRef] [EDP Sciences] [Google Scholar]
- Shimwell, T. W., Tasse, C., Hardcastle, M. J., et al. 2019, A&A, 622, A1 [NASA ADS] [CrossRef] [EDP Sciences] [Google Scholar]
- Shimwell, T. W., Hardcastle, M. J., Tasse, C., et al. 2022, A&A, 659, A1 [NASA ADS] [CrossRef] [EDP Sciences] [Google Scholar]
- Shweta, A., Athreya, R., & Sekhar, S. 2020, ApJ, 897, 115 [CrossRef] [Google Scholar]
- Slijepcevic, I. V., Scaife, A. M. M., Walmsley, M., et al. 2024, RAS Tech. Instrum., 3, 19 [NASA ADS] [CrossRef] [Google Scholar]
- Snowden, S. L., Mushotzky, R. F., Kuntz, K. D., & Davis, D. S. 2008, A&A, 478, 615 [NASA ADS] [CrossRef] [EDP Sciences] [Google Scholar]
- Stuardi, C., Gheller, C., Vazza, F., & Botteon, A. 2024, MNRAS, 533, 3194 [NASA ADS] [CrossRef] [Google Scholar]
- Umetsu, K. 2020, A&A Rev., 28, 7 [NASA ADS] [CrossRef] [Google Scholar]
- Umetsu, K., Birkinshaw, M., Liu, G.-C., et al. 2009, ApJ, 694, 1643 [NASA ADS] [CrossRef] [Google Scholar]
- van Haarlem, M. P., Wise, M. W., Gunst, A. W., et al. 2013, A&A, 556, A2 [NASA ADS] [CrossRef] [EDP Sciences] [Google Scholar]
- van Weeren, R. J., Shimwell, T. W., Botteon, A., et al. 2021, A&A, 651, A115 [NASA ADS] [CrossRef] [EDP Sciences] [Google Scholar]
- Vernstrom, T., Heald, G., Vazza, F., et al. 2021, MNRAS, 505, 4178 [NASA ADS] [CrossRef] [Google Scholar]
- Voges, W., Aschenbach, B., Boller, T., et al. 1999, A&A, 349, 389 [NASA ADS] [Google Scholar]
- Wen, Z. L., & Han, J. L. 2024, ApJS, 272, 39 [NASA ADS] [CrossRef] [Google Scholar]
Appendix A: Radio data reduction and uncertainty on the radio flux density
The LoTSS DR2 observation of the PSZ2 G083.29-31.03 galaxy cluster was already presented by Botteon et al. (2022a). The calibration towards the cluster was optimized with the "extraction+selfcal" method (see van Weeren et al. 2021, for more details). This cluster was observed by LOFAR High Band Antennas (HBA) in two slots of 4h, which were combined in the P337+21 pointing. The original image at 20″ resolution released by the LoTSS DR2 (Shimwell et al. 2022) is shown in Fig. A.1.
We removed all sources unrelated to the diffuse emission by making an image with an inner uv-cut at 2865λ (corresponding to 0.02°∼400 kpc) and then subtracting the model of this image from the visibilities. For imaging and prediction procedures, we used the WSClean software (version 3.4; Offringa et al. 2014; Offringa & Smirnov 2017). We produced multi-frequency synthesis (MFS) images with 6 channels and used the multi-scale options with auto-masking (at 3σ) and auto-threshold (at 2σ). By imposing a Gaussian taper, we made images of the residual radio emission at different resolutions, shown in Fig. A.2 and 1. We note that the diffuse radio emission was completely deconvolved with this procedure. To align our images with the flux scale of the LoTSS DR2, we have used the same scaling factor computed by Botteon et al. (2022a), that is, 1.133. Additional information on all radio images presented in this work is listed in Table 1.
The zoom-in of the optical image with radio contours overlaid is shown in Fig. A.3 and A.4. Red contours show the image used for the subtraction of point-like sources, white contours show the residual diffuse emission, and green contours show the total emission at an intermediate resolution. This overlay testifies to the presence of faint diffuse emission that is not strictly connected to compact sources. However, some residuals from subtraction may contribute to shaping the faint extended emission. This contribution should also be considered in the total uncertainty of the measured flux density.
The uncertainty on the flux density given in Sect. 3.1 comprises both the statistical error related to the rms noise and the integration area, the systematic error due to uncertainty of the calibration (10% of the flux, see Shimwell et al. 2022), and another systematic error due to the unperfect subtraction of compact sources.
We estimated the latter contribution following the methodology described by Botteon et al. (2022a), who proposed an empirical approach based on the analysis of ∼300 galaxy clusters (see their Sect. 5). We computed the total flux density of discrete radio sources from the uv-cutted image (λ>2865) within the regions of the east and south-western ears. In both areas, this is less than 10 mJy (4.7 and 6.2 mJy, respectively). An uncertainty equal to the 16% of this flux density was added in quadrature to the statistical error and the 10% calibration error.
Furthermore, we estimated the potential contribution to the flux density of the two ears from faint compact sources, which could not have been subtracted because they are below the 3σ level of the uv-cutted image. We conducted the following test. We modified the model derived from the cleaning of the uv-cutted image by dividing the model image by a factor of 300 and rotating it by 90° and 180°. The scaling factor was selected such that the brightest source within the cluster field (peaking at 104 mJy/beam) was reduced to below the 3σ level of the image (0.36 mJy/beam). This procedure generated two additional models containing a population of faint compact sources. These sources mimic the spatial distribution of real sources, showing an increasing concentration toward the cluster centre, but all lie below the 3σ thresholds of the image.
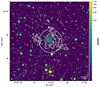 |
Fig. A.1. Original LoTSS DR2 image (144 MHz) of PSZ2 G083.29-31.03, on which Radio U-Net was applied. The restoring beam is shown in white at the bottom left corner and has a full-width half-maximum (FWHM) of 20″. The dash-dotted orange contours show the 3σ with σ = 0.13 mJy/beam. The white contours show the segmentation mask created by the network (0.2 in the probability map), while the circle has a radius R500 (Jia et al. 2008). |
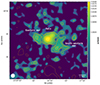 |
Fig. A.2. UV-subtracted LOFAR image (144 MHz) with restoring beam of 97″ × 100″. Solid orange contours are [2,3,6,12,24]×σ with σ = 0.59 mJy/beam. The dashed contour marks the -3σ level. Strong negative values are reached at the position of two sources which remained poorly subtracted. The shape of the restoring beam is shown in white at the bottom left corner. |
We added these two models to the previously uv-subtracted visibilities and created two new images using the same parameters as those used for the λ>80 and 60″ uv-tapered image. In these new images, the noise level remained unchanged (as all added sources were below the noise threshold), but the flux density of the two ears was intentionally increased.
For the eastern ear, the flux density in the original image is 20.36 mJy. With the faint source model injected at 90°, the flux density increased to 20.79 mJy, while with the model injected at 180°, it increased to 20.93 mJy. Similarly, for the south-western ear, the original flux density of 18.01 mJy rose to 18.19 mJy with the 90°-rotated model and 18.03 mJy with the 180°-rotated model. Thus, the maximum observed increase in flux density is approximately 3% of the measured flux. Although this is a simplified test, the results suggest that the contribution of un-subtracted compact sources is likely of this magnitude. The statistical error, computed as the rms noise multiplied by the square root of the number of beams, is 2 mJy for both ears, thus the systematic effect is lower than both the statistical error and the 10% calibration error.
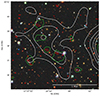 |
Fig. A.3. Zoomed-in view of the eastern ear of the optical image obtained from the Legacy Surveys. Red contours show the 3σ level of the LOFAR image created with an inner uv-cut of 2865λ, with restoring beam 4.5″ × 10.6″. White contours show the [3,5,7,9]×σ levels of the residual diffuse emission with restoring beam 69″ × 81″. Green contours show the 3σ level of the total emission, with a restoring beam of 27″ × 29″. |
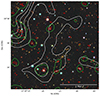 |
Fig. A.4. Zoomed-in view of the south-western ear of the optical image obtained from the Legacy Surveys. Contours are as in Fig.A.3. See also Table 1 for details about the radio images. |
Appendix B: X-ray data reduction
We retrieved and reduced ObsIDs 0147890101 and 0827360901 using the XMM-Newton Science Analysis System (SAS) v16.1.0 and the Extended Source Analysis Software (ESAS) data reduction scheme (Snowden et al. 2008). We performed a standard data reduction, which started by running emchain and epchain to generate calibrated event files for each observation. Thus, we obtained clean event files by filtering out time periods affected by soft proton flares by using the mos-filter and pn-filter tasks. Photon count images were extracted from the three detects of the EPIC camera in the 0.7–1.2 keV band, and then combined to produce a mosaic of the two ObsIDs.
Appendix C: Weak lensing data
For the WL analysis (for a review, see Umetsu 2020) we used the AMALGAM dataset based on archival Subaru Suprime-Cam and CFHT MegaPrime/MegaCam observations (Gavazzi et al. 2025; Umetsu et al. 2025, in preparation), produced within the Cluster HEritage project with XMM-Newton: Mass Assembly and Thermodynamics at the Endpoint of structure formation collaboration (CHEX-MATE; CHEX-MATE Collaboration 2021). Deep images in the B, g, V, r, RC, IC, z bands were used, and the shape of galaxies was done on the RC band using the model fitting capabilities of SExtractor (Mandelbaum et al. 2015). The attained density of faint background sources is about 24 arcmin−2. The WL mass map was created using a color–color selected background galaxy sample, following the map-making procedure outlined in Umetsu et al. (2009).
All Tables
All Figures
|
Fig. 1. Multi-wavelength view of the PSZ2 G083.29-31.03 galaxy cluster. The dashed red square marks the same region in all the panels. Top left panel: Optical image obtained from the Legacy Surveys/D. Lang (Perimeter Institute). Red stripes are saturation artefacts. The white circles mark the systems listed in Table 2 and have a radius equal to their estimated R500. The filled shaded white-to-red contours are at [2,3,6,12,24,48]×σ, with σ = 0.59 mJy/beam, of the low-resolution uv-subtracted 144 MHz LOFAR image (97″ × 100″). Top right panel: XMM-Newton image (0.7–1.2 keV) with a smoothing kernel of 3 pixels. Solid orange contours are [3,6,12,24]×σ, with σ = 0.58 mJy/beam, of the uv-subtracted LOFAR image with restoring beam of 68″ × 81″. The dash-dotted yellow contour is the 2σ level of the low-resolution LOFAR image. The two white circles are R500 and R200 of PSZ2 G083.29-31.03 (Jia et al. 2008). Bottom left panel: WL mass map created with a |
| In the text | |
|
Fig. A.1. Original LoTSS DR2 image (144 MHz) of PSZ2 G083.29-31.03, on which Radio U-Net was applied. The restoring beam is shown in white at the bottom left corner and has a full-width half-maximum (FWHM) of 20″. The dash-dotted orange contours show the 3σ with σ = 0.13 mJy/beam. The white contours show the segmentation mask created by the network (0.2 in the probability map), while the circle has a radius R500 (Jia et al. 2008). |
| In the text | |
|
Fig. A.2. UV-subtracted LOFAR image (144 MHz) with restoring beam of 97″ × 100″. Solid orange contours are [2,3,6,12,24]×σ with σ = 0.59 mJy/beam. The dashed contour marks the -3σ level. Strong negative values are reached at the position of two sources which remained poorly subtracted. The shape of the restoring beam is shown in white at the bottom left corner. |
| In the text | |
|
Fig. A.3. Zoomed-in view of the eastern ear of the optical image obtained from the Legacy Surveys. Red contours show the 3σ level of the LOFAR image created with an inner uv-cut of 2865λ, with restoring beam 4.5″ × 10.6″. White contours show the [3,5,7,9]×σ levels of the residual diffuse emission with restoring beam 69″ × 81″. Green contours show the 3σ level of the total emission, with a restoring beam of 27″ × 29″. |
| In the text | |
|
Fig. A.4. Zoomed-in view of the south-western ear of the optical image obtained from the Legacy Surveys. Contours are as in Fig.A.3. See also Table 1 for details about the radio images. |
| In the text | |
Current usage metrics show cumulative count of Article Views (full-text article views including HTML views, PDF and ePub downloads, according to the available data) and Abstracts Views on Vision4Press platform.
Data correspond to usage on the plateform after 2015. The current usage metrics is available 48-96 hours after online publication and is updated daily on week days.
Initial download of the metrics may take a while.