Fig. A.3.
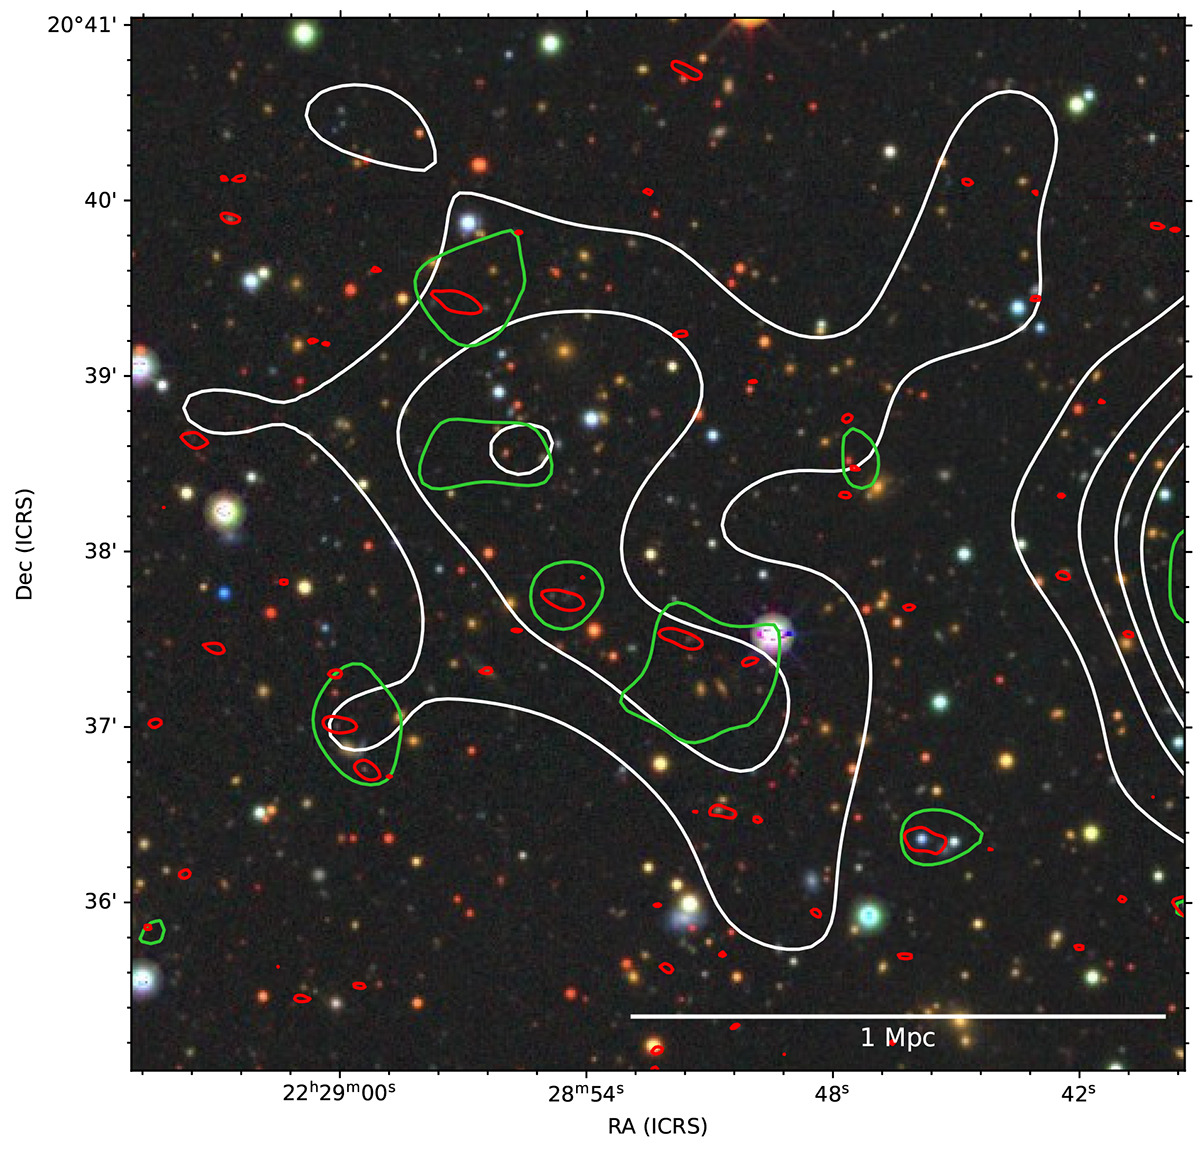
Download original image
Zoomed-in view of the eastern ear of the optical image obtained from the Legacy Surveys. Red contours show the 3σ level of the LOFAR image created with an inner uv-cut of 2865λ, with restoring beam 4.5″ × 10.6″. White contours show the [3,5,7,9]×σ levels of the residual diffuse emission with restoring beam 69″ × 81″. Green contours show the 3σ level of the total emission, with a restoring beam of 27″ × 29″.
Current usage metrics show cumulative count of Article Views (full-text article views including HTML views, PDF and ePub downloads, according to the available data) and Abstracts Views on Vision4Press platform.
Data correspond to usage on the plateform after 2015. The current usage metrics is available 48-96 hours after online publication and is updated daily on week days.
Initial download of the metrics may take a while.