Fig. 1.
Download original image
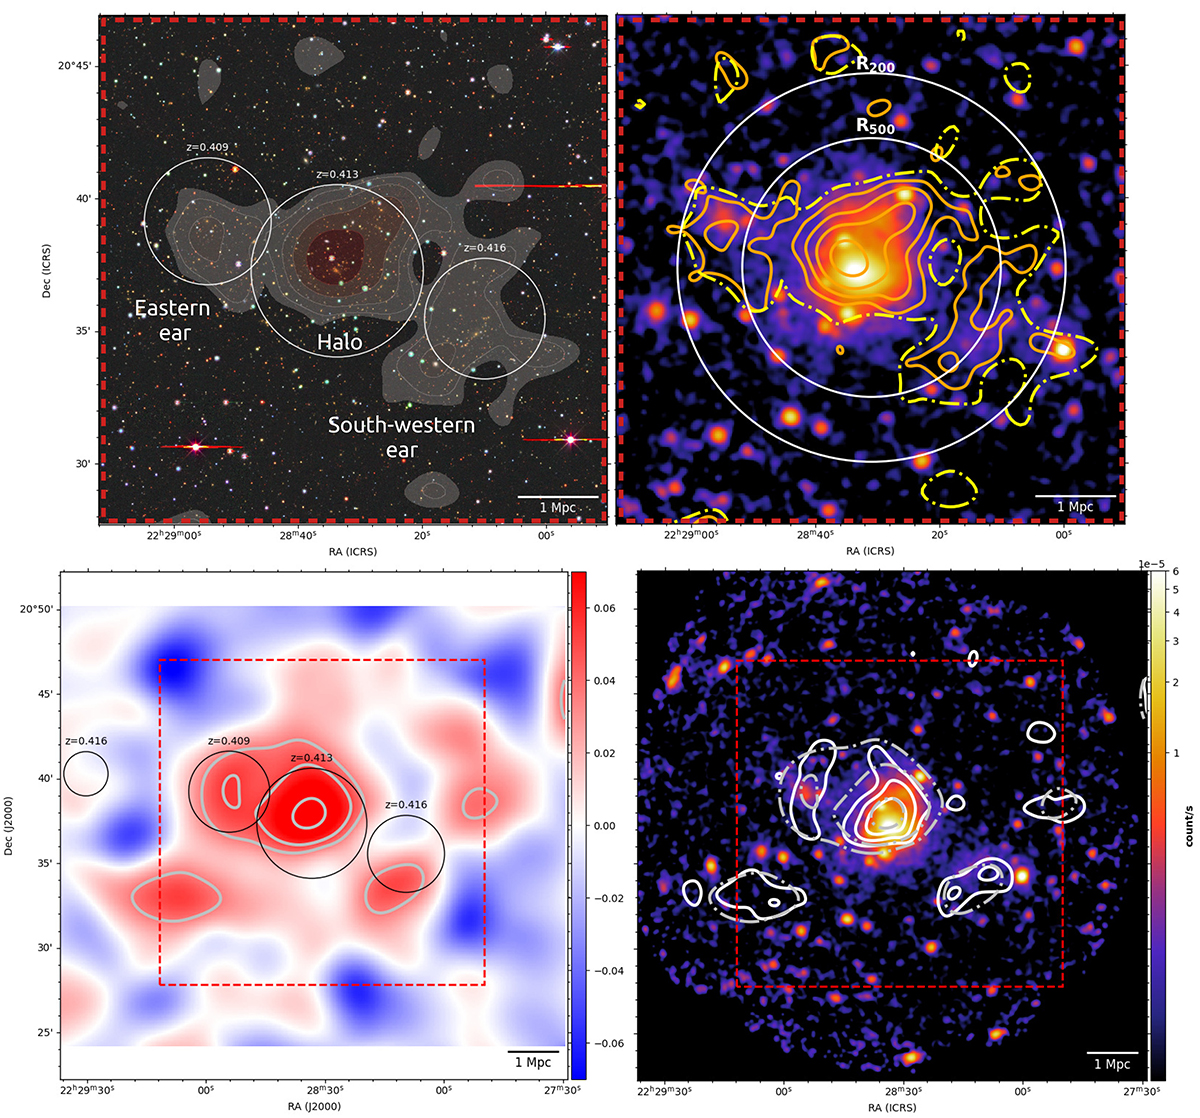
Multi-wavelength view of the PSZ2 G083.29-31.03 galaxy cluster. The dashed red square marks the same region in all the panels. Top left panel: Optical image obtained from the Legacy Surveys/D. Lang (Perimeter Institute). Red stripes are saturation artefacts. The white circles mark the systems listed in Table 2 and have a radius equal to their estimated R500. The filled shaded white-to-red contours are at [2,3,6,12,24,48]×σ, with σ = 0.59 mJy/beam, of the low-resolution uv-subtracted 144 MHz LOFAR image (97″ × 100″). Top right panel: XMM-Newton image (0.7–1.2 keV) with a smoothing kernel of 3 pixels. Solid orange contours are [3,6,12,24]×σ, with σ = 0.58 mJy/beam, of the uv-subtracted LOFAR image with restoring beam of 68″ × 81″. The dash-dotted yellow contour is the 2σ level of the low-resolution LOFAR image. The two white circles are R500 and R200 of PSZ2 G083.29-31.03 (Jia et al. 2008). Bottom left panel: WL mass map created with a ![]() FWHM Gaussian kernel. Silver contours show the 2σ, 3σ, and 5σ levels. The black circles are the same as in the top left panel. Top right panel: Zoom-out view of the XMM-Newton image shown in the top right panel. The white contours are 2σ, 3σ, and 4σ of the WL map created with a
FWHM Gaussian kernel. Silver contours show the 2σ, 3σ, and 5σ levels. The black circles are the same as in the top left panel. Top right panel: Zoom-out view of the XMM-Newton image shown in the top right panel. The white contours are 2σ, 3σ, and 4σ of the WL map created with a ![]() FWHM Gaussian kernel, while dash-dotted silver contours are the same as in the bottom left panel.
FWHM Gaussian kernel, while dash-dotted silver contours are the same as in the bottom left panel.
Current usage metrics show cumulative count of Article Views (full-text article views including HTML views, PDF and ePub downloads, according to the available data) and Abstracts Views on Vision4Press platform.
Data correspond to usage on the plateform after 2015. The current usage metrics is available 48-96 hours after online publication and is updated daily on week days.
Initial download of the metrics may take a while.