| Issue |
A&A
Volume 694, February 2025
|
|
|---|---|---|
| Article Number | A126 | |
| Number of page(s) | 16 | |
| Section | Planets, planetary systems, and small bodies | |
| DOI | https://doi.org/10.1051/0004-6361/202452321 | |
| Published online | 07 February 2025 | |
Irradiation origin and stability of CO on trans-Neptunian objects
Laboratory constraints and observational evidence from JWST/DiSCo-TNOs
1
Université Paris-Saclay, CNRS, Institut d’Astrophysique Spatiale,
Orsay,
France
2
Institute for Space Sciences and Technologies in Asturias, Universidad de Oviedo,
Spain
3
University of Central Florida, Department of Physics,
Orlando,
FL,
USA
4
Laboratoire de Géologie de Lyon: Terre, Planètes, Environnement, UMR 5276 CNRS, UCBL, ENSL,
Villeurbanne,
France
5
Max-Planck-Institut für extraterrestrische Physik,
Garching,
Germany
6
Florida Space Institute, University of Central Florida,
Orlando,
FL,
USA
7
Space Telescope Science Institute,
Baltimore,
MD,
USA
8
Northern Arizona University,
Flagstaff,
AZ,
USA
9
Instituto Astrofísico de Canarias,
La Laguna,
Tenerife,
Spain
10
Universidad de La Laguna,
Tenerife,
Spain
11
Fundación Galileo Galilei-INAF,
La Palma, S.C. de Tenerife,
Spain
12
Instituto de Astrofísica e Ciências do Espaço, Departamento de Física, Universidade de Coimbra,
Portugal
13
University of Canterbury, School of Physical and Chemical Sciences – Te Kura Matū,
Christchurch,
New Zealand
14
Lowell Observatory,
Flagstaff,
AZ,
USA
★ Corresponding author; elsa.henault@universite-paris-saclay.fr
Received:
20
September
2024
Accepted:
5
December
2024
Context. The James Webb Space Telescope large program DiSCo-TNOs has recently shown that CO2 ice is ubiquitous on 54 mediumsize trans-Neptunian objects (TNOs). TNO surfaces are found to define three main spectral and thus compositional groups that are likely linked to their position before planetary migration. CO ice is observed on the spectral type that is richest in CO2 and on the type that is richer in CH3OH and organics. Considerations on the thermal evolution of TNOs predicted the depletion of hypervolatiles such as CO from their surface layers, however.
Aims. We investigate a potential irradiation origin of CO as well as its stability by studying the distribution of CO in two TNO compositional types and compared it with irradiation experiments.
Methods. We studied the 4.68 µm band of CO and the 2.70 µm band of CO2 to probe the relation between the two molecules in 33 TNOs. We performed ion irradiation experiments on CO2 and CH3OH ices at 45 and 60 K with 30 keV H+ . We compared the laboratory spectra to TNO observations by focusing on the band areas and positions.
Results. We find that the two types of surfaces in which CO is detected are very distinct in terms of their relative abundances and chemical environment. CO that is observed on surfaces that are rich in CO2 are consistent with being produced by CO2 irradiation, specifically, at 45 K. On objects that are rich in CH3OH and complex organics, CO is more likely formed by irradiation of CH3OH. As the CO band areas are only partly related with temperature, the chemical environment plays a major role in the CO retention.
Conclusions. We find that the CO that is observed on TNO surfaces is compatible with being a secondary molecule that is entirely formed by late irradiation processes. Its abundance and stability is mostly controlled by the matrix from which it formed.
Key words: astrochemistry / solid state: volatile / methods: observational / techniques: spectroscopic / Kuiper belt: general
© The Authors 2025
 Open Access article, published by EDP Sciences, under the terms of the Creative Commons Attribution License (https://creativecommons.org/licenses/by/4.0), which permits unrestricted use, distribution, and reproduction in any medium, provided the original work is properly cited.
This article is published in open access under the Subscribe to Open model. Subscribe to A&A to support open access publication.
1 Introduction
Trans-Neptunian objects (TNOs) are icy bodies that mostly orbit beyond Neptune. Until recently, the characterisation of their surface composition has been limited except for the largest objects because spectroscopic data were only available below 2.5 µm (Barucci & Merlin 2020). Photometric observations revealed a colour dichotomy of the TNO surfaces (e.g. Tegler & Romanishin 2003; Peixinho et al. 2012; Fraser et al. 2023). To account for this, Brown et al. (2011) proposed a volatile retention scenario based on evaporation gradients in the protoplanetary disk (PPD). As the heliocentric distance in the compact PPD is the major driver of condensation and sublimation processes at the planetesimal surfaces, objects that formed inwards can only retain water (H2O) at their surface while the objects that formed farther out also start to retain carbon dioxide (CO2) and finally methanol (CH3OH) (Brown et al. 2011). This could have set the early surface composition of TNOs, which in turn would set their colour coupled with the irradiation of the dominant ice (Brunetto et al. 2006). Clear chemical information linking the presence of volatiles, their retention, and the current colours were still scarce (Dalle Ore et al. 2015).
Now, more than 50 medium-size TNOs (∼100–800 km) have been observed as part of DiSCo, a large program of the James Webb Space Telescope (JWST) executed in cycle 1. These spectra, covering the 0.7–5.1 µm range, provide unprecedented insight into their surface composition. Pinilla-Alonso et al. (2024a) found by clustering techniques that these TNO surfaces fell into three main spectral groups: The low-albedo dusty H2O-rich “bowl” type, the CO2-dominated “double-dip” type and the CH3OH-rich “cliff” type, which is more chemically complex and also the reddest type. Pinilla-Alonso et al. (2024a) argued that these spectral types reflect the distribution and retention of volatiles on TNOs before planetary migration, in accordance with a retention-line scenario (Brown et al. 2011). Consistent dynamical evidence indicates that bowl-type objects are formed inwards, double-dip objects are formed in between, and finally, cliff-type objects are formed the farthest out. All cold classical objects in the DiSCo sample belong to the cliff type, and their orbits are thought to have been affected least by planetary migration (Morbidelli & Nesvorný 2020).
Carbon dioxide (CO2) was detected in varying chemical states and abundances in all medium-size TNOs (De Prá et al. 2024). In objects in which CO2 is most abundant, CO2 is not mixed with either H2O or CH3OH, but is mostly pure. Variations in the abundance of CO2 were later shown to be correlated to the three spectral types, which means that CO2 is a pivotal molecule in defining the three TNO surface types (Pinilla-Alonso et al. 2024a). Carbon monoxide (CO) was firmly detected in 28 TNOs and was exclusively detected in those with the most abundant CO2 (De Prá et al. 2024), namely the cliff and double-dip types. In the outer Solar System, CO ice was previously only detected on the dwarf planet Pluto (Owen et al. 1993) and on Triton (Cruikshank et al. 1993; Quirico et al. 1999). Interestingly, CO ice appears to be absent from the surface of other large TNOs, such as the methane-rich dwarf planets Eris and Makemake (Grundy et al. 2024b), or Sedna, Gonggong, and Quaoar, all three displaying signatures of H2O, hydrocarbons, and CO2 (Emery et al. 2024).
CO ice is a major component of dense molecular clouds (Boogert et al. 2015; McClure et al. 2023) and PPDs (Sturm et al. 2023). TNOs, which formed in the outer part on the PPD, thus likely accreted CO ice. There is an emerging consensus, however, that these small bodies probably did not retain their primordial inventory of hyper-volatile ices, especially within their surface layers. CO is one of the most volatile species, so that it is easily depleted within a few kilometers from the surface through insolation (e.g. Lisse et al. 2021; Kral et al. 2021; Parhi & Prialnik 2023), or even from the bulk through radiogenic heating (e.g. Davidsson 2021; Malamud et al. 2022), on timescales of a few hundred million years. The survival up to the present day of CO in the bulk of small icy bodies as shown by CO detections in cometary comae (e.g. Harrington Pinto et al. 2022) therefore strongly relies on its trapping in more refractory ices such as CO2 and H2O (Simon et al. 2019).
The atmosphereless TNO surfaces are constantly exposed to energetic processing by the bombardment of ions from the solar wind (SW), solar energetic particles (SEPs), and Galactic cosmic rays (GCRs) (Cooper et al. 2004). The formation of CO can be triggered by irradiation of any ice containing carbon and oxygen that is exposed to the doses thought to have been accumulated at the surfaces of TNOs (Hudson et al. 2008). Specifically, CO2 and CH3OH are the most likely candidates for a radiolytic source of CO on TNO surfaces, considering their abundance in interstellar medium (ISM) ices and detection alongside CO ice on TNO surfaces.
We investigated the irradiation scenario as the source of the CO ice detected on TNO surfaces. We studied the distribution of CO in 33 TNOs and its relation with CO2 by analysing JWST observations. We performed new ion irradiation experiments to monitor the evolution of CO and CO2 when starting from distinct surfaces: One surface dominated by CO2 to reproduce the chemistry of double-dip-type TNOs, and the other surface dominated by CH3OH to reproduce the chemistry of cliff-type TNOs. We first present the experimental results to show that they shed light on the distribution of CO ice on TNOs. As already proposed by Satorre et al. (2000), the CO/CO2 ratio from irradiation experiments can be used to investigate the irradiation history and original ice composition of icy surfaces. Using this parameter, we discuss the implications of our results towards understanding of the origin and stability of CO ice.
2 Methods
2.1 Observational data
We used spectra obtained using the PRISM mode of the Near InfraRed Spectrograph (NIRSpec) during the large JWST cycle 1 general observers programme “Discovering the Surface Composition of trans-Neptunian Objects” (DiSCo-TNOs; program 2418; P.I.: N. Pinilla-Alonso). The spectra cover the range of 0.7–5.1 µm with a resolving power (λ/Δλ) from ~30 to ~300. The data reduction and spectral extraction were performed in the same way as in previous studies (De Prá et al. 2024; Pinilla-Alonso et al. 2024a; Licandro et al. 2024). The data reduction for the resolved binary Mors-Somnus was performed by Souza-Feliciano et al. (2024). Briefly, the raw uncalibrated data that were obtained using the NIRSpec integral field unit (IFU) and the low-resolving power PRISM mode were locally processed with the JWST calibration pipeline version 1.11.4 and reference file context jwst_1119.pmap. The spectra were extracted using a template point spread function fitting routine in background-subtracted slices (Wong et al. 2024). The reflectance spectra were obtained by correcting for the solar contribution by dividing the flux with that of the standard star SNAP-2 (Gordon et al. 2022).
Figure 1 presents the spectra of objects within the double-dip and cliff groups. 2004 PG115 was clustered among the cliffs, but its high CO2 abundance makes its CO2 behaviour consistent with double-dip objects. In contrast, Huya was clustered among the double-dips, but its CO2 poor surface aligns with that of the cliffs. The reason for this is that the clustering was performed throughout the whole wavelength range, where similarities were found between Huya and the double-dips that outweighed their different behaviour with respect to CO2 abundance. Huya and 2004 PG115 can be regarded as interesting hybrid objects, whose characteristics deserve further study.
We performed a Gaussian fitting to extract characteristic parameters such as the area, width, and centre of the 4.68 µm (2137 cm−1) CO band and of the 2.70 µm (3704 cm−1) CO2 band. We first converted the reflectance (R) into –log R and the wavelengths into wavenumbers. The bands can be intertwined with adjacent absorption, as shown in Fig. 1. The left side of the CO band receives contribution from absorption at 4.62 µm, which is attributed to OCN− and is most prominent in some cliff objects (Pinilla-Alonso et al. 2024a). The right side of the CO2 band is at the shoulder of the very broad O-H stretching band, which extends between 2.65 µm and 3.4 µm. To account for these variations in the continuum of the bands of interest, we defined different baselines. The band parameters obtained with varying baselines were averaged to obtain the value discussed here. The errors are a standard deviation around this average. Examples of the chosen baselines, wavenumber ranges, and results of the Gaussian fitting procedure are presented in Appendix A.
We analysed 38 objects with this method and chose to discard 5 objects whose CO detection we considered uncertain based on the band centre, width, and local noise. These 5 objects are discussed in Appendix B, but not in the sections with the results and discussion. The tables that list the band parameters we extracted, as well as all other relevant physical and dynamical parameters, for the 33 objects with a confident CO detection are presented in Appendix C.
 |
Fig. 1 Spectra of the sample of objects studied here. Spectra are normalised to unity at 2.6 µm. Objects are coloured and overlap according to their spectral types. Double-dip objects are shown at the top in orange and cliff objects are at the bottom in red. The thick lines represent the average of each group. Huya and 2004 PG115 are presented in the middle in grey to highlight their mixed spectral characteristics. Except for the cliff group, the spectra are offset vertically for clarity. The most characteristic bands of CO2, CO, and CH3OH are marked with vertical lines. The variability of CH3OH bands within the cliff group was studied by Brunetto et al. (2025). |
2.2 Laboratory experiments
Irradiation experiments were performed using the IrradiatioN de Glaces et Météorites Analysées par Réflectance (INGMAR) joint setup of IAS-IJCLab (Orsay, France) as previously described in Urso et al. (2020). INGMAR is a high-vacuum chamber (P ≤ 10−7 mbar) interfaced with a closed-cycle He-cryocooler allowing the cooling of a substrate down to temperatures relevant to the study of TNOs. Gas was introduced in the chamber through a low-flow inlet valve and was then condensed on a cooled MgF2 substrate in a background-deposition regime (Dohnálek et al. 2003). The deposited ices were irradiated by H+ accelerated to 30 keV by the SIDONIE ion separator (MOSAIC platform; IJCLab, Orsay, France) (Chauvin et al. 2004). Protons at 30 keV mainly lose their energy in the inelastic regime, which is thought to dominate on TNO surfaces (Quirico et al. 2023). The extent of the energetic processing is characterised using the irradiation dose (expressed in eV/16 u, with u being the atomic mass unit). The final irradiation dose is representative of what is expected to accumulate at the surfaces of TNOs over timescales of billions of years (Hudson et al. 2008; Loeffler et al. 2020; Quirico et al. 2023).
We carried out irradiation experiments on pure CO2 ices at 45 K to reproduce the chemistry of double-dip-type TNOs and on CH3OH ices, pure and mixed with H2O, at 35, 45, and 60 K to reproduce the chemistry of cliff-type TNOs. Laboratory spectra and a table presenting the parameters of each experiment are available in Appendix D, as well as a further description of our experimental methods. The chemical evolution of ice under irradiation was probed in situ in transmission mode by a Fourier-transform infra-red spectrometer. We then converted transmittance (T) spectra into absorbance (–log T) and extracted the area, width, and centre of the 4.68 µm CO band and the 2.70 µm CO2 band by a Gaussian fitting.
2.3 Comparing laboratory spectra to observations, and estimation of the relative abundance of CO/CO2
In order to obtain a parameter common to the laboratory spectra and TNO observations that characterises CO and CO2 , we used the area of the 4.68 µm CO band divided by that of the 2.70 µm CO2 band, namely the CO/CO2 band area ratio. The comparison between laboratory absorbance band area ratios and observed reflectance band area ratios is valid within a certain assumption. The 4.68 and 2.70 µm band areas retrieved from TNO spectra are assumed to be proportional to the abundance of the absorbing molecule within the thickness probed by the photons, as is the case for the non-saturated transmission laboratory spectra. This is true in a reflectance regime of volume scattering, where photons undergo multiple internal scattering events before emerging from the surface and thus probe a substantial volume of ice. We expect volume scattering to dominate for the CO and the 2.7 µm CO2 band, but this is not the case of the fundamental CO2 band, which is seen to display peculiar scattering properties (De Prá et al. 2024), and of the broad O-H stretching feature at 3 µm, which might show signs of saturation in some objects (Pinilla-Alonso et al. 2024a). The fundamental CO2 band was not used for the quantification since surface scattering, where photons probe shallow layers, dominates and the band area is not linearly related to the abundance of the absorbing molecule.
A quantitative assessment is possible when the band areas (a in cm−1 ) are combined with the band strength (A in cm molecule−1 ) of the associated vibration. The band strengths are measured in the laboratory and represent the activity of a vibrational mode, similarly to optical constants. They are commonly used to recover the column density (N in molecule cm−2) from laboratory spectra and spectra of ISM ices. We obtained the relative abundance of CO and CO2 from the following relation, using the band strengths discussed in Appendix E:

This simple method gives a good estimation of the relative abundance of CO and CO2 , which to first order should be similar to quantification from scattering models. Estimates using models are difficult at this stage, as was explored by Brown & Fraser (2023) and De Prá et al. (2024), because of model limitations, the quality of optical constants, and the great variety of possible compounds in the whole wavelength range, but they should be performed in the future to refine the present work.
For each object, the corresponding CO/CO2 band area ratio and N(CO)/N(CO2) relative abundances are listed in Appendix C. In the remainder of this work, we present the relative abundance because it gives an idea of the chemical proportions, and the band area ratio because it is not biased by the choice of the band strengths.
The physico-chemical effects of the irradiation of ices are manifold (Rothard et al. 2017): radiolysis-induced chemistry, sputtering that erodes the ice film, ion implantation, ice compaction, and amorphisation. For ices that are irradiated at temperatures higher than the typical ∼10 K, these effects vary because the produced radicals have more mobility and because species that formed above their sublimation temperature enter sublimation equilibrium until only the efficiently trapped molecules remain. For a comprehensive view of chemical pathways, we refer to Pilling et al. (2023) for CO2 irradiation and to Rocha et al. (2023) for CH3OH irradiation. Our goal was not to resolve these different processes. We focused on a set of parameters that can be obtained in the laboratory and that are directly comparable to TNO observations: the relative abundances, and the band centre. These parameters hold information concerning the initial ice composition, temperature, and irradiation doses, as we show in the following results. We also combined the results of our experiments with available literature data to show the clear trends in the evolution of CO and CO2 with the aforementioned parameters.
 |
Fig. 2 Evolution of N(CO)/N(CO2) as a function of irradiation dose for CO2 ices (left panel) and CH3OH ices (right panel). Experimental points are colour-coded so that blue points represent the colder irradiated ices, and red points represent the warmer ices. The data that are connected by a dashed line correspond to thin experiments that received increasing doses, and the others are thick experiments that received a single dose. The errors from experimental data are within the symbol size. The average N(CO)/N(CO2) value for the double-dip objects is presented for comparison alongside the CO2 experiments, and the average value for cliff objects is presented alongside the CH3OH experiments. The shaded rectangles correspond to the standard deviation around this average. We cannot present the CO/CO2 band area ratio because most previous studies focused on the ν3 fundamental CO2 band area and not on the area of its ν1 + ν3 combination mode band. |
3 Results
3.1 Chemical evolution under irradiation
In Fig. 2, we present the evolution of the relative abundance of CO and CO2 as a function of the irradiation dose for initial ices dominated by CO2 in the left panel and for initial ices dominated by CH3OH in the right panel. The irradiation of CO2 is known to produce CO as a major product, as well as carbonic acid and various carbon oxides as minor products (Brucato et al. 1997; Raut & Baragiola 2013; Bennett et al. 2014). We found that N(CO)/N(CO2) increases with increasing irradiation dose until an equilibrium between reactant and product molecules is reached, above ∼20 eV/16 u. Interestingly, N(CO)/N(CO2) balances around different values depending on the temperature of the ice. Ices between 10 and 25 K reach equilibrium values of ∼0.6, while ices between 45 and 50 K reach lower values of ∼0.1. The colder irradiated CO2 ices can hold more CO than the warmer ices above the sublimation temperature of pure CO ice; between 27 and 30 K in our experimental conditions (Grundy et al. 2024a). Sputtering, whose efficiency drastically increases with increasing temperature, depletes the irradiated ice in CO because it is preferentially expelled to the gas phase compared to CO2 (Raut & Baragiola 2013).
The irradiation of CH3OH is known to produce many abundant and light products, such as CO, CO2, H2O, H2CO, and CH4 (Baratta et al. 1994; Moore et al. 1996; Quirico et al. 2023). It also produces more complex organic molecules, far harder to identify with infrared spectroscopy, that are rich in alcohol groups (Zhu et al. 2020), and that might cause the red colouring of irradiated methanol (Zhang et al. 2024). We found that N(CO)/N(CO2) decreases with increasing irradiation dose until a stable value is reached for doses above ∼50 eV/16 u. This value is independent of the temperature of the ice. Fig. 2 shows that polar compounds such as the initial CH3OH and the secondary H2O, H2CO and complex organic compounds that are rich in alcohol groups trap CO with similar efficiencies between 10, 45, and 60 K. These compounds are also more efficient than a CO2 matrix at 45 K for CO retention. Finally, the stable N(CO)/N(CO2) value depends on the initial ice composition. When the corresponding dose threshold is reached, the irradiation of pure CH3OH ices favours more CO (N(CO)/N(CO2)∼2), while irradiation of mixtures of equal amounts of CH3OH and H2O favours more CO2 (N(CO)/N(CO2)∼0.6). Mixtures with an initially high O/C have more available oxygen to form more CO2 than CO.
To summarise, in the CO2 and CH3OH irradiation, CO forms within the irradiated ice and is trapped within its amorphous structure as it remains in the solid phase above its sublimation temperature. The efficiency of this trapping depends on the nature of the ice matrix, which is composed of the remaining initial ice and the other irradiation products.
Double-dip type TNOs, which are particularly rich in CO2 , have an average N(CO)/N(CO2) value of 0.09 ± 0.02. By comparing these observations to the CO2 irradiation experiments in Fig. 2, we find that the abundance of CO relatively to CO2 on double-dip-type TNOs perfectly matches that of CO2 irradiation at 45 K. Cliff TNOs, which are richer in methanol and organics, have an average N(CO)/N(CO2) value of 0.45 ± 0.24. Comparing these observations to CH3OH irradiation experiments, we find that it matches an initial mixture of CH3OH and H2O in equal proportions.
Our results indicate that CO is formed at the surface of TNOs through the irradiation of two distinct parent molecules, in accordance with their observed spectral type. The production of CO2 from CH3OH irradiation also implies that at least part of the CO2 observed on cliff surfaces is secondary.
Other irradiation products of CO2 and CH3OH might be detected within the NIRSpec range. CO3, a product of CO2 irradiation at low doses, has a feature at 4.89 µm with a band strength similar to that of CO (Martín-Doménech et al. 2015). A rather sharp ∼4.9 µm feature is tentatively detected in double-dip TNOs (Pinilla-Alonso et al. 2024a), as shown in Fig. 1, and might be attributed to CO3. Other species have features in this region, namely CO2 itself, although its unassigned 4.9 µm band is ∼250 times weaker than the known 2.7 µm band (Quirico & Schmitt 2004). OCS, observed on interstellar icy grains (McClure et al. 2023), has a strong ν3 band at 4.88 µm that might be distinguished from CO3 based on the bandwidth (Ferrante et al. 2008). Based on the band strengths and relative band areas, Pinilla-Alonso et al. (2024b) argued that OCS and CO3 are more probable candidates than CO2 to account for the 4.9 µm band observed on Chiron, a CO2-rich Centaur. H2CO and CH4 are abundantly formed by CH3OH irradiation. Below 5 µm, their most intense features are C-H stretching modes (Bouilloud et al. 2015). They do not stand out from the broad 3.4 µm band of irradiated CH3OH (see Fig. D.1.), however, and they are not discernable in cliff-TNOs either. At shorter wavelengths, fine combination bands of CH4 have allowed its detection on Quaoar (Emery et al. 2024). However, this was made possible by the use of medium-resolution spectroscopy, which is not the case for the DiSCo-TNOs dataset. To conclude, both double-dip and cliff-type spectra are compatible with irradiation products other than CO, but further investigations are necessary to clearly identify them.
3.2 CO/CO2 and chemical environment on TNOs
In Fig. 3, we plot N(CO)/N(CO2) as a function of the position of the 2.70 µm CO2 band for individual objects. As shown in De Prá et al. (2024), the observed 2.70 µm bands display a wide range of band centre positions. This is related to the variability in the chemical environment of CO2. The authors showed that the objects that are richest in CO2 absorb on a shorter wavelength range that is typical of pure CO2 ices or CO2:CO ice mixtures. Objects that are poorer in CO2 absorb on a longer wavelength range that is typical of CO2 mixed in H2O or CH3OH. Fig. 3 shows that the position of the CO2 band confirms a clear separation between double-dip and cliff groups (Pinilla-Alonso et al. 2024a). The CO2 molecules are indeed in very distinct chemical environments in the two surface types: a mostly apolar matrix on the double-dip surfaces, and a polar matrix on cliff surfaces.
CO2 is detected as mostly pure on double-dip surfaces, which also show an O–H absorption (Fig. 1). This suggests that segregation, either areal or within layers, prevents the abundant CO2 from being mixed with the polar compounds (Öberg et al. 2009a). Conversely, CO2 on cliff-type surface is less abundant and mixed with the carriers of the strong O-H absorption. Fig. 3 also shows that the band centre positions and N(CO)/N(CO2) of cliff spectra are more spread than those of double-dip, which is consistent with cliff-type surfaces being most chemically complex (Pinilla-Alonso et al. 2024a). N(CO)/N(CO2) also allows us to separate the cliff and double-dip objects. Finally, Fig. 3 contains our experimental points derived from experiments of CO2 ice irradiated at 45 K and CH3OH ices, pure and mixed with H2O, irradiated at 60 K. The good match between the two spectral type and the corresponding landmark experiment highlights that TNO surfaces are compatible with an irradiation origin of CO in terms of the relative abundance, but also in terms of chemical environment.
We note that a similar trend as in Fig. 3 could have been obtained regarding the CO band centre. We found that the mean CO band centre lies at 4.680 ± 0.002 µm for double-dip objects and at 4.686 ± 0.04 µm for cliff objects (see Appendix C). The CO band in cliff objects is shifted to longer wavelengths by ∼6 nm compared to double-dip objects. This is consistent with CO on cliff surfaces being more likely mixed with polar molecules such as H2O and CH3OH, rather than with CO2. Based on transmission laboratory spectra, a redshift of up to ∼15 nm is observed for the CO band between CO:CO2 mixtures and CO:H2O:CH3OH mixtures (Rocha et al. 2022). However, an absolute comparison between the observed CO band centre of TNOs and laboratory spectra is less straightforward than with the CO2 2.7 µm band used by De Prá et al. (2024). This is probably due to potential uncertainties in the PRISM wavelength solution above 4 µm, as previously noted by Brown & Fraser (2023).
 |
Fig. 3 N(CO)/N(CO2) as a function of the position of the centre of the 2.70 µm CO2 band for individual double-dip objects (orange crosses) and cliff objects (red squares). The shadowed regions in the graph represent the range of points we obtained during CO2 irradiation experiments at 45 K (orange) and CH3OH irradiation experiments, pure and mixed with H2O, at 45–60 K (light red). The horizontal dashed red line represents a lower limit for cliff object 1999 OX3 , which lacks the 2.7 µm CO2 band. Huya (grey cross) is clustered as a double-dip, but behaves like a cliff in terms of CO and CO2. Conversely, 2004 PG115 (grey square) is clustered as a cliff, but behaves like a double-dip in terms of CO and CO2. |
 |
Fig. 4 Evolution of the band area of CO (top panels) and of N(CO)/N(CO2) (bottom panels) as a function of diameter, equilibrium temperature, and aphelion. Objects are colour-coded according to their spectral types. double-dip-type TNOs are plotted as orange crosses, cliff-type TNOs as red squares, and the two hybrid objects, Huya and 2004 PG115, in grey. The uncertainties for the CO band area and N(CO)/N(CO2) come from fitting the NIRSpec data as described in Appendix A. The diameter uncertainties come from radiometric studies. The temperature points represent the equilibrium temperature at the heliocentric distance at the time of the JWST observation. The horizontal lines represent the equilibrium temperature that is reached at aphelion and perihelion. The aphelion uncertainties are well below the symbol size. All physical and dynamical parameters are given in Table C.2 |
3.3 CO/CO2 with respect to diameter, temperature, and aphelion distance
We investigated the abundance of the CO and the CO/CO2 ratio with respect to the diameter as a proxy to assess the contribution from internal bulk CO to the surface properties. De Prá et al. (2024) found that the depth of the fundamental CO2 band was not correlated with the diameter of medium-size TNOs. Likewise, Pinilla-Alonso et al. (2024a) found that the spectral groups are not correlated with the diameter. We found no correlation between the diameter and the abundance of CO, probed by its band area, as shown in panel A of Fig. 4. Panel B shows no correlation between N(CO)/N(CO2) and diameter either. This suggests that at least in this size range, the presence of CO ice is not related to bulk properties or processes, but is rather linked with surface processes.
Because CO is a very volatile component, it is not expected to survive at the surface of atmosphereless bodies for long timescales. We computed a single equilibrium temperature for the entire surface of each body (see Appendix C) to assess the thermal effects. In addition to the temperature at the distance at which objects were observed by JWST, we considered two extreme points of the orbit: the aphelion (lowest orbital temperature), and the perihelion (highest orbital temperature). It is difficult to interpret the abundance of CO and the CO/CO2 ratio as a function of temperature. First, we found that the CO abundance shows some variation with temperature. The four objects (cliff type) with the least amount of CO are the warmest objects in the sample, with equilibrium temperatures at the time of observation ≥50 K. However, the objects that are richest in CO (three objects, also cliff type) do not reach temperatures below 30 K, where CO would be more stable against sublimation, even at aphelion. This seems puzzling given that double-dip-type TNOs, which all reach colder temperature than cliffs on average, do not have more CO than cliffs. This indicates that the temperature is not the only factor playing a role in the retention of CO ice at the surface.
In panel D of Fig. 4, we present N(CO)/N(CO2) as a function of temperature. We expect CO, which is the most volatile of the two species, to be preferentially lost over CO2 with increasing temperature. Laboratory experiments indeed show this decrease in N(CO)/N(CO2) when ices irradiated at low temperatures are then warmed (Satorre et al. 2000), which is consistent with the different desorption behaviours of CO and CO2 (Collings et al. 2004). In our sample, no obvious trend is observed, especially since double-dip-type objects are all observed at similar distances and thus temperatures, which makes it hard to determine any evolution of N(CO)/N(CO2) with temperature. Cliff-type objects reach higher temperatures and might show a potential trend of increasing N(CO)/N(CO2) with increasing temperature. Surprisingly, this is opposite to the behaviour expected from laboratory data, which suggested that CO2 is very efficiently lost for T ≥ 50 K. In any case, we can infer that the range of N(CO)/N(CO2) cannot be set by temperature alone, but rather by a combination of initial abundances, chemistry, and temperature.
Finally, we plot the band area of CO and N(CO)/N(CO2) as a function of aphelion distance in panels E and F of Fig. 4. We mark the approximate current position of the termination shock and heliopause to highlight changes in the radiation environment of the objects (Stone et al. 2019). In the band area of CO, we observe no trend with aphelion for cliffs, but a small increasing trend for double-dips. For N(CO)/N(CO2), we observe no clear trend with increasing aphelion distance. Specifically, double-dip-type TNOs show similar N(CO)/N(CO2) ratios throughout the whole range of aphelion distances because the CO2 abundance follows the same slight increase as CO. This highlights the role of the temperature at aphelion, which allows eccentric double-dip-type TNOs to be generally slightly icier than the less eccentric double-dip-type TNOs. Cliff-type TNOs might show a decreasing trend in N(CO)/N(CO2) with increasing aphelion distance, but this needs further investigations to be confirmed.
4 Discussion
We recapitulate the evidence that CO more likely has an irradiation than a primordial origin. We then discuss the irradiation doses and timescales needed to accumulate the observed CO ice. We point out the link of the stability of CO ice to each compositional group. Finally, we discuss some perspectives for a further comparison of laboratory spectra and TNO observations.
4.1 Evidence of an irradiation origin of CO ice
While thermal evolution models do not explicitly resolve the extremely shallow surface layer probed by infrared spectroscopy (from one µm to several hundred µm), they suggest that CO should be depleted from much thicker layers (tens of meters to kilometers) relatively quickly after the formation of mediumsize TNOs (e.g., Davidsson 2021; Steckloff et al. 2021; Kral et al. 2021; Parhi & Prialnik 2023). Therefore, we can anticipate that during the time-frame that shaped the three spectral types before and after planetary migration, most if not all of the primordial CO ice was lost from the surface layers of TNOs within ~200 Myr.
A possibility for the amount of observed CO ice would be a resupply from the bulk of the object because Birch & Umurhan (2024) found that CO gas can be sustained within a porous structure such as that of Arrokoth. The size-dependent thermal model of Malamud et al. (2022) showed that CO can migrate from the bulk of the nucleus due to radiogenic heating and might enrich outer amorphous water-ice layers, where it can recondense. For the largest TNOs, the framework of Jeans escape would also come into play, favouring the retention of CO at the surface with increasing object size (Schaller & Brown 2007). Here, in the intermediate size range, the lack of a correlation between the CO band area and diameter (Fig. 4) argues against the idea that the abundance of CO ice at the surface is controlled by internal and size-related processes.
In double-dip-type TNOs, CO2 is about ten times more abundant than CO. This is a clear divergence from ISM ices, where CO2 is found to vary from about twice less abundant than CO McClure et al. (2023) to about three times more abundant than CO (Boogert et al. 2015). Another clear divergence from ISM ices is the fact that CO2 on double-dip-type TNOs is not mixed with polar compounds. In cliff-type TNOs, CO2 is only about four to five times more abundant than CO, with more variability than for double-dip-type objects. CO2 is a key molecule for separating the cliff and double-dip group in abundance and in chemical state (Fig. 3). This indicates that the two groups formed in different regions of the PPD (Pinilla-Alonso et al. 2024a). The CO abundance does not provide a clear separation between the two groups, however, as seen with the CO band area in Fig. 4. This suggests that CO is not one of the components that sculpted the three spectral groups and is more likely secondary.
Our results show that irradiation processes can fully reproduce CO observations in the two spectral groups. Fig. 2 and Fig. 3 show that irradiation of CO2 at 45 K can fully reproduce the characteristics of double-dip-type surfaces, while irradiation of CH3OH is a closer match for cliff-type surfaces. We stress the importance of performing irradiation experiments at temperatures appropriate for TNOs. The CO2 irradiation at 10 K does not match the relative abundance of double-dip-type TNOs.
4.2 Irradiation doses and timescales
Fig. 2 shows that double-dip surfaces are consistent with accumulated irradiation doses ≥20 eV/16u, and cliff surfaces would be more consistent with accumulated irradiation doses ≥50 eV/16u. Although estimates vary in the studies (Hudson et al. 2008; Loeffler et al. 2020; Quirico et al. 2023), these doses can only be accumulated in at least ~1 Gyr, which is much longer than the timescales of primordial CO loss. We conclude that the observed CO must have been accumulated on long timescales. This is consistent with the fact that TNO surfaces, specifically those of cold classicals (Spencer et al. 2020), are thought to be old.
A numerical simulation made within the radiation environment of Arrokoth at 44 au found that the top 100 µm could have accumulated from 150 to 600 eV/16 u within 4.5 Gyr (Quirico et al. 2023). Objects venturing outside of the termination shock and heliopause are exposed to an increased flux of GCRs and accumulate higher irradiation doses than at 44 au for a similar amount of time (Cooper et al. 2004). Sedna, Gonggong, and Quaoar are candidate dwarf planets with an at first glance similar surface composition of H2O, CO2, and hydrocarbons. However, their hydrocarbon composition differs. This can be related to the amount of CH4 each object could sustain at the surface and to the extent of irradiation they endured in the farther regions of the outer Solar System (Emery et al. 2024). Methane chemistry (Zhang et al. 2023) combined with its likely origin from dwarf planet internal processes (Glein et al. 2024) is very different from the CO2 and CH3OH chemistry investigated here for the more primitive surfaces of medium-size TNOs. For double-dip-type TNOs, we find no clear variation in CO/CO2 with different radiation environments, as shown in the aphelion panel of Fig. 4. This is most likely because CO/CO2 becomes independent of the irradiation dose above a threshold of ~20 eV/16u, as shown in Fig. 2. In CH3OH dominated ices, the CO/CO2 becomes stable at higher doses (>50 eV/16 u). Irradiation-induced variations in CO/CO2 within the cliff-type TNOs are thus more likely to be observed than in double-dip-type TNOs.
As sputtering erodes surface ices and exposes fresher subsurface ices, it has the effect of lowering the total accumulated irradiation dose at the surface (Quirico et al. 2023). Moreover, sputtering preferentially expels species following their volatility (Dartois et al. 2023), meaning that CO2 is sputtered more efficiently than CH3OH and H2O. The consequence for TNO surfaces is that double-dip-type surfaces might accumulate lower irradiation doses than cliff- and bowl-type surfaces. Raut & Baragiola (2013) have shown the critical role of the temperature in increasing the sputtering efficiency for CO2 ices. Sputtering yields for other relevant materials at temperatures above 10 K are scarce, however. New laboratory measurements are necessary to refine the dose estimates of Quirico et al. (2023) with these new TNO spectral types in mind.
4.3 Stability of CO within different chemical environments and temperatures
CO that is formed by irradiation of a less volatile parent ice can remain trapped within an amorphous structure above its sublimation temperature. Moreover, Fig. 2 shows that at 45 K, CH3OH ice irradiation produces and retains more CO relatively to CO2 than CO2 irradiation. We found that CO is probably best retained in the polar matrix of irradiated CH3OH rather than in the apolar matrix of irradiated CO2. Interestingly, Simon et al. (2019) found that CO2 could trap CO more efficiently than H2O ice for temperatures below 70 K, probably due to particular CO2 restructuring dynamics around ∼30 K, at which temperature CO desorbed in their experimental set-up. Here, the irradiation temperature is already above the CO desorption temperature, which might hinder this process, as well as irradiation-induced structural changes and increased sputtering yields.
The temperature panels of Fig. 4 show that CO may be more abundant and thus more stable on the polar but on average warmer cliff surfaces than on the apolar but on average colder double-dip surfaces. Moreover, Maté et al. (2019) found that CO is more stable against thermal desorption when adsorbed at the surface of hydrogenated amorphous carbon (HAC) than H2O, with specifically strong interactions with aromatic-rich HAC. This might be an additional efficient retention mechanism for CO to increase its stability at the surfaces of the complexorganics-rich cliff type, particularly as aromatic compounds can be formed by irradiation of CH3OH (Zhang et al. 2024). Interactions with hydrocarbons might also help shift the band centre of CO to the longer wavelength range where it is observed, as seen in the spectra of irradiated ices containing cyclo-hexane (Pilling et al. 2012) or in CO:C4H10 mixtures (Palumbo & Strazzulla 1993).
Fig. 4 shows that no object with a perihelion equilibrium temperature above 50 K is rich in CO. This is consistent with the absence of CO on the surfaces of inactive Centaurs reaching higher perihelion temperatures than TNOs (Licandro et al. 2024). Huya is one of the four objects of the sample with the closest perihelion and low CO2 and CO abundance. This object alone is classified as a double-dip-type TNO with a perihelion below 32 au, which might explain its divergence from this CO2-rich group. As no double-dip-type inactive Centaurs are observed (Licandro et al. 2024), double-dip-type surfaces are expected to evolve very quickly by loosing their surface volatiles when they reach the giant planet region. Finally, in the active Centaur Chiron, with a surface dominated by CO2 (Pinilla-Alonso et al. 2024b), the detected CO ice on the surface might, like that of double-dip-type TNOs, be formed by irradiation of the dominating ice.
We also note that the strong overlap between the equilibrium temperature ranges of many objects prevents clear trends from emerging. Dedicated efforts to better represent temperature variations over the lifetime of TNOs, such as those of Gkotsinas et al. (2023) for comets, might prove necessary to provide a deeper understanding of the evolution of surface volatiles within the different spectral types.
4.4 Perspectives
Additional laboratory experiments designed to explore other initial ice mixtures will help us to further constrain the early composition of TNOs, specifically, cliff-type TNOs. For example, the irradiation of pure CH3OH does not match the ratio of CO/CO2 observed in the cliff objects, but the laboratory match is improved with the addition of equal amounts of water. The presence of CO2 in the initial CH3OH mixture might also improve the laboratory to observational results. Incorporation of a nitrogen-bearing species to the initial ice to reproduce the observed OCN− absorption in some cliff objects might help us to investigate whether nitrogen chemistry impacts N(CO)/N(CO2) (Satorre et al. 2000). Irradiation of complex organics such as that of Faure et al. (2021) needs to be performed at low temperatures to track the likely formation and evolution of CO and CO2 from primordial complex organics that might contribute to the composition of cliff objects. To summarise, further work is necessary to fully assess the possible initial CH3OH mixtures that are compatible with the observed cliff surfaces, as they are thought to have formed beyond a CH3OH retention line, and possibly other retention lines, which likely increases the complexity of cliff surfaces (Pinilla-Alonso et al. 2024a). This is also expected to clarify how much of the CO2 that is detected on cliff surfaces results from irradiation and how much might be primordial.
Because CO/CO2 is seen to reach steady state with increasing irradiation (Fig. 2), this parameter can only provide a lower limit of the accumulated doses. To provide better constraints, additional indicators should be used, typically by following the parent molecule or other irradiation products with different formation and destruction cross-sections. Specifically for double-dip-type TNOs, investigation of the possible presence of CO3 might provide upper limits on the irradiation dose as it is more efficiently destroyed than CO (Raut & Baragiola 2013).
5 Conclusions
CO ice has been detected on at least 33 TNOs, even though their sizes and equilibrium temperatures suggest that CO as a pure ice is not thermodynamically stable on their surfaces. CO ice is detected on two distinct types of TNO surfaces: one type that is dominated by pure CO2, and the other type that is richer in CH3OH and other organic compounds mixed with CO2. To investigate the potential origins of the observed CO, we conducted ion irradiation experiments on CO2 and CH3OH ices. Our results indicate that CO is a secondary molecule that is produced by energetic processing of surface ices. This is supported by findings we list below.
-
Irradiation processes fully replicate the observed CO characteristics:
We found that CO is an irradiation product in the two TNO spectral types. The parent molecules differ, as shown by the relative abundances and chemical environments. CO likely forms by irradiation of CO2 ice at 45 K on CO2-rich surfaces. In objects that are rich in CH3OH and organics, CO is more likely formed by the irradiation of CH3OH ice.
-
Consistency with radiation environment simulations:
The irradiation doses required to produce the observed CO relative abundances agree with numerical simulations of energy deposition from the outer Solar System radiation environment. In TNOs that are rich in CO2, these doses may be sufficient to establish an equilibrium between CO and CO2.
-
Combined influence of chemical composition and temperature:
The temperature and the surrounding chemical matrix influence the CO abundance on the TNO surfaces. Above its sublimation temperature, the stability of CO is largely determined by the matrix in which it forms. CO is particularly well retained within CH3OH -rich TNO surfaces.
Acknowledgements
The authors thank P. Benoit-Lamaitrie, J. Bourçois and C. Bachelet for access to SIDONIE and O. Mivumbi and K. Guernon for technical support with INGMAR. INGMAR is a joint IAS-IJCLab facility funded by the P2IO LabEx (ANR-10-LABX-0038) in the framework Investissements d’Avenir (ANR-11-IDEX-0003-01). This work is based on observations made with the NASA/ESA/CSA James Webb Space Telescope. The data were obtained from the Mikulski Archive for Space Telescopes at the Space Telescope Science Institute, which is operated by the Association of Universities for Research in Astronomy, Inc., under NASA contract NAS 5-03127 for JWST. These observations are associated with program 2418. Support for program 2418 was provided by NASA through a grant from the Space Telescope Science Institute. E. H. and R. B. acknowledge support from the CNES-France (JWST mission). N. P.-A. acknowledges the Ministry of Science, Innovation, and Universities (MICIU) in Spain and the State Agency for Research (AEI) for funding through the ATRAE program, project ATR2023-145683. N. P. acknowledges funding by Fundação para a Ciência e a Tecnologia (FCT) through the research grants UIDB/04434/2020 and UIDP/04434/2020.
Appendix A Fitting examples of absorption bands on TNOs
We present in Fig. A.1 some examples of our fitting method on 2 objects. We show in the two top panels, the cliff object Lempo, particularly rich in OCN- . We overlay the Gaussian fit of the bands of interest as well as a polynomial or Gaussian fit of adjacent absorptions. We show in the two bottom panels, the double-dip object 2004 TY364. We overlay the Gaussian fit of the bands of interest as well as the local linear baselines. Both linear and non-linear corrections of adjacent absorptions were used on all objects, as well as varying wavelength cut-offs. Final band parameters are obtained by averaging the results of each fitting procedure. This allows to cancel-out variations induced by noise in the continuum and avoid biases in the choice of the baseline.
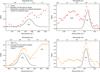 |
Fig. A.1 Examples of fitting method to extract band parameters of CO and CO2. Left panels depict the Gaussian fit of the ν1 + ν3 combination mode of CO2 on a cliff-type TNO (top) and a double-dip-type TNO (bottom). Right panels depict the Gaussian fit of the fundamental stretching mode of CO on a cliff-type TNO (top) and a double-dip-type TNO (bottom). |
We note that a second and weaker component to the CO absorption is seen in the laboratory for mixtures of CO in H2O ice at 4.65 µm (Palumbo & Strazzulla 1993). This feature, never observed in ISM ices, is due to different CO binding sites, specifically interactions with the dangling -OH bonds of porous H2O ice. This weak component is seen to disappear with irradiation (Seperuelo Duarte et al. 2021) or when mixed with additional compounds like NH3 (He et al. 2022). Thus we only consider the main 4.68 µm CO absorption in this analysis.
We also note that in the cases of a strong 2.7 µm CO2 band, the shape of the band becomes asymmetric and could be best reproduced by using 2 Gaussians. This asymmetry of the observed band here translates as a slight blueshift of the band centre, visible in Fig. 3, when compared to laboratory data where this CO2 band is typically weaker.
Appendix B Discarded objects
Based on visual inspection, De Prá et al. (2024) claimed a clear CO detection on 29 objects, which are divided into the 22 doubledips and 7 cliffs. De Prá et al. (2024) noted 9 TNOs to present dubious CO detections, which all fall into the cliff spectral type. Based on our CO band fitting procedure, we here confirm CO detection on 4 of those objects (1999 OX3, Borasisi, Sila-Numan and Mors), whose CO band parameters are relatively well constrained (see Table C.1). We choose to discard from the present analysis the remaining 5 objects : 2005 EF298 (Kágára), 2003 GH55, 2001 QD298, 2005 PU21 and Somnus. Their spectra, focusing on the 2300 cm−1 to 2000 region cm−1 , are presented in Fig. B.1.
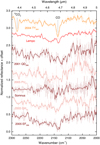 |
Fig. B.1 Spectra of the 5 objects discarded of the current CO analysis. Reflectance spectra were normalised at 2.6 µm and then sifted vertically for clarity (except 2005 EF198). Spectra of Lempo and 2004 TY364 are shown as a comparison, highlighting differences in noise, position and width of the 4.68 µm absorption. |
2001 QD298 , 2005 PU21 and Somnus are very noisy (Pinilla-Alonso et al. 2024a) and show a local maxima where the expected minimum of reflectance should be for the CO absorption. 2003 GH55 has a feature that is too broad and too blueshifted compared to the other objects to be attributed only to CO. Finally, 2005 EF298 has a feature of appropriate width and centre compared to the CO band of other objects. But the reflectance values are very low around this absorption thus the band area might be "saturated". On these 5 objects, further analysis and spectral modelling might be necessary to disentangle the CO absorption from the noise, adjacent absorption and possible non-linearity in region of very high absorption. Taking these 5 objects into account does not change our results but as we are unsure of the physical significance of their extracted CO parameters, they are discarded from this analysis. Among these 5 objects, 1 belong to the Scattering dynamical population, 1 to the 3:2 resonance and 3 to the Cold-Classical.
Appendix C Band and object parameters
Table C.1 presents the extracted CO and CO2 band parameters for double-dip and cliff objects. Average CO/CO2 band area ratio and N(CO)/N(CO2) values are obtained from averaging the values of individual objects and not a fit on the average spectra of each spectral type. Huya is taken into account into the mean of cliffs and 2004 PG115 is taken into account into the mean of the double-dip.
Table C.2 presents physical and dynamical properties of the objects studied here. Equilibrium temperatures were calculated using Eq. C.1 derived from equilibrating the flux received from the Sun (⊙) to the flux re-emitted by each TNO:
 (C.1)
(C.1)
Equilibrium temperatures are computed at 3 distances (D): perihelion (q), JWST observation and aphelion (Q). These estimate make use of the Bond albedo (a) which is obtained by multiplying the geometric albedo (pV) to the phase integral (q). pV are obtained from radiometric studies presented in Müller et al. (2020). q are calculated from Brucker et al. (2009) with q = 0.336 pV + 0.479. For the sample of TNOs studied here, Bond albedo values are between 0.02 and 0.19.
Band parameters double-dip and cliff objects with well characterised CO band.
Physical and dynamical properties of the double-dip and cliff objects with well characterised CO band.
Appendix D Irradiation experiments
We here present different details regarding the ion irradiation experiments conducted at IAS/IJCLab (Orsay, France). Ion current is monitored throughout the irradiation and is typically kept below 1 µA as to avoid macroscopic heating of the ice. We conducted both thin and thick ice irradiation experiments. Thin ices are ice deposits thinner than the penetration range of the impinging ions, here typically ~600 nm for CH3OH ices. This depth is determined using the SRIM code (Ziegler et al. 2010) using an assumption on the ice density (see below). In thin ice experiments, ions pass through the ice and deposit energy within it, following linear energy transfer. Thick ices are ice deposits thicker than the typical ion penetration range. The ions will thus implant into the ice and loose all their energy. To ensure that the thick ices are homogeneously irradiated in depth, we perform simultaneous ice deposition and irradiation. This technique is commonly used to produce irradiated ices thick enough for high signal-to-noise spectroscopy (e.g. Baratta et al. 1994) or for producing a substantial organic residue after warm-up of the ices (e.g. Vinogradoff et al. 2013). Thin film experiments receive an increasing accumulated dose while thick film experiments receive a single irradiation dose, as presented in Table D.1. Both experimental methods lead to similar results as observed in Fig. 2.
Experiments performed for this work, all with H+ 30 keV.
A CO2 gas bottle (purity > 99.99%) was purchased from Air Liquide. CH3OH and H2O were HPLC grade purchased from Aldrich. The water-methanol mixtures were prepared in the liquid phase which set the proportions of the gas phase. Dissolved gases were removed from the liquids by cycles of pumping.
The deposition rate ranged from 10 nm min−1 to 35 nm min−1, depending on the experiment, and was controlled by a Swagelok stainless-steel low-flow inlet valve far enough from the substrate to perform background deposition which favours the formation of porous and isotropic ices. Deposition rates are estimated using the interference pattern present in transmission spectra, arising from the interaction of the infrared light source crossing parallel layers. The thickness of the ice film is determined by measuring interference fringes while making an assumption on the refractive index of the ice (see below).
To compare experiments using different ions, ices and thicknesses, we use the irradiation dose expressed in eV/16u to quantify the energy deposited per template molecule of 16 atomic mass unit. To calculate the dose, one needs the fluence, the total amount of impinging ions per surface area, the total stopping power, calculated using the SRIM code (Ziegler et al. 2010), and an estimation of the density of the ice.
For the 45K CO2 ices, we used values of 1.30 for the refractive index (n) and 1.25 g cm−3 for density (ρ) from Domingo et al. (2021). For the pure CH3OH ices, we used the n = 1.27 and ρ = 0.66 g cm−3 from Luna et al. (2018). For the CH3OH mixtures with water ice, we assumed ρ = 0.8 g cm−3 and n was averaged between that of CH3OH from Luna et al. (2018) and H2O from Kofman et al. (2019).
Figure D.1 presents selected spectra of thin film irradiation experiments for pure CO2 and pure CH3OH at 45K. Dashed vertical lines mark the identification of irradiation products in both cases. All products, and their general behaviour with respect to irradiation dose, were expected from similar works for CO2 (Brucato et al. 1997; Raut & Baragiola 2013; Bennett et al. 2014) and for CH3OH (Baratta et al. 1994; Moore et al. 1996; Quirico et al. 2023). Our experiments are in very good qualitative and quantitative agreement with the literature which allow us to establish clear trends for the evolution of CO and CO2 in Fig. 2.
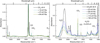 |
Fig. D.1 Spectra of ion irradiation experiments on initially pure ices of CO2 (left panel) and CH3OH (right panel). Both CO2 and CH3OH ices were irradiated at 45 K with 30 keV H+ during "thin film" experiments. The spectra of the initial ices are represented in black while the different irradiation steps are represented in shades of blue and green. The multiple bands present in the black initial spectra are all assigned to the unirradiated ice. Dashed grey lines assign molecules or bonds produced by irradiation to new absorptions. In the methanol experiments, the asterisk marks a band to which ethanol, acetone and ethylene glycol can contribute (Öberg et al. 2009b). Spectra from the CH3OH experiments are presented with a Gaussian smoothing (σ = 10) to improve readability when spectra overlap, but calculations for band area and centre were performed on the raw spectra. For readability purposes, not all irradiation steps are shown. |
Appendix E Band strengths
Table E.1 gathers the band strengths available in the literature for the fundamental stretching of CO at 4.68 µm and for the v1 + v3 CO2 band at 2.70 µm. Band strengths can vary with ice phase, temperature and mixing state. Ideally, we would use band strengths of appropriate temperature (~45K) and appropriate chemical environment (mostly apolar for double-dip, polar for cliff). But no clear behaviour emerges from comparing the different values found in the literature, probably due to differences in experimental setup. Thus, we use the same band strengths for the H2O and CH3OH dominated ices and for the CO2 dominated ices.
We use A = 1.1 × 10⁻¹⁷ cm molecule−1 for the band strength of CO from Jiang et al. (1975). This value is widely accepted to quantify the column density of CO in molecular clouds (e.g. McClure et al. 2023). The v1 + v3 CO2 band is less used for CO2 quantification and the literature values show more spread than for CO. We use A = 1.8 × 10⁻¹⁸ cm molecule−1 from Bouilloud et al. (2015), which is close to the average of the values presented in Table E.1 for pure CO2 ice.
The irradiated pure CH3OH ice at 45K was too thin to allow quantification through the v1 + v3 CO2 band, thus for including this experiment in Fig. 2, we use the fundamental CO2 band using a band strength of 1.1 × 10⁻¹⁶ cm molecule−1 from Gerakines et al. (1995), as done by McClure et al. (2023), although other estimates exist (e.g. Sandford & Allamandola 1990).
Band strengths of the bands of interest for the quantification of CO and CO2 on TNO surfaces and for the experiments performed for this work.
References
- Baratta, G. A., Castorina, A. C., Leto, G., et al. 1994, Planet. Space Sci., 42, 759 [NASA ADS] [CrossRef] [Google Scholar]
- Barucci, M. A., & Merlin, F. 2020, in The Trans-Neptunian Solar System, eds. D. Prialnik, M. A. Barucci, & L. Young (Elsevier), 109 [CrossRef] [Google Scholar]
- Bennett, C. J., Ennis, C. P., & Kaiser, R. I. 2014, ApJ, 794, 57 [NASA ADS] [CrossRef] [Google Scholar]
- Birch, S. P. D., & Umurhan, O. M. 2024, Icarus, 413, 116027 [NASA ADS] [CrossRef] [Google Scholar]
- Boogert, A. C. A., Gerakines, P. A., & Whittet, D. C. B. 2015, ARA&A, 53, 541 [Google Scholar]
- Bouilloud, M., Fray, N., Bénilan, Y., et al. 2015, MNRAS, 451, 2145 [Google Scholar]
- Brown, M. E., & Fraser, W. C. 2023, Planet. Sci. J., 4, 130 [CrossRef] [Google Scholar]
- Brown, M. E., Schaller, E. L., & Fraser, W. C. 2011, ApJ, 739, L60 [NASA ADS] [CrossRef] [Google Scholar]
- Brucato, J. R., Palumbo, M. E., & Strazzulla, G. 1997, Icarus, 125, 135 [NASA ADS] [CrossRef] [Google Scholar]
- Brucker, M. J., Grundy, W. M., Stansberry, J. A., et al. 2009, Icarus, 201, 284 [NASA ADS] [CrossRef] [Google Scholar]
- Brunetto, R., Barucci, M. A., Dotto, E., & Strazzulla, G. 2006, ApJ, 644, 646 [NASA ADS] [CrossRef] [Google Scholar]
- Brunetto, R., Hénault, E., Pinilla-Alonso, N., et al. 2025, ApJ, submitted [Google Scholar]
- Chauvin, N., Dayras, F., Le Du, D., & Meunier, R. 2004, Nucl. Instrum. Methods Phys. Res. A, 521, 149 [Google Scholar]
- Collings, M. P., Anderson, M. A., Chen, R., et al. 2004, MNRAS, 354, 1133 [NASA ADS] [CrossRef] [Google Scholar]
- Cooper, J. F., Christian, E. R., Richardson, J. D., & Wang, C. 2004, The First Decadal Review of the Edgeworth-Kuiper Belt, 92, 261 [CrossRef] [Google Scholar]
- Cruikshank, D. P., Roush, T. L., Owen, T. C., et al. 1993, Science, 261, 742 [NASA ADS] [CrossRef] [Google Scholar]
- Dalle Ore, C. M., Barucci, M. A., Emery, J. P., et al. 2015, Icarus, 252, 311 [NASA ADS] [CrossRef] [Google Scholar]
- Dartois, E., Chabot, M., da Costa, C. A. P., et al. 2023, A&A, 671, A156 [NASA ADS] [CrossRef] [EDP Sciences] [Google Scholar]
- Davidsson, B. J. R. 2021, MNRAS, 505, 5654 [NASA ADS] [CrossRef] [Google Scholar]
- De Prá, M. N., Hénault, E., Pinilla-Alonso, N., et al. 2024, Nat. Astron., https://doi.org/10.1038/s41550-024-02276-x [Google Scholar]
- Dohnálek, Z., Kimmel, G. A., Ayotte, P., Smith, R. S., & Kay, B. D. 2003, J. Chem. Phys., 118, 364 [CrossRef] [Google Scholar]
- Domingo, M., Luna, R., Satorre, M. Á., Santonja, C., & Millán, C. 2021, ApJ, 906, 81 [NASA ADS] [CrossRef] [Google Scholar]
- Emery, J. P., Wong, I., Brunetto, R., et al. 2024, Icarus, 414, 116017 [NASA ADS] [CrossRef] [Google Scholar]
- Faure, M., Quirico, E., Faure, A., et al. 2021, Icarus, 364, 114462 [Google Scholar]
- Ferrante, R. F., Moore, M. H., Spiliotis, M. M., & Hudson, R. L. 2008, ApJ, 684, 1210 [NASA ADS] [CrossRef] [Google Scholar]
- Fraser, W. C., Pike, R. E., Marsset, M., et al. 2023, Planet. Sci. J., 4, 80 [CrossRef] [Google Scholar]
- Gerakines, P. A., & Hudson, R. L. 2015, ApJ, 808, L40 [Google Scholar]
- Gerakines, P. A., Schutte, W. A., Greenberg, J. M., & van Dishoeck, E. F. 1995, A&A, 296, 810 [NASA ADS] [Google Scholar]
- Gkotsinas, A., Guilbert-Lepoutre, A., & Raymond, S. N. 2023, AJ, 165, 67 [NASA ADS] [CrossRef] [Google Scholar]
- Glein, C. R., Grundy, W. M., Lunine, J. I., et al. 2024, Icarus, 412, 115999 [CrossRef] [Google Scholar]
- González Díaz, C., Carrascosa, H., Muñoz Caro, G. M., Satorre, M. Á., & Chen, Y. J. 2022, MNRAS, 517, 5744 [CrossRef] [Google Scholar]
- Gordon, K. D., Bohlin, R., Sloan, G. C., et al. 2022, AJ, 163, 267 [NASA ADS] [CrossRef] [Google Scholar]
- Grundy, W. M., Tegler, S. C., Steckloff, J. K., et al. 2024a, Icarus, 410, 115767 [NASA ADS] [CrossRef] [Google Scholar]
- Grundy, W. M., Wong, I., Glein, C. R., et al. 2024b, Icarus, 411, 115923 [NASA ADS] [CrossRef] [Google Scholar]
- Harrington Pinto, O., Womack, M., Fernandez, Y., & Bauer, J. 2022, Planet. Sci. J., 3, 247 [NASA ADS] [CrossRef] [Google Scholar]
- He, J., Perotti, G., Emtiaz, S. M., et al. 2022, A&A, 668, A76 [NASA ADS] [CrossRef] [EDP Sciences] [Google Scholar]
- Hudgins, D. M., Sandford, S. A., Allamandola, L. J., & Tielens, A. G. G. M. 1993, ApJS, 86, 713 [NASA ADS] [CrossRef] [Google Scholar]
- Hudson, R. L., Palumbo, M. E., Strazzulla, G., et al. 2008, in The Solar System Beyond Neptune, eds. M. A. Barucci, H. Boehnhardt, D. P. Cruikshank, A. Morbidelli, & R. Dotson, 507 [Google Scholar]
- Jiang, G. J., Person, W. B., & Brown, K. G. 1975, J. Chem. Phys., 62, 1201 [NASA ADS] [CrossRef] [Google Scholar]
- Kofman, V., He, J., Loes ten Kate, I., & Linnartz, H. 2019, ApJ, 875, 131 [NASA ADS] [CrossRef] [Google Scholar]
- Kral, Q., Pringle, J. E., Guilbert-Lepoutre, A., et al. 2021, A&A, 653, L11 [NASA ADS] [CrossRef] [EDP Sciences] [Google Scholar]
- Licandro, J., Pinilla-Alonso, N., Holler, B. J., et al. 2024, Nat. Astron., https://doi.org/10.1038/s41550-024-02417-2 [Google Scholar]
- Lisse, C. M., Young, L. A., Cruikshank, D. P., et al. 2021, Icarus, 356, 114072 [CrossRef] [Google Scholar]
- Loeffler, M. J., Tribbett, P. D., Cooper, J. F., & Sturner, S. J. 2020, Icarus, 351, 113943 [CrossRef] [Google Scholar]
- Luna, R., Molpeceres, G., Ortigoso, J., et al. 2018, A&A, 617, A116 [NASA ADS] [CrossRef] [EDP Sciences] [Google Scholar]
- Malamud, U., Landeck, W. A., Bischoff, D., et al. 2022, MNRAS, 514, 3366 [NASA ADS] [CrossRef] [Google Scholar]
- Martín-Doménech, R., Manzano-Santamaría, J., Muñoz Caro, G. M., et al. 2015, A&A, 584, A14 [NASA ADS] [CrossRef] [EDP Sciences] [Google Scholar]
- Maté, B., Jimenez-Redondo, M., Peláez, R. J., Tanarro, I., & Herrero, V. J. 2019, MNRAS, 490, 2936 [CrossRef] [Google Scholar]
- McClure, M. K., Rocha, W. R. M., Pontoppidan, K. M., et al. 2023, Nat. Astron., 7, 431 [NASA ADS] [CrossRef] [Google Scholar]
- Moore, M. H., Ferrante, R. F., & Nuth, J. A., I. 1996, Planet. Space Sci., 44, 927 [NASA ADS] [CrossRef] [Google Scholar]
- Morbidelli, A., & Nesvorný, D. 2020, in The Trans-Neptunian Solar System, eds. D. Prialnik, M. A. Barucci, & L. Young, 25 [CrossRef] [Google Scholar]
- Müller, T., Lellouch, E., & Fornasier, S. 2020, in The Trans-Neptunian Solar System, eds. D. Prialnik, M. A. Barucci, & L. Young (Elsevier), 153 [CrossRef] [Google Scholar]
- Öberg, K. I., Fayolle, E. C., Cuppen, H. M., van Dishoeck, E. F., & Linnartz, H. 2009a, A&A, 505, 183 [NASA ADS] [CrossRef] [EDP Sciences] [Google Scholar]
- Öberg, K. I., Garrod, R. T., van Dishoeck, E. F., & Linnartz, H. 2009b, A&A, 504, 891 [NASA ADS] [CrossRef] [EDP Sciences] [Google Scholar]
- Owen, T. C., Roush, T. L., Cruikshank, D. P., et al. 1993, Science, 261, 745 [NASA ADS] [CrossRef] [Google Scholar]
- Palumbo, M. E., & Strazzulla, G. 1993, A&A, 269, 568 [NASA ADS] [Google Scholar]
- Parhi, A., & Prialnik, D. 2023, MNRAS, 522, 2081 [NASA ADS] [CrossRef] [Google Scholar]
- Peixinho, N., Delsanti, A., Guilbert-Lepoutre, A., Gafeira, R., & Lacerda, P. 2012, A&A, 546, A86 [NASA ADS] [CrossRef] [EDP Sciences] [Google Scholar]
- Pilling, S., Andrade, D. P. P., da Silveira, E. F., et al. 2012, MNRAS, 423, 2209 [NASA ADS] [CrossRef] [Google Scholar]
- Pilling, S., Rocha, W. R. M., Carvalho, G. A., & de Abreu, H. A. 2023, Adv. Space Res., 71, 5466 [NASA ADS] [CrossRef] [Google Scholar]
- Pinilla-Alonso, N., Brunetto, R., De Prá, M. N., et al. 2024a, Nat. Astron., https://doi.org/10.1038/s41550-024-02433-2 [Google Scholar]
- Pinilla-Alonso, N., Licandro, J., Brunetto, R., et al. 2024b, A&A, 692, L11 [NASA ADS] [CrossRef] [EDP Sciences] [Google Scholar]
- Quirico, E., & Schmitt, B. 2004, Near-IR optical constants of crystalline CO2 ice at 179 K completed with 28K data. SSHADE/GhoSST (OSUG Data Center), https://doi.org/10.26302/SSHADE/EXPERIMENT_BS_20130215_001 [Google Scholar]
- Quirico, E., Douté, S., Schmitt, B., et al. 1999, Icarus, 139, 159 [NASA ADS] [CrossRef] [Google Scholar]
- Quirico, E., Bacmann, A., Wolters, C., et al. 2023, Icarus, 394, 115396 [NASA ADS] [CrossRef] [Google Scholar]
- Raut, U., & Baragiola, R. A. 2013, ApJ, 772, 53 [Google Scholar]
- Rocha, W. R. M., Rachid, M. G., Olsthoorn, B., et al. 2022, A&A, 668, A63 [NASA ADS] [CrossRef] [EDP Sciences] [Google Scholar]
- Rocha, W. R. M., Woitke, P., Pilling, S., et al. 2023, A&A, 673, A70 [NASA ADS] [CrossRef] [EDP Sciences] [Google Scholar]
- Rothard, H., Domaracka, A., Boduch, P., et al. 2017, J. Phys. B Atom. Mol. Phys., 50, 062001 [NASA ADS] [CrossRef] [Google Scholar]
- Sandford, S. A., & Allamandola, L. J. 1990, ApJ, 355, 357 [NASA ADS] [CrossRef] [Google Scholar]
- Sandford, S. A., Allamandola, L. J., Tielens, A. G. G. M., & Valero, G. J. 1988, ApJ, 329, 498 [NASA ADS] [CrossRef] [Google Scholar]
- Satorre, M. A., Palumbo, M. E., & Strazzulla, G. 2000, Ap&SS, 274, 643 [NASA ADS] [CrossRef] [Google Scholar]
- Schaller, E. L., & Brown, M. E. 2007, ApJ, 659, L61 [CrossRef] [Google Scholar]
- Seperuelo Duarte, E., de Barros, A. L. F., da Silveira, E. F., et al. 2021, MNRAS, 508, 4297 [NASA ADS] [CrossRef] [Google Scholar]
- Simon, A., Öberg, K. I., Rajappan, M., & Maksiutenko, P. 2019, ApJ, 883, 21 [NASA ADS] [CrossRef] [Google Scholar]
- Souza-Feliciano, A. C., Holler, B. J., Pinilla-Alonso, N., et al. 2024, A&A, 681, L17 [NASA ADS] [CrossRef] [EDP Sciences] [Google Scholar]
- Spencer, J. R., Stern, S. A., Moore, J. M., et al. 2020, Science, 367, aay3999 [NASA ADS] [CrossRef] [Google Scholar]
- Steckloff, J. K., Lisse, C. M., Safrit, T. K., et al. 2021, Icarus, 356, 113998 [NASA ADS] [CrossRef] [Google Scholar]
- Stone, E. C., Cummings, A. C., Heikkila, B. C., & Lal, N. 2019, Nat. Astron., 3, 1013 [NASA ADS] [CrossRef] [Google Scholar]
- Sturm, J. A., McClure, M. K., Beck, T. L., et al. 2023, A&A, 679, A138 [NASA ADS] [CrossRef] [EDP Sciences] [Google Scholar]
- Tegler, S. C., & Romanishin, W. 2003, Icarus, 161, 181 [NASA ADS] [CrossRef] [Google Scholar]
- Urso, R. G., Vuitton, V., Danger, G., et al. 2020, A&A, 644, A115 [NASA ADS] [CrossRef] [EDP Sciences] [Google Scholar]
- Vinogradoff, V., Fray, N., Duvernay, F., et al. 2013, A&A, 551, A128 [NASA ADS] [CrossRef] [EDP Sciences] [Google Scholar]
- Volk, K., & Van Laerhoven, C. 2024, RNAAS, 8, 36 [NASA ADS] [Google Scholar]
- Wong, I., Brown, M. E., Emery, J. P., et al. 2024, Planet. Sci. J., 5, 87 [CrossRef] [Google Scholar]
- Zhang, C., Zhu, C., Turner, A. M., et al. 2023, Sci. Adv., 9, eadg6936 [NASA ADS] [CrossRef] [Google Scholar]
- Zhang, C., Leyva, V., Wang, J., et al. 2024, PNAS, 121, e2320215121 [CrossRef] [Google Scholar]
- Zhu, C., Turner, A. M., Meinert, C., & Kaiser, R. I. 2020, ApJ, 889, 134 [NASA ADS] [CrossRef] [Google Scholar]
- Ziegler, J. F., Ziegler, M. D., & Biersack, J. P. 2010, Nucl. Instrum. Methods Phys. Res. B, 268, 1818 [Google Scholar]
All Tables
Physical and dynamical properties of the double-dip and cliff objects with well characterised CO band.
Band strengths of the bands of interest for the quantification of CO and CO2 on TNO surfaces and for the experiments performed for this work.
All Figures
|
Fig. 1 Spectra of the sample of objects studied here. Spectra are normalised to unity at 2.6 µm. Objects are coloured and overlap according to their spectral types. Double-dip objects are shown at the top in orange and cliff objects are at the bottom in red. The thick lines represent the average of each group. Huya and 2004 PG115 are presented in the middle in grey to highlight their mixed spectral characteristics. Except for the cliff group, the spectra are offset vertically for clarity. The most characteristic bands of CO2, CO, and CH3OH are marked with vertical lines. The variability of CH3OH bands within the cliff group was studied by Brunetto et al. (2025). |
| In the text | |
|
Fig. 2 Evolution of N(CO)/N(CO2) as a function of irradiation dose for CO2 ices (left panel) and CH3OH ices (right panel). Experimental points are colour-coded so that blue points represent the colder irradiated ices, and red points represent the warmer ices. The data that are connected by a dashed line correspond to thin experiments that received increasing doses, and the others are thick experiments that received a single dose. The errors from experimental data are within the symbol size. The average N(CO)/N(CO2) value for the double-dip objects is presented for comparison alongside the CO2 experiments, and the average value for cliff objects is presented alongside the CH3OH experiments. The shaded rectangles correspond to the standard deviation around this average. We cannot present the CO/CO2 band area ratio because most previous studies focused on the ν3 fundamental CO2 band area and not on the area of its ν1 + ν3 combination mode band. |
| In the text | |
|
Fig. 3 N(CO)/N(CO2) as a function of the position of the centre of the 2.70 µm CO2 band for individual double-dip objects (orange crosses) and cliff objects (red squares). The shadowed regions in the graph represent the range of points we obtained during CO2 irradiation experiments at 45 K (orange) and CH3OH irradiation experiments, pure and mixed with H2O, at 45–60 K (light red). The horizontal dashed red line represents a lower limit for cliff object 1999 OX3 , which lacks the 2.7 µm CO2 band. Huya (grey cross) is clustered as a double-dip, but behaves like a cliff in terms of CO and CO2. Conversely, 2004 PG115 (grey square) is clustered as a cliff, but behaves like a double-dip in terms of CO and CO2. |
| In the text | |
|
Fig. 4 Evolution of the band area of CO (top panels) and of N(CO)/N(CO2) (bottom panels) as a function of diameter, equilibrium temperature, and aphelion. Objects are colour-coded according to their spectral types. double-dip-type TNOs are plotted as orange crosses, cliff-type TNOs as red squares, and the two hybrid objects, Huya and 2004 PG115, in grey. The uncertainties for the CO band area and N(CO)/N(CO2) come from fitting the NIRSpec data as described in Appendix A. The diameter uncertainties come from radiometric studies. The temperature points represent the equilibrium temperature at the heliocentric distance at the time of the JWST observation. The horizontal lines represent the equilibrium temperature that is reached at aphelion and perihelion. The aphelion uncertainties are well below the symbol size. All physical and dynamical parameters are given in Table C.2 |
| In the text | |
|
Fig. A.1 Examples of fitting method to extract band parameters of CO and CO2. Left panels depict the Gaussian fit of the ν1 + ν3 combination mode of CO2 on a cliff-type TNO (top) and a double-dip-type TNO (bottom). Right panels depict the Gaussian fit of the fundamental stretching mode of CO on a cliff-type TNO (top) and a double-dip-type TNO (bottom). |
| In the text | |
|
Fig. B.1 Spectra of the 5 objects discarded of the current CO analysis. Reflectance spectra were normalised at 2.6 µm and then sifted vertically for clarity (except 2005 EF198). Spectra of Lempo and 2004 TY364 are shown as a comparison, highlighting differences in noise, position and width of the 4.68 µm absorption. |
| In the text | |
|
Fig. D.1 Spectra of ion irradiation experiments on initially pure ices of CO2 (left panel) and CH3OH (right panel). Both CO2 and CH3OH ices were irradiated at 45 K with 30 keV H+ during "thin film" experiments. The spectra of the initial ices are represented in black while the different irradiation steps are represented in shades of blue and green. The multiple bands present in the black initial spectra are all assigned to the unirradiated ice. Dashed grey lines assign molecules or bonds produced by irradiation to new absorptions. In the methanol experiments, the asterisk marks a band to which ethanol, acetone and ethylene glycol can contribute (Öberg et al. 2009b). Spectra from the CH3OH experiments are presented with a Gaussian smoothing (σ = 10) to improve readability when spectra overlap, but calculations for band area and centre were performed on the raw spectra. For readability purposes, not all irradiation steps are shown. |
| In the text | |
Current usage metrics show cumulative count of Article Views (full-text article views including HTML views, PDF and ePub downloads, according to the available data) and Abstracts Views on Vision4Press platform.
Data correspond to usage on the plateform after 2015. The current usage metrics is available 48-96 hours after online publication and is updated daily on week days.
Initial download of the metrics may take a while.