Fig. 1
Download original image
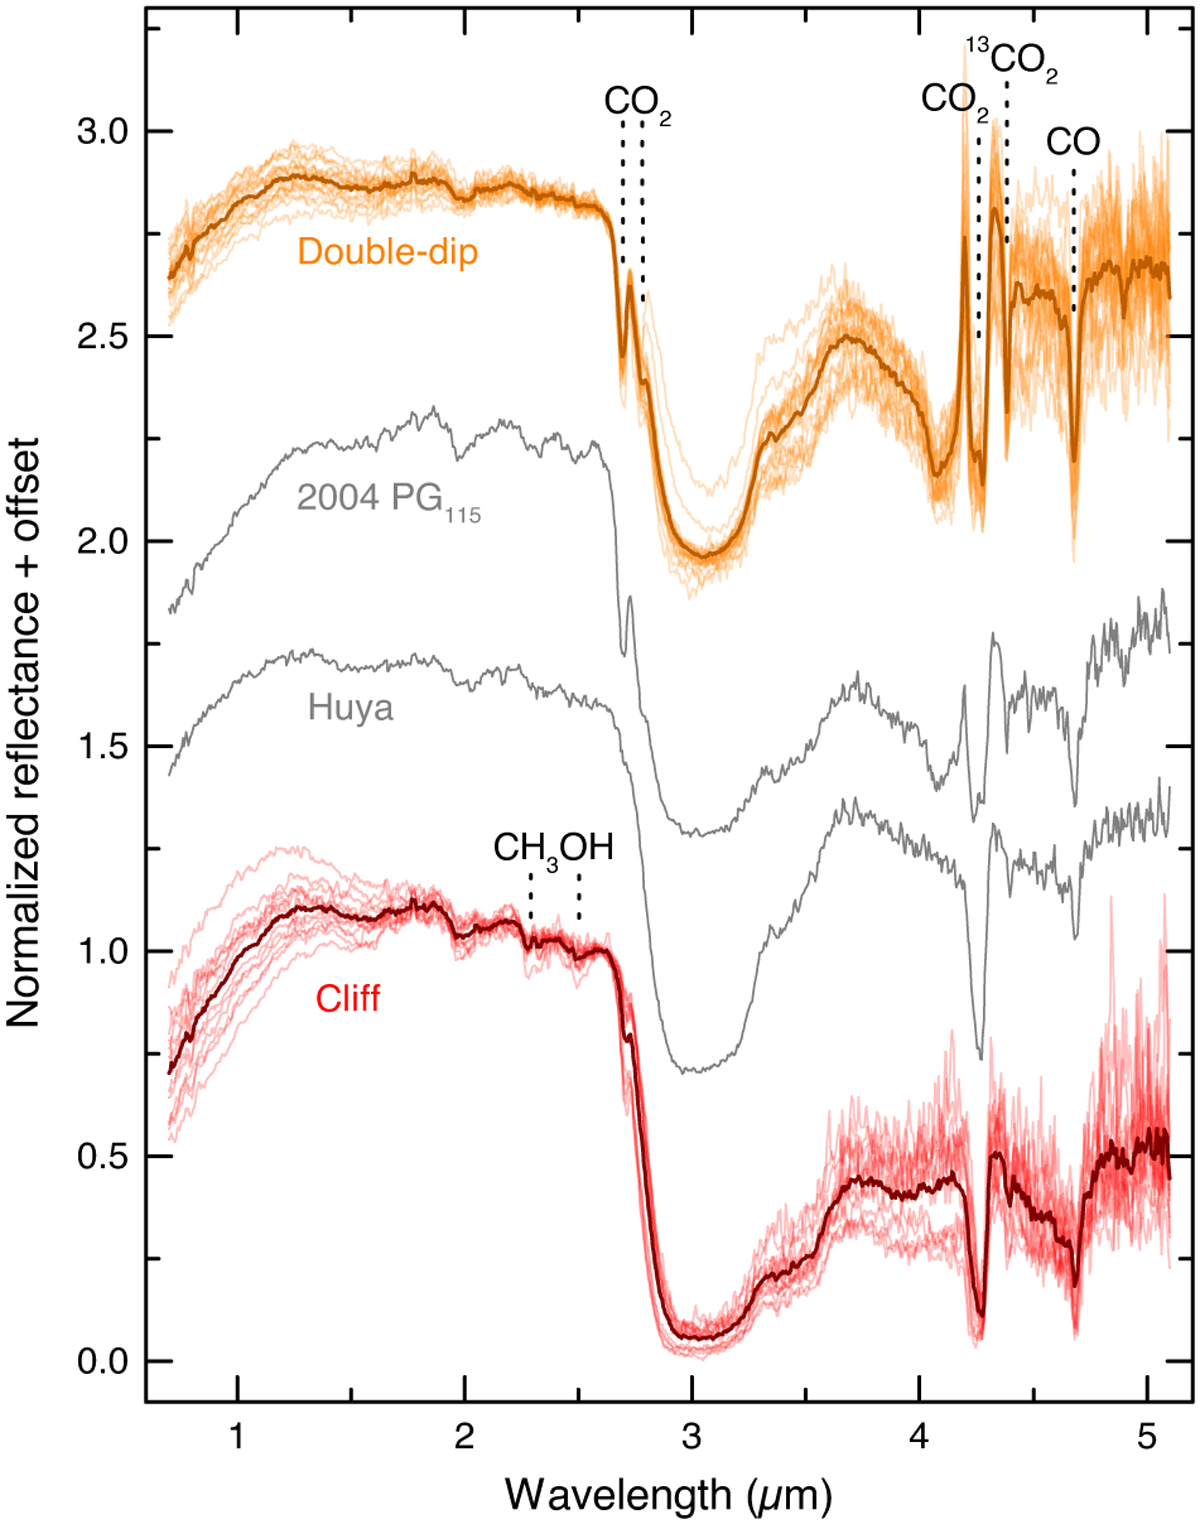
Spectra of the sample of objects studied here. Spectra are normalised to unity at 2.6 µm. Objects are coloured and overlap according to their spectral types. Double-dip objects are shown at the top in orange and cliff objects are at the bottom in red. The thick lines represent the average of each group. Huya and 2004 PG115 are presented in the middle in grey to highlight their mixed spectral characteristics. Except for the cliff group, the spectra are offset vertically for clarity. The most characteristic bands of CO2, CO, and CH3OH are marked with vertical lines. The variability of CH3OH bands within the cliff group was studied by Brunetto et al. (2025).
Current usage metrics show cumulative count of Article Views (full-text article views including HTML views, PDF and ePub downloads, according to the available data) and Abstracts Views on Vision4Press platform.
Data correspond to usage on the plateform after 2015. The current usage metrics is available 48-96 hours after online publication and is updated daily on week days.
Initial download of the metrics may take a while.