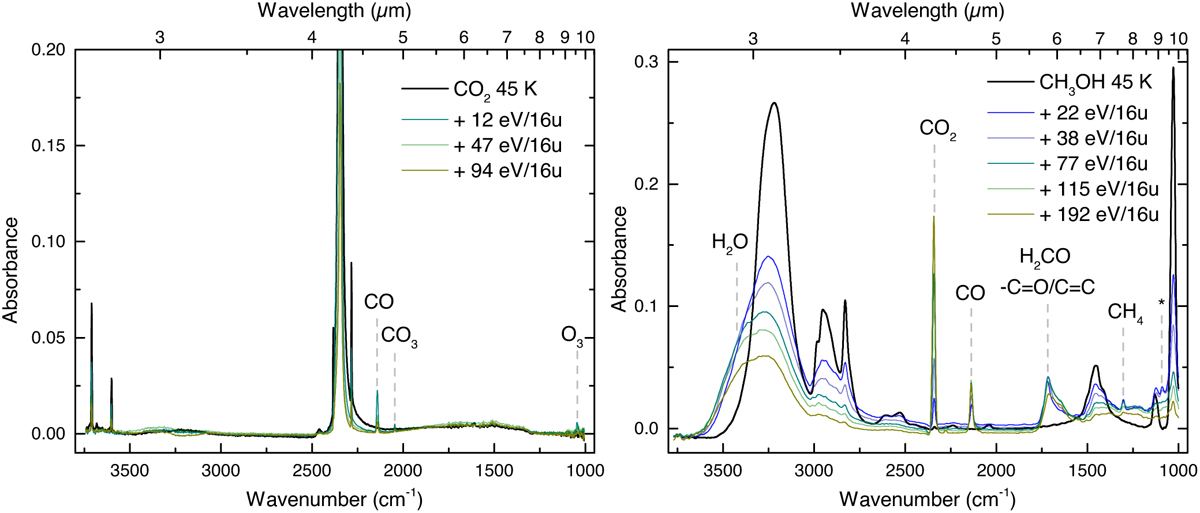
Fig. D.1

Download original image
Spectra of ion irradiation experiments on initially pure ices of CO2 (left panel) and CH3OH (right panel). Both CO2 and CH3OH ices were irradiated at 45 K with 30 keV H+ during "thin film" experiments. The spectra of the initial ices are represented in black while the different irradiation steps are represented in shades of blue and green. The multiple bands present in the black initial spectra are all assigned to the unirradiated ice. Dashed grey lines assign molecules or bonds produced by irradiation to new absorptions. In the methanol experiments, the asterisk marks a band to which ethanol, acetone and ethylene glycol can contribute (Öberg et al. 2009b). Spectra from the CH3OH experiments are presented with a Gaussian smoothing (σ = 10) to improve readability when spectra overlap, but calculations for band area and centre were performed on the raw spectra. For readability purposes, not all irradiation steps are shown.
Current usage metrics show cumulative count of Article Views (full-text article views including HTML views, PDF and ePub downloads, according to the available data) and Abstracts Views on Vision4Press platform.
Data correspond to usage on the plateform after 2015. The current usage metrics is available 48-96 hours after online publication and is updated daily on week days.
Initial download of the metrics may take a while.


