Fig. 4
Download original image
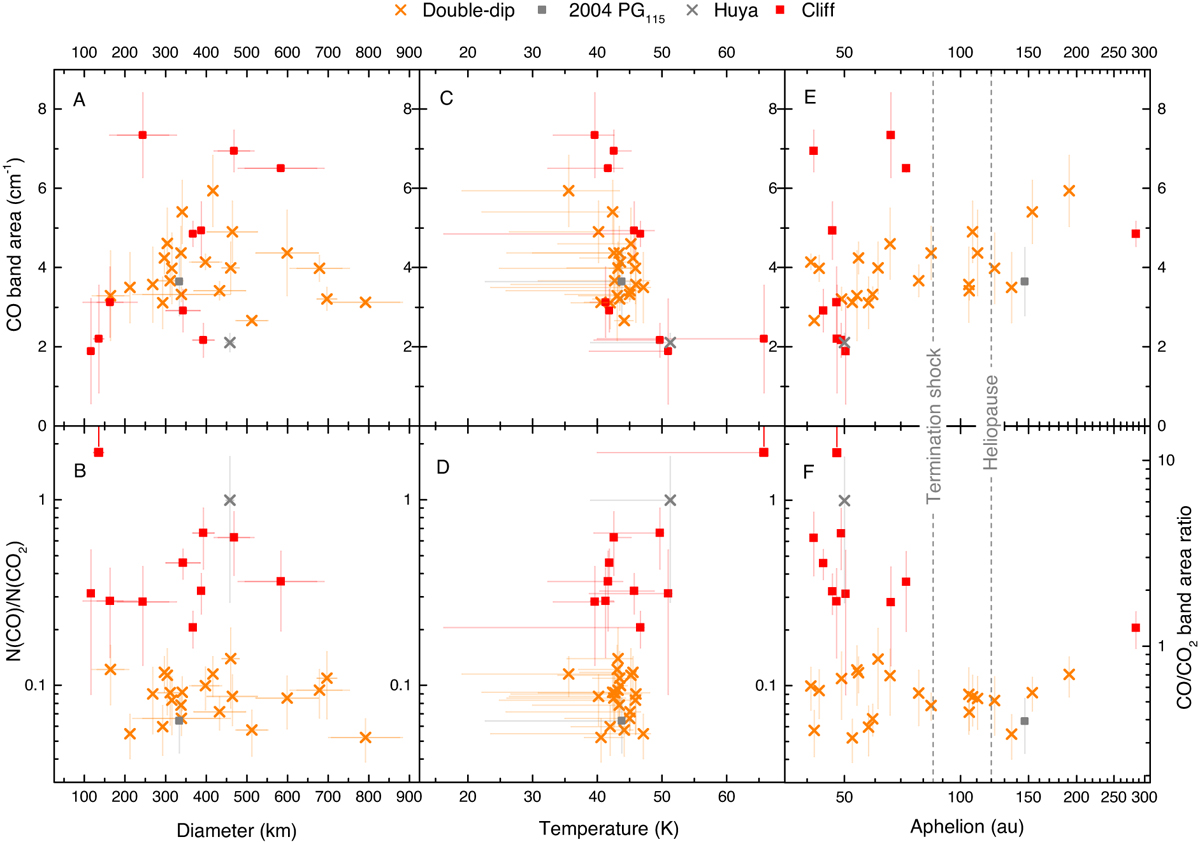
Evolution of the band area of CO (top panels) and of N(CO)/N(CO2) (bottom panels) as a function of diameter, equilibrium temperature, and aphelion. Objects are colour-coded according to their spectral types. double-dip-type TNOs are plotted as orange crosses, cliff-type TNOs as red squares, and the two hybrid objects, Huya and 2004 PG115, in grey. The uncertainties for the CO band area and N(CO)/N(CO2) come from fitting the NIRSpec data as described in Appendix A. The diameter uncertainties come from radiometric studies. The temperature points represent the equilibrium temperature at the heliocentric distance at the time of the JWST observation. The horizontal lines represent the equilibrium temperature that is reached at aphelion and perihelion. The aphelion uncertainties are well below the symbol size. All physical and dynamical parameters are given in Table C.2
Current usage metrics show cumulative count of Article Views (full-text article views including HTML views, PDF and ePub downloads, according to the available data) and Abstracts Views on Vision4Press platform.
Data correspond to usage on the plateform after 2015. The current usage metrics is available 48-96 hours after online publication and is updated daily on week days.
Initial download of the metrics may take a while.