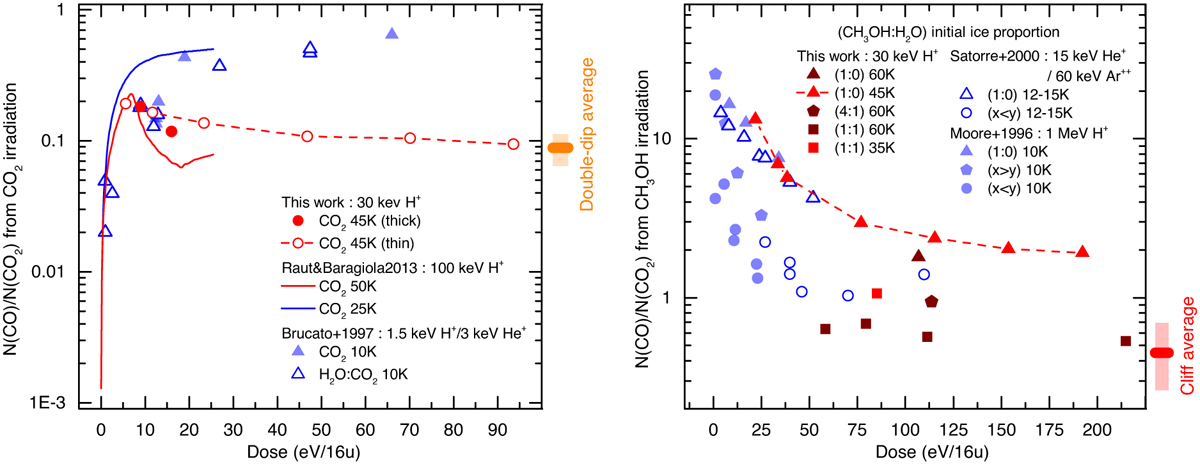
Fig. 2
Download original image
Evolution of N(CO)/N(CO2) as a function of irradiation dose for CO2 ices (left panel) and CH3OH ices (right panel). Experimental points are colour-coded so that blue points represent the colder irradiated ices, and red points represent the warmer ices. The data that are connected by a dashed line correspond to thin experiments that received increasing doses, and the others are thick experiments that received a single dose. The errors from experimental data are within the symbol size. The average N(CO)/N(CO2) value for the double-dip objects is presented for comparison alongside the CO2 experiments, and the average value for cliff objects is presented alongside the CH3OH experiments. The shaded rectangles correspond to the standard deviation around this average. We cannot present the CO/CO2 band area ratio because most previous studies focused on the ν3 fundamental CO2 band area and not on the area of its ν1 + ν3 combination mode band.
Current usage metrics show cumulative count of Article Views (full-text article views including HTML views, PDF and ePub downloads, according to the available data) and Abstracts Views on Vision4Press platform.
Data correspond to usage on the plateform after 2015. The current usage metrics is available 48-96 hours after online publication and is updated daily on week days.
Initial download of the metrics may take a while.