| Issue |
A&A
Volume 699, July 2025
|
|
|---|---|---|
| Article Number | A167 | |
| Number of page(s) | 12 | |
| Section | Planets, planetary systems, and small bodies | |
| DOI | https://doi.org/10.1051/0004-6361/202555084 | |
| Published online | 08 July 2025 | |
JWST mid-infrared spectroscopy of centaurs and small trans-Neptunian objects: Linking the inner and outer Solar System
1
Aix-Marseille University, CNRS, CNES, LAM, Institut Origines,
38 rue Frédéric Joliot Curie,
13388
Marseille,
France
2
Florida Space Institute, University of Central Florida,
12354 Research Parkway, Partnership 1 building,
Orlando,
FL,
32828,
USA
3
Univ. Grenoble Alpes, CNRS, IPAG,
Grenoble,
France
4
Department of Earth, Atmospheric and Planetary Sciences, MIT,
77 Massachusetts Avenue,
Cambridge,
MA
02139,
USA
5
European Southern Observatory (ESO),
Alonso de Cordova 3107, 1900 Casilla Vitacura,
Santiago,
Chile
6
Institute of Space Science and technology of Asturias, University of Oviedo,
Oviedo,
Spain
7
University of Central Florida, Department of Physics,
Orlando,
FL
32816,
USA
8
Instituto de Astrofísica de Canarias (IAC), La Laguna, Spain; Departamento de Astrofísica, Universidad de La Laguna,
La Laguna,
Spain
9
Space Telescope Science Institute,
3700 San Martin Drive,
Baltimore,
MD
21218,
USA
★ Corresponding author.
Received:
8
April
2025
Accepted:
28
May
2025
Abstract
Context. A fraction of the small bodies that formed in the outer Solar System (beyond Uranus and Neptune) are predicted to have been implanted in the inner Solar System (P- and D-type asteroids and Jupiter trojans) following the outward migration of these two planets (Nice model).
Aims. We further test the hypothesis that small bodies in the inner and outer Solar Systems share a common origin. This is achieved by measuring and comparing the silicate composition of centaurs and small trans-Neptunian objects (TNOs) with that of P- and D-type asteroids and Jupiter trojans. Silicates are thermally stable over the heliocentric range extending from the main asteroid belt to the Kuiper belt. They currently appear to be the only reliable indicator of a shared genetic link.
Methods. Spectroscopic data were obtained with JWST/MIRI for three centaurs (Chariklo, Bienor, and 2020 VF1) and three scattered-disk objects (1999 OX3, 2002 GG166, and 2013 LU28) with a centaur-like orbit as part of the Cycle 2 GO program (GO 2820). We also analyzed the MIRI data of GTO target 2013XZ8, which is also a centaur (Cycle 1 GTO 1272), and of three Jupiter trojans (targets of the Cycle 1 GO 2574 program).
Results. The emissivity spectra of centaurs and small TNOs, including the variability in the spectral contrast of the main 10 μm silicate feature, are remarkably similar to those of Jupiter trojans, P- and D-type main-belt asteroids, and comets. In particular, the spectral contrast observed for the cliff-type target 1999 OX3 is close to that observed for comet comae, suggesting substantial surface porosity that is probably related to a lower silicate-to-ices+organics ratio. The analysis of the emissivity spectra of centaurs, small TNOs, and Jupiter trojans revealed very many features that are consistent with the hypothesis that the surfaces of these objects contain significant amounts of crystalline olivine and pyroxene (with Mg/(Mg+Fe) ≥ 0.7).
Conclusions. The JWST/MIRI observations of centaurs and small TNOs support the hypothesis that these bodies share a common origin with inner Solar System P- and D-type asteroids and Jupiter trojans, as outlined in the Nice model. Together with previous measurements for these populations and dynamical studies, our results raise the possibility of a genetic link between P-type and bowl-type targets and between D-type and cliff-type targets.
Key words: methods: data analysis / methods: observational / techniques: spectroscopic / Kuiper belt: general / minor planets, asteroids: general
© The Authors 2025
 Open Access article, published by EDP Sciences, under the terms of the Creative Commons Attribution License (https://creativecommons.org/licenses/by/4.0), which permits unrestricted use, distribution, and reproduction in any medium, provided the original work is properly cited.
This article is published in open access under the Subscribe to Open model. This email address is being protected from spambots. You need JavaScript enabled to view it. to support open access publication.
1 Introduction
A key step to deciphering the dynamical past, and more generally, the dynamical evolution of the Solar System as a whole is to unravel the compositional distribution of its small bodies. Estimates of this distribution (Gradie & Tedesco 1982) that were regularly updated over time (e.g., DeMeo & Carry 2013, 2014; Vernazza & Beck 2017; Vernazza et al. 2022b and references therein) have opened the door to new models of the formation and evolution of the Solar System (e.g., Tsiganis et al. 2005; Morbidelli et al. 2005; Levison et al. 2009; Morbidelli et al. 2010; Walsh et al. 2011; Nesvorný 2015; Vokrouhlický et al. 2016; Raymond & Izidoro 2017a; Raymond & Izidoro 2017b; Nesvorný 2018; Raymond & Nesvorný 2022; Lykawka & Ito 2023), notably the so-called Nice model (Tsiganis et al. 2005; Morbidelli et al. 2005; Levison et al. 2009).
The most recent version of this model (Nesvorný 2018; Morbidelli & Nesvorný 2020) invokes an outward migration of Uranus and Neptune during the first 100 My of the Solar System history. It implies that the P- and D-type main-belt asteroids (MBAs) and the trojans of Jupiter formed in more distant regions, among the primordial trans-Neptunian disk, which is also the precursor of the Kuiper belt (≥10 AU). According to this model, they are genetically related to the small bodies in the outer Solar System, such as centaurs, short-period comets, the trojans of Neptune, the irregular satellites of all giant planets, small (D≤300 km) TNOs, and possibly, Oort cloud comets (Brasser 2008; Brasser & Morbidelli 2013; Morbidelli & Nesvorný 2020).
This dynamical scenario is currently supported by the similarity in the size distributions between the Jupiter trojans and small TNOs (Fraser et al. 2014) and by the similarity of the spectral properties of P- and D-type MBAs, Jupiter trojans, and comets (e.g., Vernazza et al. 2015; Vernazza & Beck 2017). Direct evidence of a genetic link between the original source population (TNOs) and the currently dynamically isolated and dispersed populations (P- and D-type MBAs and Jupiter trojans) is currently lacking, however. Near-infrared spectroscopic observations of P- and D-type MBAs, Jupiter trojans, centaurs, and TNOs have shown that volatiles are important surface constituents of most centaurs and TNOs (Pinilla-Alonso et al. 2024, 2025; Licandro et al. 2025; De Prá et al. 2025; Brunetto et al. 2025), but are much less abundant on the devolatilized surfaces of P- and D-type MBAs and Jupiter trojans (Usui et al. 2019; Wong et al. 2024). Some centaurs have a peculiar surface type, called the shallow type (Wong et al. 2024; Licandro et al. 2025), which is poorest in volatiles and spectroscopically more similar to the dusty surface of Jupiter trojans than to the ice-rich TNOs or centaurs.
Variations in volatile compounds in the 0.4–4 μm range do not provide sufficient compositional constraints to establish a direct link between these populations, however, which are located at very different heliocentric distances. Silicates, which are thermally stable over the heliocentric range that extends from the main asteroid belt to the Kuiper belt, thus appear to be the only robust evidence (tracer) for investigating a primordial common genetic link. The similar silicate emission features in the mid-infrared spectra of P- and D-type MBAs, Jupiter trojans, and comets previously succeeded in establishing a likely common origin for these bodies (e.g., Emery et al. 2006; Vernazza et al. 2015). Mid-infrared spectroscopy of centaurs and small TNOs is therefore the missing piece for establishing a definitive link between inner (P- and D-type MBAs and Jupiter trojans) and outer (centaurs and TNOs) Solar System small body populations as predicted by the Nice model.
We report evidence for a spectral similarity between centaurs, small TNOs, and inner Solar System P- and D-type asteroids and Jupiter trojans based on observations made with the Mid-Infrared Instrument (MIRI) aboard the James Webb Space Telescope (JWST), supporting a common origin for these populations. The observational setup and data reduction are described in Sect. 2, the physical and thermal properties of our targets are presented in Sect. 3, the spectral analysis is presented in Sect. 4, our findings are discussed in Sect. 5, and our conclusions are presented in Sect. 6.
Observational circumstances.
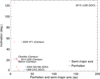 |
Fig. 1 Orbital properties of our targets. The perihelion distance and the semimajor axis are given as a function of inclination. The dynamical class (centaur vs. SDO) is also highlighted next to each target name (see Appendix A.1 for discussion). |
2 Target selection, observations, and data reduction
Spectroscopic data were obtained with JWST/MIRI for three centaurs (Chariklo, Bienor, and 2020 VF1) and three scattered-disk objects (SDOs) (1999 OX3, 2002 GG166, and 2013 LU28) with a centaur-like orbit as part of the Cycle 2 GO program (GO 2820; Vernazza et al. 2023) (see Table 1, Fig. 1 and Appendix A.1 for the discussion of the dynamical class). We also analyzed the MIRI data of GTO target 2013XZ8, which is a centaur (Cycle 1 GTO 1272; Hines et al. 2017). In our target selection, we aimed to observe an even number of less red and red objects because the distribution of the spectral slope in the visible of centaurs and D≤700 km TNOs is strongly bimodal (e.g., Peixinho et al. 2012; Fraser & Brown 2012; Tegler et al. 2016; Wong & Brown 2017; Marsset et al. 2019), which suggests at least two main compositional groups. A survey of centaurs and small TNOs with JWST/NIRSpec (Pinilla-Alonso et al. 2025) revealed three compositional groups with a direct correspondence between spectral slope in the visible and the composition (less red: bowl type; intermediate red: double-dip type; very red: cliff type; Pinilla-Alonso et al. 2025). Because of a lack of sufficiently bright (in the thermal IR) red targets, only one red (cliff-type) object was observed (1999 OX3) in our case, and the object was fainter than the remaining targets, which all belonged to the less red (bowl-type) group (Peixinho et al. 2012; Pinilla-Alonso et al. 2025), except for 2020 VF1, for which no color information is available (see Table 1, which summarizes the orbital and color/spectral properties of our targets). Our target selection also aimed to avoid objects with D≥300 km because they may have undergone partial if not complete differentiation, according to thermal models (e.g., Castillo-Rogez & Schmidt 2010). Moreover, D~300 km is the practical maximum size for undifferentiated bodies that are observed among P- and D-type MBAs and Jupiter trojans (e.g., Vernazza et al. 2021). We therefore adopted a similar maximum size for our targets, thereby allowing direct comparative studies of primitive small-body populations throughout the Solar System.
For all targets except 2002 GG166 (LRS only), the observations were performed in both low-resolution (5–14 μm; LRS) and medium-resolution (5–28 μm; MRS) spectroscopy modes to cover the diagnostic 5–28 μm range. LRS observations were performed in order to improve the SNR in the critical 10 μm region, in which silicates show the strongest emission. In the MRS mode, dedicated background observations were performed for all our targets either just before or after each target observation, except in the case of Bienor (see Appendix A.4). These dedicated background observations are strongly recommended for MRS observations of faint targets. In the case of 1999 OX3, the MRS observation was degraded due to a loss of lock on the guide star.
The data processing was performed using the dedicated JWST science calibration pipeline, which is open-source code written in Python. To ensure an optimal data reduction, we ran the pipeline in an interactive mode to test various nondefault options. We strictly followed the three main steps of the pipeline, which allowed us to transform the initial uncalibrated ramp data files (input to step 1) into science-ready one-dimensional (1D) spectra (final output of step 3). We always observed a difference in the MRS data of a few percent (at most) in flux between the extracted 1D spectra of the different channels. We chose to realign the spectra using channel 3 medium (13.34–15.57 μm) as the flux reference (channels 2 and 3 are considered the most reliable in terms of absolute flux; STSCI personal communication). We usually also observed a small shift in flux between the LRS and MRS data and chose to use the MRS data as reference (see Appendix A.3 for more details).
NEATM best-fit parameters and other measurements of interest.
3 Physical and thermal properties
The thermal emission was modeled and removed from our spectra using the Near-Earth Asteroid Thermal Model (NEATM; e.g., Harris 1998; Magno et al. 2019). In this equilibrium model, the incoming solar flux is balanced by the blackbody emission of the small body. The model contains two free parameters (radius and beaming factor) and several fixed parameters (heliocentric distance, JWST-target distance, phase angle, visible absolute magnitude Hv, slope parameter G, and bolometric emissivity ϵ). Since the expression of the geometric albedo is a function of the radius and the visible absolute magnitude Hv, it was estimated at the same time as the radius. Given the lack of constraints regarding our targets, we used fixed values for the slope parameter and the bolometric emissivity, namely G=0.15 and ϵ=0.95. These values are rather standard. Finally, the best fit to the data was obtained by a least-squares minimization. Although we implemented a background subtraction, an offset remained in the spectra that might result from the data realignment. To account for this, we introduced a third free parameter (a constant) along-side the radius R and beaming factor η. The absolute value of this offset ranged from 10−7 Jy for 1999OX3 to 10−4 Jy for 2020 VF 1 and 2013 LU28. Finally, the uncertainties in the thermal parameters were determined using a Monte Carlo algorithm with 1000 iterations. For the combined LRS and MRS spectra, the best-fit values of our two free parameters and their associated 1σ errors are listed in Table 2, and the best-fit models are shown in Fig. 2. For the MRS spectra alone, we list the best-fit values and their associated 1σ errors in Table A.1. The resulting emissivity spectra from the MRS modeling are shown in Fig. 3.
4 Spectral analysis
4.1 Spectral contrast
The spectral (emissivity) properties of centaurs and small TNOs appear to be globally consistent with those of Jupiter trojans (Fig. 4) and other populations of primitive bodies (i.e., P- and D-type main-belt asteroids and comets; Fig. 5), with the exception of Bienor (see Appendix A.4 for discussion). As in the case of Jupiter trojans (Martin & Emery 2023) and the nuclei and comae of comets (e.g., Kelley et al. 2010, 2017), we observe a variability in the spectral contrast that is defined as the strength of the large band, which extends from 11.2 to 18 μm with a band minimum around 13 μm (see Fig. A.3 for more details). For two of the targets with a high signal-to-noise ratio over the 10–26 μm range (Fig. 3; 2013 LU28 and 2013 XZ8), the 10 μm spectral contrast is closer to the less red P-type Jupiter trojans and the remaining two bodies (Chariklo and 2020 VF1) whose 10 μm feature resembles that of red D-type Jupiter trojans (Table 3 and Figure 4).
 |
Fig. 2 Spectral energy distributions of our six targets and of GTO target 2013 XZ8 (LRS: blue; MRS: black) along with the best-fit thermal models (gray). |
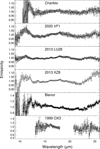 |
Fig. 3 JWST/MRS emissivity spectra of our Cycle 2 targets and GTO target 2013 XZ8, generated by dividing the measured spectral energy distribution by the best-fit NEATM for each object. |
4.2 Silicate composition
We identified the minerals present at the surfaces of our objects. We started by focusing our analysis on the objects with the highest signal-to-noise ratio (see Table 2), which were 2020 VF1, 2013 LU28, and 2013 XZ8. We identified many emissivity features indicative of crystalline olivine and pyroxene (enstatite): ~11.2 and ~19.5 μm features due to the presence of crystalline olivine and enstatite, ~11.9, ~16.2, and ~24 μm features due to olivine, and ~13.7, ~14.5, ~15.4, and ~18 μm features due to enstatite (Fig. 6). The wavelength location and intensity of the features were determined using a Gaussian fitting on the smoothed spectrum. We did not perform this analysis for the ~11.2 μm feature because we lack reliable data at shorter wavelengths to correctly estimate its intensity (this applies to our targets, not to Jupiter trojans). The values are reported in Table 4 and are displayed in Fig. 7. The location of these peaks is consistent with an Mg-rich and Fe-poor chemical composition of the silicates (Mg/(Mg+Fe)≥0.7; e.g., Koike et al. 2003; Bowey et al. 2007; Hofmeister & Pitman 2007; Kelley & Wooden 2009; Hamilton 2010; Bowey et al. 2020). A similar analysis of JWST spectra of Jupiter trojans (Fig. A.2) revealed that these features are also present at similar wavelengths, implying a similar composition (Table 4 and Fig. 7). The relative intensity of the bands varies, however. The bands of Jupiter trojans are less pronounced than those of centaurs/SDOs on average (Fig. 7). The case of 1999 OX3 (Fig. 8) reinforces this trend.
As a second step, we analyzed the spectrum of 1999 OX3, our only cliff-type target. Its signal-to-noise ratio reaches ~21 in the 15.5–18 μm range and drops to ~7 in the 21–26 μm range. We identified the presence of crystalline olivine in both ranges by its ~16.3 and ~24 μm features (Fig. 7). It is noteworthy that the intensity of both features (~7 and ~20%) is much higher (by a factor of 10 at least) than that of the other targets.
Finally, we searched for other types of silicates, namely amorphous and hydrated silicates. We were able to rule out phyllosilicate-rich materials because their emissivity spectra show a prominent emission band centered at ~22 μm, which is not seen in our spectra (e.g., Fig. A.4). However, amorphous silicates cannot be ruled out, in particular, olivine and pyroxene. Amorphous silicates have a broad emission band centered at ~18 μm, which follows the general shape of the emissivity spectrum of our primitive targets quite well (Fig. 6).
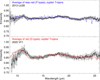 |
Fig. 4 Similarity of the spectral contrast variability between Jupiter trojans and centaurs/TNOs. The position of the emissivity features is also remarkably similar (see Figure 7). The Jupiter trojan spectra were retrieved from Martin & Emery (2023), and a slope correction was applied to match that of our targets. |
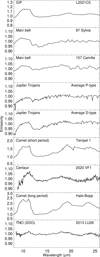 |
Fig. 5 Overview of the currently available spectral data spanning the MIRI spectral range for P- and D-type MBAs, Jupiter trojans, centaurs/TNOs, and comets. Our centaur observations provide a direct link between Kuiper belt objects and primitive populations of the inner Solar System as predicted by Solar System formation models. The IDP spectrum was retrieved from Brunetto et al. (2011), the Jupiter trojan spectra from Martin & Emery (2023), the main belt spectra from Marchis et al. (2012), and the comet coma spectra from Crovisier et al. (1997); Lisse et al. (2007); Kelley et al. (2017). |
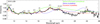 |
Fig. 6 Identification of emissivity features and positions in the spectrum of 2013 LU28 and comparison with amorphous and crystalline olivine and pyroxene (enstatite) emissivity spectra. The synthetic emissivity spectra of silicates were computed following the procedure described by Vernazza et al. (2015); Marsset et al. (2016) and using the optical constants of Koike et al. (2006) for crystalline olivine, those of Rucks et al. (2022) for crystalline pyroxene (enstatite), and those of Dorschner et al. (1995) for amorphous olivine and pyroxene. |
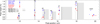 |
Fig. 7 Intensity of the crystalline olivine and pyroxene (enstatite) emissivity features (Table 4) for centaurs (blue) and Jupiter trojans (red). We did not analyze the ~11.2 μm feature because credible data at shorter wavelengths for an accurate estimation of its strength are lacking (this pertains to our targets, not to Jupiter trojans). The wavelength positions of enstatite and olivine as a function of Mg number were retrieved from (Koike et al. 2003; Bowey et al. 2007; Hofmeister & Pitman 2007; Kelley & Wooden 2009; Hamilton 2010; Bowey et al. 2020). The position of the ~13.7 μm (enstatite) feature does not vary significantly with composition. Hence, the composition of crystalline olivine and crystalline pyroxene is best determined from the remaining peaks. We cannot rule out the possibility that the position of the ~11.9 μm olivine feature in the Jupiter trojan spectra is partially biased by insufficient correction for the well-known ~12.2 μm MRS spectral leak. |
5 Discussion
5.1 Thermal properties
Our inferred values for the radius and geometric albedo of our targets (Table 2) are generally consistent with previous estimates (except for 1999 OX3), where available (e.g., Müller et al. (2020) and references therein). The only cliff-type object (1999 OX3) in our sample has the highest geometric albedo (ρv=0.22). The value is consistent with previous measurements for cold classical TNOs (Vilenius et al. 2012, 2014), which are now known to be cliff-type bodies (Pinilla-Alonso et al. 2025). In contrast, the geometric albedos of all other targets are lower than ~0.08. These low values are consistent with those reported for the less red group of centaurs (Duffard et al. 2014), a group to which these objects likely belong based on their measured colors and/or near-infrared spectral properties (see Table 1). The DiSCo survey has shown that bowl-type TNOs (Figure 1.B in Pinilla-Alonso et al. (2025)) as well as flat centaurs tend to have lower geometric albedos overall than the double-dip and cliff-type TNOs. This pattern is consistent with the compositional differences inferred from the spectral identifications: The bowl and shallow types (e.g., 2013 LU28, 2013 XZ8, and Chariklo) have dusty surfaces, which probably contributes to their darker appearance.
The main difference relative to previous measurements lies in the beaming parameter. Our inferred values appear to be lower (mostly below 0.9) than those derived from the Herschel survey for the same targets (Lellouch et al. 2013; Fornasier et al. 2013; Duffard et al. 2014; Lellouch et al. 2017; Müller et al. 2020). Given the positive correlation between the beaming parameter and the radius, this implies that our size estimates are lower than those derived from Herschel on average. The observed difference may be expected because these surfaces are presumably rough. At shorter wavelengths, the flux is dominated by the hottest regions of the object; for example, the facets that are oriented toward the Sun. At longer wavelengths, however, the overall flux emission is more balanced between cold and hot areas (Herschel). Therefore, short (long) wavelengths are expected to produce lower (higher) values of the beaming parameter. It is worth noting that our inferred values for the beaming parameter are consistent with those derived for Jupiter trojans at similar wavelengths from Spitzer observations (Emery et al. 2006; Martin & Emery 2023).
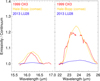 |
Fig. 8 Comparison of the intensity of the ~16.3 μm and ~24 μm crystalline olivine emissivity features after removing the continuum from the spectra of 1999 OX3 (red, cliff type; Pinilla-Alonso et al. 2025), 2013 LU28 (less red, bowl type; Pinilla-Alonso et al. 2025), and the comae of comet Hale-Bopp (Crovisier et al. 1997; Kelley et al. 2017). For 1999 OX3 and 2013 LU28, we applied a Savitzky-Golay smoothing algorithm with a 0.3 μm window. In the case of 1999 OX3, we did not consider data between 23.7 and 24 μm because the noise is strong in this wavelength region. |
5.2 Origin of the variability in the spectral contrast
Our observations revealed that the coexistence of bodies with both low- and high-contrast spectral features in the mid-infrared is a common characteristic in all primitive populations, despite the differing environments of their silicates. Specifically, Jupiter trojans have largely devolatilized surfaces, which makes them predominantly silicate rich (Wong et al. 2024). In cometary comae, silicates are no longer exposed at the surface, and centaur surfaces contain both silicates (this work; see also Licandro & Pinilla-Alonso 2005; Barucci et al. 2008; Licandro et al. 2025) and volatiles (Pinilla-Alonso et al. 2025; Licandro et al. 2025). Three mechanisms might be at the origin of an extended continuum in spectral contrast: (i) a difference in average grain size, (ii) a difference in microporosity, and (iii) a major compositional difference in terms of the abundance of neutral component(s) and/or silicate-to-ice+organics ratio. A combination of these mechanisms might also contribute to the observed variations. While we are not able to determine the mechanism(s) that cause this, we provide some insight into each, using current knowledge of chondritic porous interplanetary dust particles (CP IDPs) as a guide, among others.
If a compositional difference (iii) indeed causes the observed contrast, it must fit the Jupiter trojan albedo constraint, according to which, the two groups of Jupiter trojans have the same mean albedo within the uncertainties (Emery et al. 2011, 2024), without inducing any further change in their mid-infrared spectral properties. This has implications for the nature/composition of refractory materials. Variability in a neutral component such as amorphous carbon, where the bulk abundance of carbon in CP IDPs varies from ~4 to ~45% (Bradley 2007), might be at the origin of the variation in spectral contrast, while also producing a slope difference in the visible and near-infrared (Poggiali et al. 2024), but its effect on the resulting albedo would be inconsistent with observations (Emery et al. 2011). The same reasoning could be applied to a varying abundance of sulfide grains (Sultana et al. 2023) because sulfides are the second most abundant class of minerals in CP IDPs (Bradley 2007). A variation in the relative abundance of crystalline and amorphous silicates may also cause the different intensities of the emissivity features, with a progressive reduction in the crystalline features as the proportion of amorphous silicate increases (e.g., Martin & Emery 2023). A variation in this ratio is indeed observed among CP IDPs (e.g., Wozniakiewicz et al. 2013; Merouane et al. 2014). A variation in the silicate-to-ice+organics ratio may be the most compelling explanation, however. Red cliff-type objects have a higher albedo on average than less red bowl-type objects (Vilenius et al. 2012, 2014; Pinilla-Alonso et al. 2025), which might be consistent with a lower silicate-to-ice+organics ratio for cliff-type objects. If this were the case, it would imply an increased porosity between the silicate grains (see next point) that mimics extreme porosity levels reproduced in the laboratory using an infrared-transparent medium such as KBr well (Vernazza et al. 2012; Izawa et al. 2021). In these experiments, the intensity of the emission bands increases with increasing abundance of KBr with respect to dust. While mid-infrared spectroscopic measurements of red and/or cliff-type bodies are currently limited to two objects, 1999 OX3 (this paper) and Elatus (Tegler et al. 2016; Barucci et al. 2008), with further limitations in wavelength coverage, the intensity of the silicate bands appears to exceed that observed for less red bowl-type and shallow-type objects by far (this work as well as centaur Asbolus; see Barucci et al. 2008).
With regard to hypothesis (ii), a difference in the average microporosity of the silicate particles might explain the diversity in spectral contrast (e.g., Vernazza et al. 2012; Izawa et al. 2021). There are only a few density measurements of CP IDPs (e.g., Flynn & Sutton 1991; Joswiak et al. 2007), and they typically fall in the range of 0.6–1.3 g/cm3, which implies substantial microporosity (~70%; Bradley 2007). This high level of porosity is seen in electron images of IDPs (e.g., Bradley 2007) and also in X-ray nanotomography images (Hu & Winarski 2016). The continuum in density from 0.6 to 1.3 g/cm3, consistent with a continuum in porosity, may explain the continuum in spectral contrast observed among Jupiter trojans (Martin & Emery 2023) and centaurs and small TNOs (this work and Barucci et al. 2008).
Finally, regarding hypothesis (i), laboratory measurements (e.g., Le Bras & Erard 2003; Poggiali et al. 2024 have shown that a variation in the grain size leads to a variation in the mid-infrared spectral contrast. Along these lines, it is interesting to note that CP IDPs appear to be (similarly to chondrules in chondritic meteorites) sorted by size (Wozniakiewicz et al. 2012, 2013). Size-sorting was observed for crystalline silicates and sulfide grains, but not for amorphous ones (Wozniakiewicz et al. 2013). Hence, a variability in the average grain size may explain the observed difference in spectral contrast. For submicron-sized particles, it is understood that smaller grain sizes will lead to more pronounced emissivity features, which would suggest that the average grain size of D-type asteroids is smaller than that of P types.
In conclusion, the most likely causes of the variation in the spectral contrast appear to be variability in the silicate-to-ice+organics ratio, the microporosity level of the silicate grains, and the grain size. A different abundance of carbon or opaque minerals (sulfides) would lead to a variation in albedo, which is not observed among Jupiter trojans (Emery et al. 2011, 2024). The extreme intensity of the silicate features in the spectra of red and/or cliff-type bodies (1999 OX3, Elatus) versus bowl types, however, is difficult to reconcile with a variation in the average grain size and/or degree of microporosity of an IDP particle. If these two suggestions were true, then the emissivity spectra of inner Solar System bodies would have the same intensity as the microporosity, and the grain size of an IDP particle should not evolve closer to the Sun. In particular, for the surfaces of cliff-type bodies to mimic comet comae, this implies substantial spacing between silicate particles, hence a likely low silicate-to-ice+organics ratio at their surfaces, which is consistent with their higher mean albedo (Vilenius et al. 2012, 2014). This investigation would benefit from a full analysis of a sample of CP IDPs, including mid-infrared spectroscopy, density measurements, and X-ray nanotomography imaging (Hu & Winarski 2016) and from density measurements of a sample of bowl- and cliff-type objects to determine a possible variation in the silicate-to-ice+organics ratio of these two main compositional groups of TNOs (Pinilla-Alonso et al. 2025).
5.3 Silicate composition and disk evolution
The spectral properties of our targets appear to be remarkably similar to those of other populations of primitive bodies (e.g., P- and D-type MBAs, Jupiter trojans, and comets; see Figs. 4 and 5), both in terms of spectral contrast and of the wavelength position of the emission (compositional) features. The composition of the silicates at the object surfaces is dominated by two anhydrous minerals in crystalline state, namely olivine and pyroxene. Both minerals appear to be Mg rich (Mg/(Mg+Fe)≥0.7), which makes them excellent analogs of cometary and CP IDP crystal (e.g., Wooden et al. 2000; Wooden 2002; Bradley 2007; Wooden et al. 2017). Our data also appear to be consistent with the presence of amorphous silicates, although their unequivocal identification is more difficult and model dependent (e.g., Harker et al. 2023). This is overall consistent with a common origin predicted for these currently dynamically isolated populations (e.g., Morbidelli et al. 2005; Levison et al. 2009) and with the interpretation that CP IDPs represent the extraterrestrial analogs of the surfaces of these bodies in terms of their refractory component (e.g., Vernazza et al. 2015, 2022b,a and references therein). While chondrule-poor aqueous-altered chondritic smooth IDPs and CI chondrites are unlikely to be representative samples of the surfaces of these bodies, they may well sample their interiors (Vernazza et al. 2021). Thermal modeling efforts indeed suggest that partial differentiation may have been unavoidable for D≥130 km TNOs (Carry et al. 2021). A partially differentiated water-altered interior of primitive TNOs appears to be consistent with the spectral diversity observed among the irregular satellites of Jupiter (Sharkey et al. 2025), which are former TNOs in the context of the Nice model.
The presence of crystalline silicates on the surfaces of red and/or cliff-type bodies (1999 OX3: this paper; Elatus: Barucci et al. 2008) allowed us to define a lower limit on the extent of the radial mixing (Bockelée-Morvan et al. 2002) that occurred in the protosolar disk prior to the formation of outer Solar System plan-etesimals. This is because silicates in the interstellar medium are almost entirely in amorphous form (e.g., Kemper et al. 2004; Min et al. 2007; Fogerty et al. 2016), while the transformation of amorphous silicates into crystalline ones (thermal annealing) requires temperatures above 800 K (e.g., Gail 1998), which are incompatible with the volatile content of comets, centaurs, and small TNOs and also with the presence of amorphous silicates in CP IDPs. It follows that crystalline silicates probably formed in the hot inner solar nebula and were subsequently transported to the outer Solar System (Keller & Gail 2004). Since the cold classical belt between 42 and 47 AU is mostly inhabited by red cliff-type bodies (e.g., Marsset et al. 2023; Pinilla-Alonso et al. 2025 and references therein), the observation of crystalline silicates on the surfaces of two of these bodies (1999 OX3 and Elatus) suggests that crystalline silicates were transported from the inner solar nebula to at least ~45 AU from the Sun.
5.4 Origin: Linking the inner and outer Solar System
We attempt to link the primitive bodies of the inner Solar System (P- and D-type main-belt asteroids and Jupiter trojans) and the small bodies of the outer Solar System (bowl- and cliff-type centaurs/TNOs) based on the results of our study together with previous measurements for these populations and with dynamical studies. In particular, we attempt to determine whether former bowl and cliff-type objects existed in the main asteroid belt and among the Jupiter trojans. The hot TNO population, whose size frequency distribution matches that of Jupiter trojans (Fraser et al. 2014), comprises both bowl- and cliff-type objects (Pinilla-Alonso et al. (2025) and references therein). According to the dynamical Nice model (Levison et al. 2008), the existence of this hot population is directly related to the outward migration of the ice giants (Uranus and Neptune). There is no other compelling mechanism capable of reproducing the architecture of the Kuiper belt to date. As an inevitable byproduct of the outward migration of the ice giants, a fraction of the ancestral population of hot TNOs migrated toward the inner Solar System before it was trapped as Jupiter trojans (Morbidelli et al. 2005) and in the main asteroid belt (Levison et al. 2009; Vokrouhlický et al. 2016). Furthermore, the silicate composition of P- and D-type asteroids and Jupiter trojans appears to be very similar to that of comets, centaurs, and small TNOs, although we currently lack complete 10–25 μm high SNR spectra for red cliff-type bodies (this work and Emery et al. 2006; Barucci et al. 2008; Vernazza et al. 2012; Vernazza & Beck 2017; Kelley et al. 2017; Vernazza et al. 2022a,b; Martin & Emery 2023 and references therein). In particular, CP IDPs appear to be the likely analogs of the refractory materials present at the surfaces of these bodies (Fig. 5). In summary, based on the silicate composition and dynamical modeling, it is highly likely that former bowl- and cliff-type bodies are present in the inner Solar System.
It is worth noting that most centaurs and small TNOs with a high signal-to-noise ratio JWST/MRS (2013 LU28, Chariklo, and 2020 VF1) or Spitzer spectrum (Asbolus, Barucci et al. 2008) are confirmed or probable bowl types based on their colors (Peixinho et al. 2012; Fraser & Brown 2012; Fraser et al. 2023) and/or JWST/NIRSpec spectrum (Pinilla-Alonso et al. 2025). Furthermore, it is interesting to note that the spectral variability in the mid-infrared range observed among Jupiter trojans is fully captured by the bowl-type population (see Fig. 4). This might mean that the majority of P- and D-type bodies in the inner Solar System are former bowl types, but this is unlikely according to the dynamical argument above. We instead propose that D-type (red) Jupiter trojans are genetically related to cliff-type bodies, whereas P-type (less red) Jupiter trojans are genetically related to bowl-type objects. Arguments in favor of this hypothesis are as follows: (1) A broad 3 μm OH band is seen in the spectra of P-type Jupiter trojans (Wong et al. 2024) that might represent the evolutionary form (due to the greater proximity to the Sun) of the water-ice band detected in bowl-type spectra (Pinilla-Alonso et al. 2025; Licandro et al. 2025). (b) Aliphatic organics are dominantly present at the surfaces of D-type Jupiter trojans (Wong et al. 2024), and these organics have been identified at the surfaces of cliff-type bodies a well as double-dip bodies (Pinilla-Alonso et al. 2025). iii) Silicate emissivity features appear to be significantly more pronounced for cliff-type bodies (versus bowl-type ones), and the same is true for D-type Jupiter trojans (versus P types). Assuming a similar level of surface devolatilization between implanted bowl and cliff types, the difference in the mid-infrared spectral contrast would be expected to remain, whereas the amplitude of the spectral contrast between implanted bowl and cliff types would be expected to decrease on average due to the loss of volatiles and hence a reduction in inter-silicate porosity (increase in the silicate-to-ice+organics ratio).
In situ exploration of Jupiter trojans by the NASA Lucy mission (Levison et al. 2021) will provide important clues to possible differences in composition and surface properties between P- and D-type bodies. Similarly, density measurements of bowl- and cliff-type bodies, together with measurements of the silicate composition of a sample of cliff-type bodies, will be required to confirm or refute the hypotheses formulated above and to consolidate the links between the small body populations in the inner and outer Solar System.
6 Conclusions
We reported the mid-infrared spectra of three centaurs and three scattered-disk objects with a centaur-like orbit obtained with JWST/MIRI as part of the Cycle 2 GO 2820 observing program (Vernazza et al. 2023). Our study also included JWST/MIRI data for an additional centaur (2013 XZ8: GTO target (Hines et al. 2017)) and three Jupiter trojans (targets of the Cycle 1 GO 2574 program; Brown et al. (2021)). The geometric albedo, radius, and beaming parameters were derived for all targets using a best-fit NEATM model of their spectral energy distribution. Our albedo values for less red (ρv ≤0.1) and red (ρv ≥0.1) centaurs and small TNOs are consistent with those derived from Herschel observations. Our derived values for the beaming parameter appear to be lower on average than those measured by Herschel (≤0.9), however, but they agree with those inferred for Jupiter trojans. The emissivity spectra of centaurs and small TNOs are remarkably similar to those of Jupiter trojans, P- and D-type main-belt asteroids and comets, which supports the idea of a common origin as predicted by the Nice model. A variability of the spectral contrast is observed in the other dynamical populations. The spectral contrast observed for the cliff-type target 1999 OX3 is close to the contrasts observed for comet comae, suggesting substantial surface porosity that is probably related to a lower silicate-to ices+organics ratio. For bowl types, a variability in the microporosity and grain size appears to be the most likely cause of the variation in spectral contrast. In terms of extraterrestrial analogs, chondritic porous IDPs appear to be the most likely candidates. A careful analysis of the emission features in the spectra of centaurs, small TNOs, and Jupiter trojans showed that crystalline olivine (forsterite) and pyroxene (enstatite) with Mg/(Mg+Fe) ≥ 0.7 are major refractory components of the surfaces of these objects. This further supports strong connections with CP IDPs and comets. Together with previous measurements for these populations and dynamical studies, our results raise the possibility of a genetic link between P types and bowl types, and between D types and cliff types. Future observations should attempt to measure the silicate composition of a sample of cliff-type bodies. This was done only partially in this study.
Acknowledgements
P.V., L.J., P.S., and S.A. acknowledge support from CNES and CNRS/INSU/PNP. SA acknowledges support from Institut Origines (AMU). J.L. acknowledge support from the Agencia Estatal de Investigacion del Ministerio de Ciencia e Innovación (AEI-MCINN) under grant “Hydrated Minerals and Organic Compounds in Primitive Asteroids” with reference PID2020-120464GB-100. Based on observations with the NASA/ESA/CSA James Webb Space Telescope obtained from the Mikulski Archive for Space Telescopes at the Space Telescope Science Institute, which is operated by the Association of Universities for Research in Astronomy, Incorporated, under NASA contract NAS5-03127. N.P.-A. acknowledges the Ministry of Science, Innovation, and Universities (MCIU) in Spain and the State Agency for Research (AEI) for funding through the ATRAE programme, project ATR2023-145683. Support for Program number 2820 was provided through a grant from the STScI under NASA contract NAS5-03127. We would like to thank the referee and editor, Emmanuel Lellouch, for their pertinent and constructive comments.
Appendix A Additional figures and tables
A.1 Dynamical classification
We have determined the dynamical class of the objects in this sample using two methods. The first follows the Gladman nomenclature (Gladman et al. 2008), which is based on 10 Myr orbital numerical integrations. The updated list of Gladman classes for 3357 objects can be found in Volk & Van Laerhoven (2024). The second method uses a decision tree described in Peixinho et al. (2012), based on the method of Lykawka & Mukai (2007). Both methods lead to the same dynamic classification for the objects in our sample. Our sample consists of 4 Centaurs (Chariklo, Bienor, 2020 VF1, 2013 XZ8) and 3 Scattered Disk objects (1999 OX3, 2002 GG166, 2013 LU28) (Fig. 1).
2013 LU28 can also be identified as a Damocloid, which are inactive Halley type long-period comets (Jewitt 2005). It is a rather peculiar object with a retrograde, highly inclined and eccentric orbit (Table 1, Fig. 1) and an orbital period of 2600 yr. Highly inclined retrograde objects account for less than one percent of discovered small Solar System objects (Hromakina et al. 2021). With an unstable orbit whose lifetime is only 200 kyr, 2013 LU28 could be a very recent visitor from the transNeptunian region and even from the Oort Cloud (de la Fuente Marcos & de la Fuente Marcos 2014).
A.2 Data reduction
For the data reduction, we used the Python notebooks proposed by the STSCI, in open access, version 1.17.1 (Bushouse et al. 2025). The STSCI pipeline processes the raw data (uncal) through three steps to the 1D spectrum (x1d), using the default reduction options, plus fringe reduction in steps two and three.
For the data reduction of the MRS data, the calibration reference files range from jwst1298.pmap to jwst1303.pmap. Dedicated background observations were used to reduce the data for all objects except GTO target 2013XZ8. Following a thorough evaluation, it was determined that the two background removal methods yield comparable results. Consequently, the decision was made to proceed with the pixel-background reduction method for all targets. To extract the 1D spectra, the “point source” extraction aperture was used, with its auto-centering option. Following the extraction of the individual sub-bands (12 in total), flux level differences were observed between them at the level of 10% or less. These discrepancies may be attributable to a combination of factors, including the integration time for each object (≥4 h) and a change in cross-section area with rotation. To produce the final spectral energy distribution, we realigned all sub-bands with respect to channel 3 medium (13.34–15.57 μm), using the overlapping parts of the sub-bands.
Regarding the data reduction of the LRS slit observations, the sky regions of the nod pointings were used as background measurement, hence for background subtraction. The calibration reference files used for data reduction range from jwst1298.pmap to jwst1322.pmap.
A.3 Merging LRS & MRS data and filtering
The realignment of the LRS and MRS fluxes was done at 11.5 μm and was a challenging task due to the presence of substantial noise in their overlap zones. Our thermal studies were conducted on the merged LRS+MRS spectra (Fig. 2), whereas the emissivity analysis of our targets was conducted on MRS spectra only (Fig. 3). The LRS data beyond 12.5 μm is very noisy (a well-known issue; Fig. A.2), which limits its pertinence, as our targets are too faint at shorter wavelengths (less then ~10 μm).
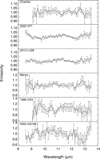 |
Fig. A.1 JWST/LRS emissivity spectra of our Cycle 2 targets, generated by dividing the measured spectral energy distribution by the best-fit NEATM for each object. |
The final stage of the procedure involved the removal of outliers and the estimation of uncertainty. This was achieved by applying a Savitzky-Golay filter to the data and measuring the residuals. A rolling average of the residuals was then calculated, and points above 3σ were removed. This step was repeated until no outliers remained. Finally, the uncertainty associated with the retained points was determined as the remaining residuals, smoothed with the same Savitzky-Golay filter. The parameters of this filter were a window of 1 μm and a polynomial of order 3. Next, we binned the data using a 0.05 μm running box. These filtering and binning steps proved to be particularly beneficial, as the spectral resolution of the MRS data (R~1500–3000) significantly exceeds the requirements for identifying and analysing the silicate emissivity features (R~100–300). The binning procedure enabled us to enhance the signal-to-noise ratio.
NEATM best-fit parameters for MRS only.
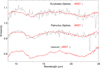 |
Fig. A.2 Sample of Jupiter Trojans emissivity spectra collected with Spitzer (Martin & Emery 2023) and JWST (Brown et al. 2021). The peak positions of the JWST spectra are reported in Table 4. |
A.4 Bienor
We do not have an explanation for the presence of several features present in the spectrum of Bienor (e.g., 18-19 μm, 21-22 μm; Fig. 3) which occur within sub-bands and not at their edges. When applying NEATM to the sub-bands acquired simultaneously, we obtain similar albedo and radius estimates, suggesting that Bienor’s short rotation period (9.17h; Rizos et al. (2024)) w.r.t our integration times and/or elongated shape (Rizos et al. 2024) are not the cause of the odd features seen in its spectrum. It is worth noting that dedicated background observations made on the same day failed and were successfully made 17 days later. Given the importance of background correction for faint targets, this may play a role in the presence of the odd features and the overall distinct spectral profile.
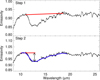 |
Fig. A.3 Illustration of the calculation of the spectral contrast on the average spectrum of red (D-type) Jupiter Trojans (Martin & Emery 2023). Top: Removal of a linear continuum that is tangent to the maxima before (11.2 μm) and after (18 μm) the band. Bottom: The depth of the band was computed after the continuum removal using a polynomial fit (blue) to determine the minimum in emissivity. The contrast is illustrated by the arrow (black). |
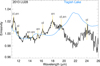 |
Fig. A.4 Comparison of the emissivity spectrum of 2013 LU28 with that of the Tagish Lake meteorite. Aqueously altered matrix-rich carbonaceous chondrites such as Tagish Lake and Orgueil (e.g. Sandford 1984; Vernazza et al. 2012; Beck et al. 2014; Izawa et al. 2021) exhibit prominent emissivity features centred at ~10 μm and ~22 μm similar to those observed in aqueously altered chondritic smooth IDP spectra (Sandford & Walker 1985). However, these features are very different from those observed in primitive bodies, as shown in this figure. |
References
- Barucci, M. A., Brown, M. E., Emery, J. P., & Merlin, F. 2008, in The Solar System Beyond Neptune, eds. M. A. Barucci, H. Boehnhardt, D. P. Cruikshank, A. Morbidelli, & R. Dotson (Tucson: University of Arizona Press), 143 [Google Scholar]
- Beck, P., Garenne, A., Quirico, E., et al. 2014, Icarus, 229, 263 [Google Scholar]
- Berthier, J., Carry, B., Mahlke, M., & Normand, J. 2023, A&A, 671, A151 [NASA ADS] [CrossRef] [EDP Sciences] [Google Scholar]
- Bockelée-Morvan, D., Gautier, D., Hersant, F., Huré, J. M., & Robert, F. 2002, A&A, 384, 1107 [CrossRef] [EDP Sciences] [Google Scholar]
- Bowey, J. E., Morlok, A., Köhler, M., & Grady, M. 2007, MNRAS, 376, 1367 [NASA ADS] [Google Scholar]
- Bowey, J. E., Hofmeister, A. M., & Keppel, E. 2020, MNRAS, 497, 3658 [NASA ADS] [CrossRef] [Google Scholar]
- Bradley, J. 2007, in Treatise on Geochemistry, eds. H. D. Holland, & K. K. Turekian (Oxford: Pergamon), 1 [Google Scholar]
- Braga-Ribas, F., Sicardy, B., Ortiz, J. L., et al. 2014, Nature, 508, 72 [NASA ADS] [CrossRef] [Google Scholar]
- Brasser, R. 2008, A&A, 492, 251 [NASA ADS] [CrossRef] [EDP Sciences] [Google Scholar]
- Brasser, R., & Morbidelli, A. 2013, Icarus, 225, 40 [Google Scholar]
- Brown, M. E., Binzel, R. P., Emery, J. P., et al. 2021, JWST Observations of Lucy Mission Targets (USA: JWST Proposal. Cycle 1), ID. #2574 [Google Scholar]
- Brunetto, R., Borg, J., Dartois, E., et al. 2011, Icarus, 212, 896 [Google Scholar]
- Brunetto, R., Hénault, E., Cryan, S., et al. 2025, ApJ, 982, L8 [Google Scholar]
- Bushouse, H., Eisenhamer, J., Dencheva, N., et al. 2025, JWST Calibration Pipeline (The Netherlands: ASP Books) [Google Scholar]
- Carry, B., Vernazza, P., Vachier, F., et al. 2021, A&A, 650, A129 [NASA ADS] [CrossRef] [EDP Sciences] [Google Scholar]
- Castillo-Rogez, J. C., & Schmidt, B. E. 2010, Geophys. Res. Lett., 37, L10202 [Google Scholar]
- Crovisier, J., Leech, K., Bockelee-Morvan, D., et al. 1997, Science, 275, 1904 [NASA ADS] [CrossRef] [Google Scholar]
- de la Fuente Marcos, C., & de la Fuente Marcos, R. 2014, Ap&SS, 352, 409 [NASA ADS] [CrossRef] [Google Scholar]
- De Prá, M. N., Hénault, E., Pinilla-Alonso, N., et al. 2025, Nat. Astron., 9, 252 [Google Scholar]
- DeMeo, F. E., & Carry, B. 2013, Icarus, 226, 723 [NASA ADS] [CrossRef] [Google Scholar]
- DeMeo, F. E., & Carry, B. 2014, Nature, 505, 629 [NASA ADS] [CrossRef] [Google Scholar]
- Dorschner, J., Begemann, B., Henning, T., Jaeger, C., & Mutschke, H. 1995, A&A, 300, 503 [Google Scholar]
- Duffard, R., Pinilla-Alonso, N., Santos-Sanz, P., et al. 2014, A&A, 564, A92 [NASA ADS] [CrossRef] [EDP Sciences] [Google Scholar]
- Emery, J. P., Cruikshank, D. P., & Van Cleve, J. 2006, Icarus, 182, 496 [NASA ADS] [CrossRef] [Google Scholar]
- Emery, J. P., Burr, D. M., & Cruikshank, D. P. 2011, AJ, 141, 25 [NASA ADS] [CrossRef] [Google Scholar]
- Emery, J. P., Binzel, R. P., Britt, D. T., et al. 2024, Space Sci. Rev., 220, 28 [Google Scholar]
- Flynn, G. J., & Sutton, S. R. 1991, Lunar Planet. Sci. Conf. Proc., 21, 541 [NASA ADS] [Google Scholar]
- Fogerty, S., Forrest, W., Watson, D. M., Sargent, B. A., & Koch, I. 2016, ApJ, 830, 71 [NASA ADS] [CrossRef] [Google Scholar]
- Fornasier, S., Lellouch, E., Müller, T., et al. 2013, A&A, 555, A15 [NASA ADS] [CrossRef] [EDP Sciences] [Google Scholar]
- Fraser, W. C., & Brown, M. E. 2012, ApJ, 749, 33 [Google Scholar]
- Fraser, W. C., Brown, M. E., Morbidelli, A., Parker, A., & Batygin, K. 2014, ApJ, 782, 100 [Google Scholar]
- Fraser, W. C., Pike, R. E., Marsset, M., et al. 2023, PSJ, 4, 80 [Google Scholar]
- Gail, H. P. 1998, A&A, 332, 1099 [NASA ADS] [Google Scholar]
- Gladman, B., Marsden, B. G., & Vanlaerhoven, C. 2008, in The Solar System Beyond Neptune, eds. M. A. Barucci, H. Boehnhardt, D. P. Cruikshank, A. Morbidelli, & R. Dotson (Tucson: University of Arizona Press), 43 [Google Scholar]
- Gradie, J., & Tedesco, E. 1982, Science, 216, 1405 [NASA ADS] [CrossRef] [Google Scholar]
- Guilbert, A., Alvarez-Candal, A., Merlin, F., et al. 2009, Icarus, 201, 272 [NASA ADS] [CrossRef] [Google Scholar]
- Hamilton, V. E. 2010, Chemie der Erde / Geochemistry, 70, 7 [CrossRef] [Google Scholar]
- Harker, D. E., Wooden, D. H., Kelley, M. S. P., & Woodward, C. E. 2023, PSJ, 4, 242 [Google Scholar]
- Harris, A. W. 1998, Icarus, 131, 291 [Google Scholar]
- Hines, D. C., Holler, B. J., Mueller, M. M., & Wright, G. 2017, Kuiper Belt Science with JWST (USA: JWST Proposal. Cycle 1), ID. #1272 [Google Scholar]
- Hofmeister, A. M., & Pitman, K. M. 2007, Phys. Chem. Minerals, 34, 319 [Google Scholar]
- Hromakina, T., Belskaya, I., Krugly, Y., et al. 2021, A&A, 647, A71 [NASA ADS] [CrossRef] [EDP Sciences] [Google Scholar]
- Hu, Z. W., & Winarski, R. P. 2016, Meteor. Planet. Sci., 51, 1632 [Google Scholar]
- Izawa, M. R. M., King, P. L., Vernazza, P., Berger, J. A., & McCutcheon, W. A. 2021, Icarus, 359, 114328 [Google Scholar]
- Jewitt, D. 2005, AJ, 129, 530 [NASA ADS] [CrossRef] [Google Scholar]
- Joswiak, D. J., Brownlee, D. E., Pepin, R. O., & Schlutter, D. J. 2007, ESA SP, 643, 141 [Google Scholar]
- Keller, C., & Gail, H. P. 2004, A&A, 415, 1177 [NASA ADS] [CrossRef] [EDP Sciences] [Google Scholar]
- Kelley, M. S., & Wooden, D. H. 2009, Planet. Space Sci., 57, 1133 [NASA ADS] [CrossRef] [Google Scholar]
- Kelley, M. S., Woodward, C. E., Harker, D. E., et al. 2010, Lunar Planet. Sci. Conf., 41, 2375 [Google Scholar]
- Kelley, M. S. P., Woodward, C. E., Gehrz, R. D., Reach, W. T., & Harker, D. E. 2017, Icarus, 284, 344 [NASA ADS] [CrossRef] [Google Scholar]
- Kemper, F., Vriend, W. J., & Tielens, A. G. G. M. 2004, ApJ, 609, 826 [Google Scholar]
- Koike, C., Chihara, H., Tsuchiyama, A., et al. 2003, A&A, 399, 1101 [NASA ADS] [CrossRef] [EDP Sciences] [Google Scholar]
- Koike, C., Mutschke, H., Suto, H., et al. 2006, A&A, 449, 583 [CrossRef] [EDP Sciences] [Google Scholar]
- Le Bras, A., & Erard, S. 2003, Planet. Space Sci., 51, 281 [NASA ADS] [CrossRef] [Google Scholar]
- Lellouch, E., Santos-Sanz, P., Lacerda, P., et al. 2013, A&A, 557, A60 [NASA ADS] [CrossRef] [EDP Sciences] [Google Scholar]
- Lellouch, E., Moreno, R., Müller, T., et al. 2017, A&A, 608, A45 [NASA ADS] [CrossRef] [EDP Sciences] [Google Scholar]
- Levison, H. F., Morbidelli, A., Van Laerhoven, C., Gomes, R., & Tsiganis, K. 2008, Icarus, 196, 258 [Google Scholar]
- Levison, H. F., Bottke, W. F., Gounelle, M., et al. 2009, Nature, 460, 364 [NASA ADS] [CrossRef] [Google Scholar]
- Levison, H. F., Olkin, C. B., Noll, K. S., et al. 2021, PSJ, 2, 171 [Google Scholar]
- Licandro, J., & Pinilla-Alonso, N. 2005, ApJ, 630, L93 [Google Scholar]
- Licandro, J., Pinilla-Alonso, N., Holler, B. J., et al. 2025, Nat. Astron., 9, 245 [Google Scholar]
- Lisse, C. M., Kraemer, K. E., Nuth, J. A., Li, A., & Joswiak, D. 2007, Icarus, 187, 69 [Google Scholar]
- Lykawka, P. S., & Ito, T. 2023, Sci. Rep., 13, 4708 [Google Scholar]
- Lykawka, P. S., & Mukai, T. 2007, Icarus, 189, 213 [NASA ADS] [CrossRef] [Google Scholar]
- Magno, K., Kotson, M., Ruprecht, J. D., Vaillancourt, J. E., & Viggh, H. 2019, in 1st NEO and Debris Detection Conference_ESA2019, 21 [Google Scholar]
- Marchis, F., Enriquez, J. E., Emery, J. P., et al. 2012, Icarus, 221, 1130 [NASA ADS] [CrossRef] [Google Scholar]
- Marsset, M., Vernazza, P., Birlan, M., et al. 2016, A&A, 586, A15 [NASA ADS] [CrossRef] [EDP Sciences] [Google Scholar]
- Marsset, M., Fraser, W. C., Pike, R. E., et al. 2019, AJ, 157, 94 [Google Scholar]
- Marsset, M., Fraser, W. C., Schwamb, M. E., et al. 2023, PSJ, 4, 160 [Google Scholar]
- Martin, A. C., & Emery, J. P. 2023, PSJ, 4, 153 [Google Scholar]
- Merouane, S., Djouadi, Z., & Le Sergeant d’Hendecourt, L. 2014, ApJ, 780, 174 [Google Scholar]
- Min, M., Waters, L. B. F. M., de Koter, A., et al. 2007, A&A, 462, 667 [NASA ADS] [CrossRef] [EDP Sciences] [Google Scholar]
- Morbidelli, A., & Nesvorný, D. 2020, in The Trans-Neptunian Solar System, eds. D. Prialnik, M. A. Barucci, & L. Young (Amsterdam: Elsevier), 25 [CrossRef] [Google Scholar]
- Morbidelli, A., Levison, H. F., Tsiganis, K., & Gomes, R. 2005, Nature, 435, 462 [Google Scholar]
- Morbidelli, A., Brasser, R., Gomes, R., Levison, H. F., & Tsiganis, K. 2010, AJ, 140, 1391 [NASA ADS] [CrossRef] [Google Scholar]
- Müller, T., Lellouch, E., & Fornasier, S. 2020, in The Trans-Neptunian Solar System, eds. D. Prialnik, M. A. Barucci, & L. Young (Amsterdam: Elsevier), 153 [CrossRef] [Google Scholar]
- Nesvorný, D. 2015, AJ, 150, 73 [CrossRef] [Google Scholar]
- Nesvorný, D. 2018, ARA&A, 56, 137 [CrossRef] [Google Scholar]
- Peixinho, N., Delsanti, A., Guilbert-Lepoutre, A., Gafeira, R., & Lacerda, P. 2012, A&A, 546, A86 [NASA ADS] [CrossRef] [EDP Sciences] [Google Scholar]
- Pinilla-Alonso, N., Licandro, J., Brunetto, R., et al. 2024, A&A, 692, L11 [NASA ADS] [CrossRef] [EDP Sciences] [Google Scholar]
- Pinilla-Alonso, N., Brunetto, R., De Prá, M. N., et al. 2025, Nat. Astron., 9, 230 [Google Scholar]
- Poggiali, G., Fossi, L., Wargnier, A., et al. 2024, A&A, 685, A14 [NASA ADS] [CrossRef] [EDP Sciences] [Google Scholar]
- Raymond, S. N., & Izidoro, A. 2017a, Sci. Adv., 3, e1701138 [NASA ADS] [CrossRef] [Google Scholar]
- Raymond, S. N., & Izidoro, A. 2017b, Icarus, 297, 134 [CrossRef] [Google Scholar]
- Raymond, S. N., & Nesvorný, D. 2022, in Vesta and Ceres. Insights from the Dawn Mission for the Origin of the Solar System (Cambridge: Cambridge University Press), 227 [Google Scholar]
- Rizos, J. L., Fernández-Valenzuela, E., Ortiz, J. L., et al. 2024, A&A, 689, A82 [NASA ADS] [CrossRef] [EDP Sciences] [Google Scholar]
- Rucks, M. J., Ye, C., Sklute, E. C., et al. 2022, Earth and Space Science, 9, e02104 [Google Scholar]
- Sandford, S. A. 1984, Icarus, 60, 115 [Google Scholar]
- Sandford, S. A., & Walker, R. M. 1985, ApJ, 291, 838 [NASA ADS] [Google Scholar]
- Sharkey, B. N. L., Rivkin, A. S., Cartwright, R. J., et al. 2025, arXiv e-prints [arXiv:2501.16484] [Google Scholar]
- Sultana, R., Poch, O., Beck, P., et al. 2023, Icarus, 395, 115492 [NASA ADS] [CrossRef] [Google Scholar]
- Tegler, S. C., Romanishin, W., & Consolmagno, G. J. 2016, AJ, 152, 210 [NASA ADS] [CrossRef] [Google Scholar]
- Tsiganis, K., Gomes, R., Morbidelli, A., & Levison, H. F. 2005, Nature, 435, 459 [Google Scholar]
- Usui, F., Hasegawa, S., Ootsubo, T., & Onaka, T. 2019, PASJ, 71, 1 [NASA ADS] [CrossRef] [Google Scholar]
- Vernazza, P., & Beck, P. 2017, in Planetesimals: Early Differentiation and Consequences for Planets, eds. L. T. Elkins-Tanton, & B. P. Weiss (Cambridge: Cambridge University Press), 269 [CrossRef] [Google Scholar]
- Vernazza, P., Delbo, M., King, P. L., et al. 2012, Icarus, 221, 1162 [NASA ADS] [CrossRef] [Google Scholar]
- Vernazza, P., Marsset, M., Beck, P., et al. 2015, ApJ, 806, 204 [Google Scholar]
- Vernazza, P., Ferrais, M., Jorda, L., et al. 2021, A&A, 654, A56 [NASA ADS] [CrossRef] [EDP Sciences] [Google Scholar]
- Vernazza, P., Beck, P., Ruesch, O., et al. 2022a, Exp. Astron., 54, 1051 [Google Scholar]
- Vernazza, P., Usui, F., & Hasegawa, S. 2022b, in Vesta and Ceres. Insights from the Dawn Mission for the Origin of the Solar System, eds. S. Marchi, C. A. Raymond, & C. T. Russell (Cambridge: Cambridge University Press), 3 [Google Scholar]
- Vernazza, P., Anderson, S. E., Beck, P., et al. 2023, Deciphering the silicate composition of Centaurs and small TNOs (USA: JWST Proposal. Cycle 2), ID. #2820 [Google Scholar]
- Vilenius, E., Kiss, C., Mommert, M., et al. 2012, A&A, 541, A94 [NASA ADS] [CrossRef] [EDP Sciences] [Google Scholar]
- Vilenius, E., Kiss, C., Müller, T., et al. 2014, A&A, 564, A35 [NASA ADS] [CrossRef] [EDP Sciences] [Google Scholar]
- Vokrouhlický, D., Bottke, W. F., & Nesvorný, D. 2016, AJ, 152, 39 [Google Scholar]
- Volk, K., & Van Laerhoven, C. 2024, Res. Notes Am. Astron. Soc., 8, 36 [Google Scholar]
- Walsh, K. J., Morbidelli, A., Raymond, S. N., O’Brien, D. P., & Mandell, A. M. 2011, Nature, 475, 206 [Google Scholar]
- Wong, I., & Brown, M. E. 2017, AJ, 153, 145 [Google Scholar]
- Wong, I., Brown, M. E., Emery, J. P., et al. 2024, PSJ, 5, 87 [Google Scholar]
- Wooden, D. H. 2002, Earth Moon Planets, 89, 247 [Google Scholar]
- Wooden, D. H., Butner, H. M., Harker, D. E., & Woodward, C. E. 2000, Icarus, 143, 126 [Google Scholar]
- Wooden, D. H., Ishii, H. A., & Zolensky, M. E. 2017, Phil. Trans. R. Soc. London Ser. A, 375, 20160260 [Google Scholar]
- Wozniakiewicz, P. J., Bradley, J. P., Ishii, H. A., et al. 2012, ApJ, 760, L23 [Google Scholar]
- Wozniakiewicz, P. J., Bradley, J. P., Ishii, H. A., Price, M. C., & Brownlee, D. E. 2013, ApJ, 779, 164 [NASA ADS] [CrossRef] [Google Scholar]
All Tables
All Figures
|
Fig. 1 Orbital properties of our targets. The perihelion distance and the semimajor axis are given as a function of inclination. The dynamical class (centaur vs. SDO) is also highlighted next to each target name (see Appendix A.1 for discussion). |
| In the text | |
|
Fig. 2 Spectral energy distributions of our six targets and of GTO target 2013 XZ8 (LRS: blue; MRS: black) along with the best-fit thermal models (gray). |
| In the text | |
|
Fig. 3 JWST/MRS emissivity spectra of our Cycle 2 targets and GTO target 2013 XZ8, generated by dividing the measured spectral energy distribution by the best-fit NEATM for each object. |
| In the text | |
|
Fig. 4 Similarity of the spectral contrast variability between Jupiter trojans and centaurs/TNOs. The position of the emissivity features is also remarkably similar (see Figure 7). The Jupiter trojan spectra were retrieved from Martin & Emery (2023), and a slope correction was applied to match that of our targets. |
| In the text | |
|
Fig. 5 Overview of the currently available spectral data spanning the MIRI spectral range for P- and D-type MBAs, Jupiter trojans, centaurs/TNOs, and comets. Our centaur observations provide a direct link between Kuiper belt objects and primitive populations of the inner Solar System as predicted by Solar System formation models. The IDP spectrum was retrieved from Brunetto et al. (2011), the Jupiter trojan spectra from Martin & Emery (2023), the main belt spectra from Marchis et al. (2012), and the comet coma spectra from Crovisier et al. (1997); Lisse et al. (2007); Kelley et al. (2017). |
| In the text | |
|
Fig. 6 Identification of emissivity features and positions in the spectrum of 2013 LU28 and comparison with amorphous and crystalline olivine and pyroxene (enstatite) emissivity spectra. The synthetic emissivity spectra of silicates were computed following the procedure described by Vernazza et al. (2015); Marsset et al. (2016) and using the optical constants of Koike et al. (2006) for crystalline olivine, those of Rucks et al. (2022) for crystalline pyroxene (enstatite), and those of Dorschner et al. (1995) for amorphous olivine and pyroxene. |
| In the text | |
|
Fig. 7 Intensity of the crystalline olivine and pyroxene (enstatite) emissivity features (Table 4) for centaurs (blue) and Jupiter trojans (red). We did not analyze the ~11.2 μm feature because credible data at shorter wavelengths for an accurate estimation of its strength are lacking (this pertains to our targets, not to Jupiter trojans). The wavelength positions of enstatite and olivine as a function of Mg number were retrieved from (Koike et al. 2003; Bowey et al. 2007; Hofmeister & Pitman 2007; Kelley & Wooden 2009; Hamilton 2010; Bowey et al. 2020). The position of the ~13.7 μm (enstatite) feature does not vary significantly with composition. Hence, the composition of crystalline olivine and crystalline pyroxene is best determined from the remaining peaks. We cannot rule out the possibility that the position of the ~11.9 μm olivine feature in the Jupiter trojan spectra is partially biased by insufficient correction for the well-known ~12.2 μm MRS spectral leak. |
| In the text | |
|
Fig. 8 Comparison of the intensity of the ~16.3 μm and ~24 μm crystalline olivine emissivity features after removing the continuum from the spectra of 1999 OX3 (red, cliff type; Pinilla-Alonso et al. 2025), 2013 LU28 (less red, bowl type; Pinilla-Alonso et al. 2025), and the comae of comet Hale-Bopp (Crovisier et al. 1997; Kelley et al. 2017). For 1999 OX3 and 2013 LU28, we applied a Savitzky-Golay smoothing algorithm with a 0.3 μm window. In the case of 1999 OX3, we did not consider data between 23.7 and 24 μm because the noise is strong in this wavelength region. |
| In the text | |
|
Fig. A.1 JWST/LRS emissivity spectra of our Cycle 2 targets, generated by dividing the measured spectral energy distribution by the best-fit NEATM for each object. |
| In the text | |
|
Fig. A.2 Sample of Jupiter Trojans emissivity spectra collected with Spitzer (Martin & Emery 2023) and JWST (Brown et al. 2021). The peak positions of the JWST spectra are reported in Table 4. |
| In the text | |
|
Fig. A.3 Illustration of the calculation of the spectral contrast on the average spectrum of red (D-type) Jupiter Trojans (Martin & Emery 2023). Top: Removal of a linear continuum that is tangent to the maxima before (11.2 μm) and after (18 μm) the band. Bottom: The depth of the band was computed after the continuum removal using a polynomial fit (blue) to determine the minimum in emissivity. The contrast is illustrated by the arrow (black). |
| In the text | |
|
Fig. A.4 Comparison of the emissivity spectrum of 2013 LU28 with that of the Tagish Lake meteorite. Aqueously altered matrix-rich carbonaceous chondrites such as Tagish Lake and Orgueil (e.g. Sandford 1984; Vernazza et al. 2012; Beck et al. 2014; Izawa et al. 2021) exhibit prominent emissivity features centred at ~10 μm and ~22 μm similar to those observed in aqueously altered chondritic smooth IDP spectra (Sandford & Walker 1985). However, these features are very different from those observed in primitive bodies, as shown in this figure. |
| In the text | |
Current usage metrics show cumulative count of Article Views (full-text article views including HTML views, PDF and ePub downloads, according to the available data) and Abstracts Views on Vision4Press platform.
Data correspond to usage on the plateform after 2015. The current usage metrics is available 48-96 hours after online publication and is updated daily on week days.
Initial download of the metrics may take a while.