Fig. A.3
Download original image
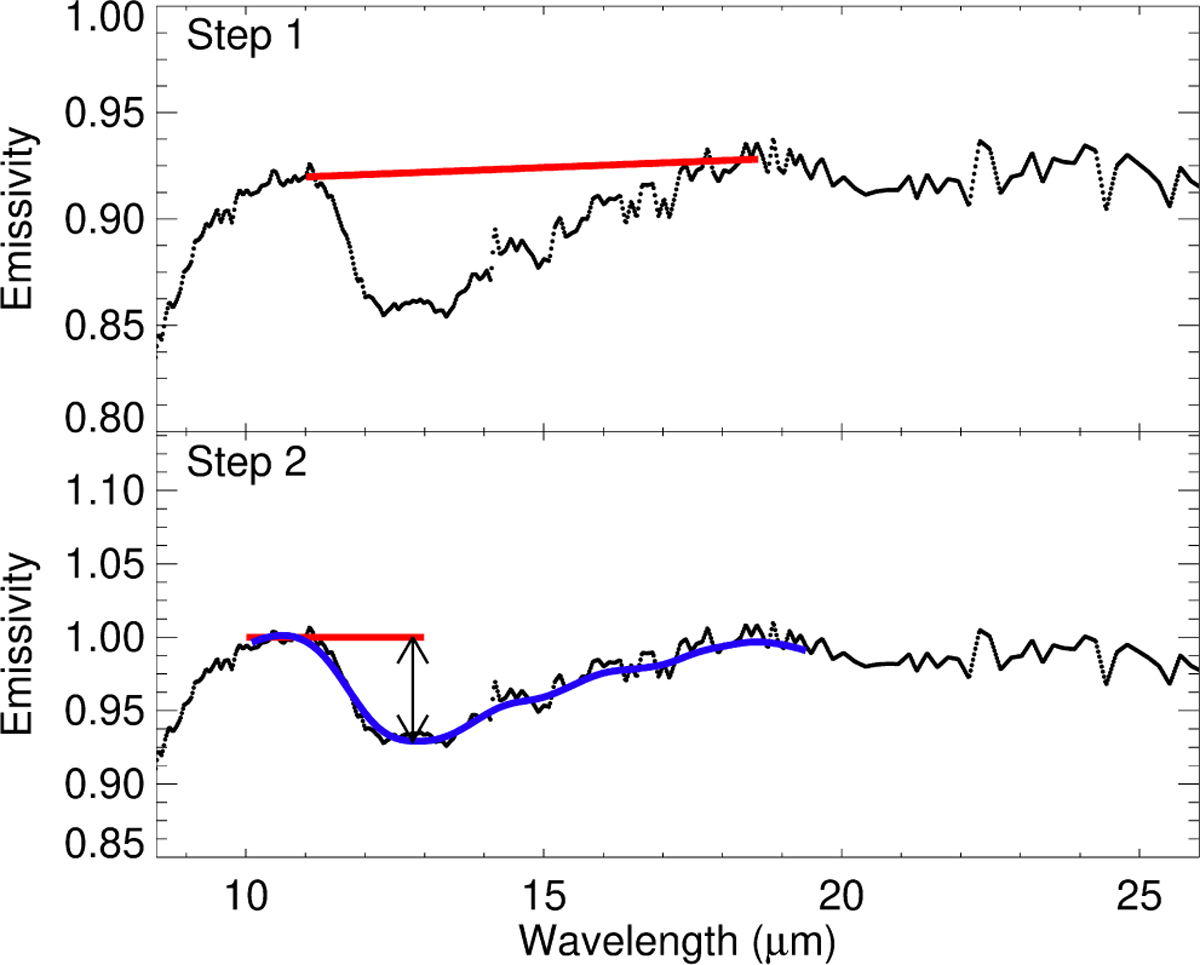
Illustration of the calculation of the spectral contrast on the average spectrum of red (D-type) Jupiter Trojans (Martin & Emery 2023). Top: Removal of a linear continuum that is tangent to the maxima before (11.2 μm) and after (18 μm) the band. Bottom: The depth of the band was computed after the continuum removal using a polynomial fit (blue) to determine the minimum in emissivity. The contrast is illustrated by the arrow (black).
Current usage metrics show cumulative count of Article Views (full-text article views including HTML views, PDF and ePub downloads, according to the available data) and Abstracts Views on Vision4Press platform.
Data correspond to usage on the plateform after 2015. The current usage metrics is available 48-96 hours after online publication and is updated daily on week days.
Initial download of the metrics may take a while.