Fig. 3
Download original image
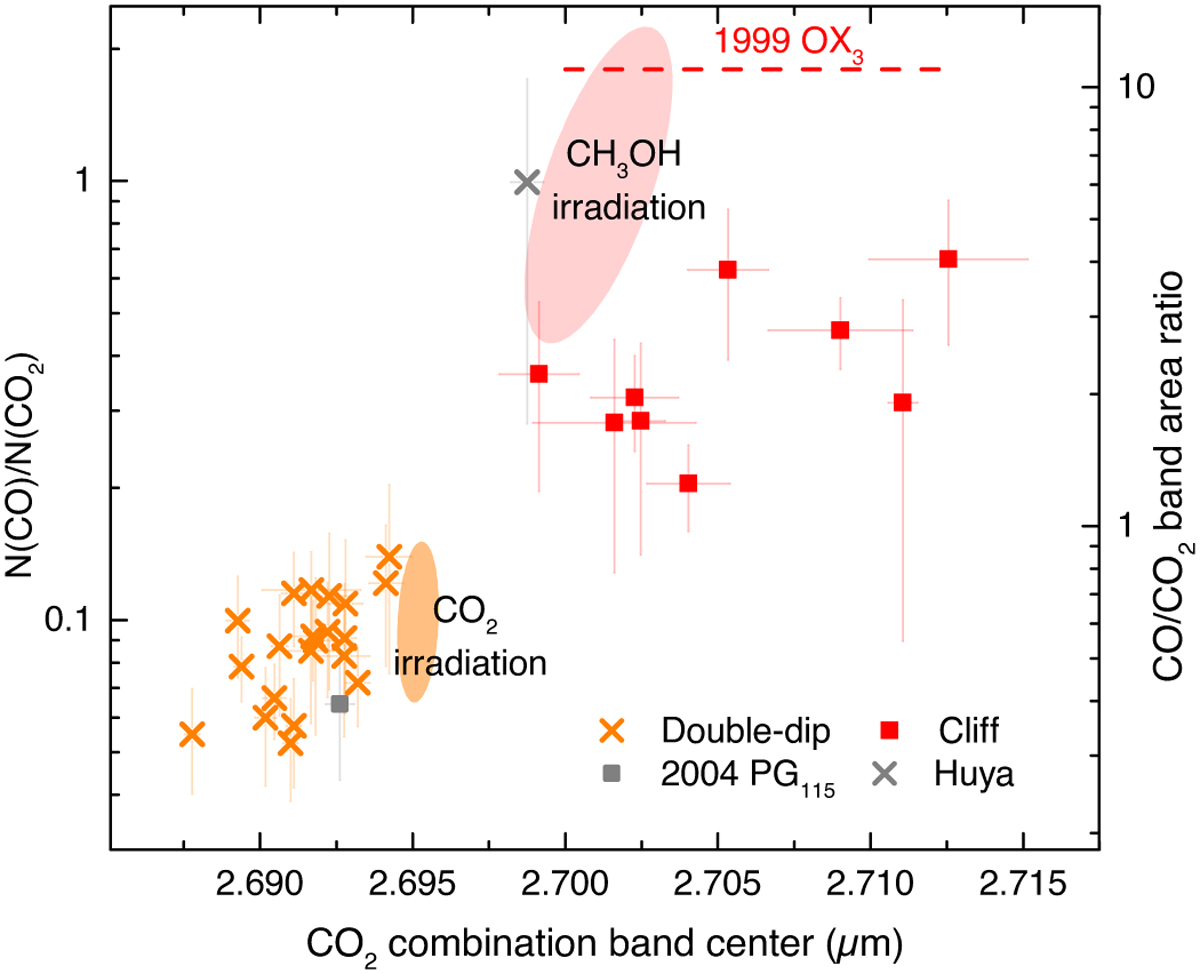
N(CO)/N(CO2) as a function of the position of the centre of the 2.70 µm CO2 band for individual double-dip objects (orange crosses) and cliff objects (red squares). The shadowed regions in the graph represent the range of points we obtained during CO2 irradiation experiments at 45 K (orange) and CH3OH irradiation experiments, pure and mixed with H2O, at 45–60 K (light red). The horizontal dashed red line represents a lower limit for cliff object 1999 OX3 , which lacks the 2.7 µm CO2 band. Huya (grey cross) is clustered as a double-dip, but behaves like a cliff in terms of CO and CO2. Conversely, 2004 PG115 (grey square) is clustered as a cliff, but behaves like a double-dip in terms of CO and CO2.
Current usage metrics show cumulative count of Article Views (full-text article views including HTML views, PDF and ePub downloads, according to the available data) and Abstracts Views on Vision4Press platform.
Data correspond to usage on the plateform after 2015. The current usage metrics is available 48-96 hours after online publication and is updated daily on week days.
Initial download of the metrics may take a while.