| Issue |
A&A
Volume 692, December 2024
|
|
|---|---|---|
| Article Number | L3 | |
| Number of page(s) | 6 | |
| Section | Letters to the Editor | |
| DOI | https://doi.org/10.1051/0004-6361/202451782 | |
| Published online | 02 December 2024 | |
Letter to the Editor
The age of the Methuselah star in the light of stellar evolution models with tailored abundances
1
STAR Institute, Université de Liège, Liège, Belgium
2
Theoretical Astrophysics, Department of Physics and Astronomy, Uppsala University, Box 516 751 20 Uppsala, Sweden
3
Stellar Astrophysics Centre, Department of Physics and Astronomy, Aarhus University 8000 Aarhus C, Denmark
⋆ Corresponding author; This email address is being protected from spambots. You need JavaScript enabled to view it.
Received:
3
August
2024
Accepted:
12
November
2024
Abstract
Context. HD140283, or the Methuselah star, is a well-known reference object in stellar evolution. Its peculiar chemical composition, proximity and absence of reddening makes it an interesting case-study of Pop II stars. Thanks to recent observational efforts, we now have precise interferometric and spectroscopic constraints, as well as revised astrometric parallaxes from the Gaia mission.
Aims. We determine the age of HD140283 with these latest constraints, and we quantify the impact of systematics from physical inaccuracies on the stellar evolution models.
Methods. Using recent spectroscopic abundances from the literature, including 3D non-local thermal equilibrium values for C, O, and Fe, we computed opacity tables specific to HD140283. We then used them in grids of stellar evolution models coupled to a Markov chain Monte Carlo tool to determine the age of HD140283.
Results. With our tailored models we found an age of 12.3 Gy. When we instead used a solar-scaled mixture, we found an age value of 14 Gy, which contradicts theories about the age of the Universe (13.77 ± 0.06 Gy). We also found that a reduction of the mixing-length parameter from its solar calibrated value leads to an even younger age, and this agrees with other recent studies. However, we found no direct evidence that would favour a lower value of the mixing-length parameter based on our modelling.
Conclusions. It is crucial to take the specific elemental abundances into account to model HD140283 because this leads to significant differences in the inferred age. However, this effect is degenerate with a decreasing mixing-length parameter. In this respect, asteroseismic constraints might play a key role in accurately deriving the mass of HD140283, and therefore, in strongly constraining its age.
Key words: stars: abundances / stars: fundamental parameters / stars: individual: HD140283 / stars: Population II
© The Authors 2024
 Open Access article, published by EDP Sciences, under the terms of the Creative Commons Attribution License (https://creativecommons.org/licenses/by/4.0), which permits unrestricted use, distribution, and reproduction in any medium, provided the original work is properly cited.
This article is published in open access under the Subscribe to Open model. This email address is being protected from spambots. You need JavaScript enabled to view it. to support open access publication.
1. Introduction
Population II stars are characterized by their low metallicity and are among the oldest objects in the Galaxy. They are typically found in the Galactic halo, globular clusters, and central regions of galaxies. They are key fossils for studying the chemical evolution of our Galaxy and for galactic archaeology, including for indirect studies of primordial stars, the so-called Population III (e.g. Frebel & Norris 2015). The ages of these stars are of fundamental importance in this endeavour (e.g. Xiang & Rix 2022), but it is a major challenge to determine reliable stellar ages because they depend on various physical ingredients in stellar evolution models that are often highly uncertain (Lebreton et al. 2014a, 2014b; Ying et al. 2023).
In this context, the G-type subgiant HD140283, also called the Methuselah star, is an ideal benchmark old metal-poor star because it is bright, lacks any reddening, lies close to us, and has a well-determined chemical surface composition. Numerous studies have carried out stellar evolution modelling of this star, which led to some debate in the community about its age. For example, Bond et al. (2013) and VandenBerg et al. (2014) reported ages of 14.46 ± 0.31 Gy and 14.27 ± 0.38 Gy, respectively, which contradicts theories about the age of the Universe of 13.77 ± 0.06 Gy as determined from precise measurements of the cosmic microwave background (CMB) and accurate estimates of the Hubble constant and baryon acoustic oscillations (Planck Collaboration VI 2020, 2021). More recent work has alleviated this contradiction: Creevey et al. (2015) reported 13.7 ± 0.7 Gy, and Joyce & Chaboyer (2018) found a range between 12.5 and 14.9 Gy.
In a more recent study, Tang & Joyce (2021) further revised the age of HD140283 down to 12.5 ± 0.5 Gy, based on the precise fundamental parameters recently presented by Karovicova et al. (2020). In their study, they stressed the sensitivity of their models to the mixing-length parameter and determined at a calibrated value that is lower by 10–20% than the solar value. However, this study did not discuss the role of the stellar composition on the age inference in detail. According to Bond et al. (2013) and VandenBerg et al. (2014), this has a significant impact on the stellar evolution modelling, in particular, via the O abundance.
To rectify this, we decided to compute tailored models of HD140283 and again investigated the importance of its chemical composition in the light of several spectroscopic abundance analyses that were recently presented in the literature, in combination with the precise fundamental parameters reported by Karovicova et al. (2020). We also studied the impact of non-standard physics, including turbulent diffusion, electronic screening, radiative opacities, and non-solar mixing-length parameters, on the inferred age of HD140283.
We start by presenting our observational constraints in Sect. 2, and we describe the grids of models and the physics they include in Sect. 3. We discuss the impact of various systematics in Sect. 4.
2. Observational constraints
We present the fundamental parameters in Table 1. Most of the constraints come from Karovicova et al. (2020), who provided the radius, effective temperature, surface gravity, and luminosity from interferometric data (via the PAVO1 instrument at the CHARA2 array) combined with photometry, spectroscopy, isochrone fitting and Gaia astrometry. These constraints are fully consistent with those reported by Amarsi et al. (2019).
Observational constraints used in the modelling.
We took individual elemental abundances from spectroscopic studies. The absolute abundance of Fe was taken from Amarsi et al. (2022), who employed three-dimensional (3D) radiation-hydrodynamical models of stellar atmospheres, and also took a spectrum synthesis with departures from local thermodynamic equilibrium (non-LTE) into account. Similarly, the 3D non-LTE abundances of O (the most important element for the modelling of HD140283) and C were taken from Amarsi et al. (2019): For these elements, the reported [X/H] values were adopted (together with their uncertainties), and were converted into the absolute scale using the solar composition of Asplund et al. (2021) (hereafter AAG21), to which we added the uncertainties in quadrature.
Many of the remaining elements were taken from the high-resolution study of Siqueira-Mello et al. (2015). This study adopted 1D hydrostatic model atmospheres, but departures from LTE were taken into account for some elements, namely Na, Mg, Al, K, Ca, Sr, and Ba. These abundances were taken from the values of [X/Fe]adopted reported in their Table 6, with an assumed uncertainty of 0.1 dex. These were converted into an absolute scale using the Fe abundance from Amarsi et al. (2022) and the AAG21 solar composition, and we added the uncertainties in quadrature. The 1D LTE abundance of S was taken from the value of [S/Fe] reported in Nissen et al. (2007), with an uncertainty of 0.05 dex from the line-by-line standard error, and we converted it in a similar way. The abundances of all remaining elements were calculated by scaling the AAG21 solar chemical composition using the Fe abundance from Amarsi et al. (2022), with an enhancement of [α/Fe] = 0.4 for Ne and Ar; the abundances of these remaining elements were assumed to have an uncertainty of 0.2 dex.
Table 1 shows the metal mass fraction for the star of [M/H] = −1.82, which is based on the specific chemical composition of HD140283. This was used in our tailored models. In what follows, when we use solar-scaled abundances from AAG21 in our modelling, we consider [Fe/H] = [M/H] = −2.29 ± 0.14, taken from Karovicova et al. (2020), which is close to the value of [Fe/H] = −2.28 advocated in Amarsi et al. (2022). The solar-scaled composition was determined by adding [M/H] = −2.29 ± 0.14 to the absolute abundances of AAG21, without any α-enhancement. We illustrate in Fig. 1 the abundances we used alongside the solar abundances on the usual logarithmic scale, log(ϵX) = 12 + log(NX/NH), with NX and NH the respective number densities of element X and hydrogen.
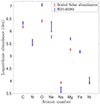 |
Fig. 1. Abundances of the main contributors to the metal mass and opacity for HD140283, based on spectroscopic values from the literature, as well as on a solar-scaled compilation (without an enhancement for α-elements). |
3. Modelling and results
We computed six separate grids of stellar evolution models using the Liège Stellar Evolution code (CLES; Scuflaire et al. 2008), which we coupled with the Stellar Parameters INferred Systematically (SPInS) Markov chain Monte Carlo (MCMC) modelling software (Lebreton & Reese 2020). The grids spanned a mass range between 0.66 M⊙ and 1.02 M⊙, with a step of 0.01, and a metal mass fraction, Z, ranging from 5 × 10⁻⁵ to 0.0018 with a step of 2 × 10⁻⁴. The initial hydrogen abundance was determined by assuming that the initial helium abundance wass the primordial value, which we fixed to 0.251 as in VandenBerg et al. (2014). For all grids, we applied a cut at 3 R⊙ after the model exhausted the hydrogen in its core, based on the available interferometric radius measurement, and we removed the pre-main-sequence evolution because this can be excluded for HD140283. Fig. 2 shows that this does not mean that some of the lower-mass solutions are not already climbing the red giant branch, meaning that the geometry of the grid is quite complex and shows the potential for degeneracies in the inferred solution.
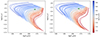 |
Fig. 2. Hertzsprung-Russell diagram of our grids. Left panel: Grid for the solar-scaled mixture with a solar-calibrated mixing-length parameter. Right panel: Grid for the tailored mixture of HD140283 with a solar-calibrated mixing-length parameter. The observational constraints for HD140283 are indicated by the green box. |
The first set of three grids was computed using a solar-scaled mixture from Asplund et al. (2021), together with the OPAL opacities (Iglesias & Rogers 1996) supplemented at low temperature by the Ferguson opacities (Ferguson et al. 2005), and the effects of miscroscopic diffusion (Thoul et al. 1994; Paquette et al. 1986) and turbulence at the base of the convective envelope were taken into account, considering a Vernazza Model C solar atmosphere (Vernazza et al. 1981). The difference between the three grids is the value of the mixing-length parameter, αMLT. One grid used a solar-calibrated mixing-length value based on the classical solar calibration method (see Bahcall et al. 1982) using a standard solar model and three parameters (initial X, Z, and αMLT) calibrated against three constraints (L⊙, (Z/X)⊙, and R⊙) with the same input physics as for the grid. The other two grids applied a correction from the analytical formulae based on averaged 3D simulations from Magic et al. (2015): This correction was based on either the entropy of the adiabat or on the entropy jump between the model and the averaged 3D simulation. This led to a value lower by 6.5% and 9% than the solar-calibrated value, respectively.
The second set of three grids was computed using the tailored abundances of HD140283 (see Sect. 2). We computed dedicated OP3 (Badnell et al. 2005) and low-temperature AESOPUS4 opacities (Marigo & Aringer 2009; Marigo et al. 2022) for this specific composition. We also considered the effects of microscopic diffusion and turbulence at the base of the convective zone for this grid. As before, the only parameter that we varied between the grids is the mixing-length parameter, again using a solar-calibrated value and two different corrected values via Magic et al. (2015) as before. The solar calibration in this case was performed using the AAG21 abundances in the calibration and the same input physics as that of the grid and the same constraints and free parameters as mentioned above. Custom abundances and opacities lead to a higher metallicity than in the solar-scaled case, but they also affect the details of the radiative transfer in the stellar interior (number of available electrons, ion populations, involved transitions, and so on) that will affect the evolution of the star (see Blancard et al. 2012, for detailed illustrations of the contributors to opacity in the solar case).
Turbulent diffusion was noted by VandenBerg et al. (2014) to be necessary to reproduce the final surface abundances of HD140283. A preliminary analysis using CLES models agrees with this and shows that microscopic diffusion is dominated by gravitational settling and quickly leads to a too high depletion of metals at the surface. While we neglected radiative accelerations in our work, it seems that they are unlikely to be sufficient to prevent the settling of metals in this specific case, given that VandenBerg et al. (2014) included them in their work using the detailed treatment of the Montreal-Montpellier code. Therefore, we included the effects of turbulent mixing using the simplified coefficient of Proffitt & Michaud (1991),
 (1)
(1)
with D and n being free parameters to be calibrated. We kept values close to solar values, with D = 1200 and n = 1.3 (Eggenberger et al. 2022). In practice, the need for additional mixing at the base of the convective envelopes was discussed in various contexts (see amongst others Talon et al. 2006; Castro et al. 2007; Vick et al. 2013; Nordlander et al. 2024). In practice, this mixing could be calibrated from the observed lithium depletion. However, given the uncertainty on the initial value for HD140283 between the primordial lithium abundance (Pitrou et al. 2018) and that of the Spite plateau (Spite & Spite 1982), this calibration would not be univocal. We return to the impact of turbulent diffusion in Sect. 4 when we test various turbulence efficiencies.
We illustrate in Fig. 2 our solar-scaled and dedicated abundance grids in the Hertzsprung-Russell diagram, assuming the solar-calibrated mixing-length value with the corresponding physics. The box shows the position of HD140283, and as expected, when we switch from the solar-scaled metallicity to the actual surface abundances, the tracks are significantly shifted because of the higher metallicity that is caused by the high oxygen enrichment, and this also directly impacts the radiative opacity in the stellar interior. Thus, we can already foresee a change in the inferred solution.
The parameters inferred by SPInS for each grid are provided in Table 2. We used L, log g, R, and [M/H] as constraints for the fit, ten walkers on ten temperatures with 3000 burn-in steps and 10 000 iterations in the MCMC procedure.
Optimal parameters inferred from SPInS.
When comparing our results to those of Bond et al. (2013) and VandenBerg et al. (2014), we note that they found an age of 14.46 ± 0.31 Gy and 14.27 ± 0.38 Gy, which contradicts theories about the age of the Universe, while taking into account the non-solar oxygen abundance of HD140283. Our solution differs from theirs in this respect, as we find a more massive solution and a younger age. This can be explained by the difference in the parallax. Here, as in Tang & Joyce (2021), we used the Gaia parallax (via Karovicova et al. 2020). The Gaia Data Release 3 (DR3) parallax is π = 16.26 ± 0.026 mas, which is much lower than both the Hipparcos value and the Hubble Fine Guidance Sensor of π = 17.16 ± 0.68 mas and π = 17.18 ± 0.26 mas. Thus, a lower parallax implies that HD140283 is closer and would thus be more massive, thus younger, than previously thought. Indeed, VandenBerg et al. (2014) found a mass of 0.75 M⊙ while we find a more massive solution closer to that of Tang & Joyce (2021) (who found 0.81 ± 0.05 M⊙) at 0.79 M⊙.
Compared to Tang & Joyce (2021), our results provide a similar solution for the inferred mass and age. However, we do not find evidence that would favour a lower-than-solar value for the mixing-length parameter. All our computed grids are able to reproduce the observational constraints, regardless of the αMLT value, and they display unimodal posterior distributions (see Sect. A). A reduction of the value of αMLT leads to a more massive solution and thus to a younger age for HD140283. For our solar-scaled solution, a further reduction of this parameter would mean that our result agrees with the results of Tang & Joyce (2021). Owing to the degeneracies with chemical composition, we recover their solution with our tailored abundance grid and solar-scaled mixing-length parameter, because reducing αMLT has a similar effect as increasing the metallicity for low-mass stars.
The degeneracy between the mixing-length parameter and the chemical composition underlines the need for additional constraints for this star to determine whether departures from solar-calibrated values of αMLT are needed. In this respect, asteroseismic constraints might play a key role as they would offer strong constraints on the mass of the star, and thus, on the duration of its core H-burning phase.
4. Systematics affecting the inferred age
Tang & Joyce (2021) have investigated the impact of convective overshooting on the inferred age for HD140283 and found that it had no impact on their final results. This is in line with the results of Deheuvels et al. (2010) and Buldgen et al. (2019a) who found that the effects of out-of-equilibrium burning of 3He did not impact the final inferred age in their studies. However, as noted by Tang & Joyce (2021), additional effects such as diffusion in the radiative zone might lead to significant differences in the inferred age.
We supplemented their study by investigating the effect of turbulent diffusion, for which we varied the opacity table and considered the effects of dynamical screening of the electron gas in the core. Both effects lead to various degrees of changes in the thermodynamical conditions in the core, which affects the evolutionary tracks and the duration of the main sequence of HD140283. We plot the various evolutionary tracks for all our test cases in Fig. 3. To test whether these variations had a significant impact on our solution, we used the parameters provided by SPInS and recomputed the evolutionary sequence by varying one physical ingredient at a time. We then determined whether the new model still allowed us to reproduce all observational constraint within 1σ at a given age.
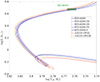 |
Fig. 3. Hertzsprung-Russell diagram of the models with variations in the physical ingredients (diffusion, electronic screening, and opacities) for HD140283. |
The effects of microscopic diffusion were tested by varying the coefficient, D, and exponent, n, of Eq. (1). In Fig. 3, these models are shown as ‘HD140283-Dn’ with n the various exponent value we chose and the reference, noted ‘HD140283’, one being n = 1.3 following prescriptions aiming at reproducing the behaviour of stellar models including angular momentum transport by the magnetic Tayler instability. As mentioned above, various efficiencies have been inferred in the past. By varying the simple parametric formulation used here, we can assess the impact of the efficiency of turbulence on the inferred age. Almost all tracks pass the box of the observational constraints in the Hertzsprung-Russell diagram. We find that the surface chemical composition inferred from spectroscopy and the interferometric radius can be reproduced simultaneously. Therefore, the solution found by SPInS is not strongly affected by the variations we considered. We find very small changes in the age of the model, which are mostly due to a similar efficiency of the turbulent transport coefficients. Despite the variations in the exponent in Eq. (1), this effect as also been described for solar models (e.g. Buldgen et al. 2024, for a recent discussion).
To test the impact of the opacities, models were calculated using OPLIB opacities (Colgan et al. 2016) instead of OPAL for the solar-scaled solution5. They use a different framework to compute the interaction between high-energy radiation and the stellar plasma (see Buldgen et al. 2019b, for a detailed comparison in solar models). Similar to what was found in the previous test for microscopic diffusion, this model reproduced the constraints within 1σ without the need to change its initial mass or chemical composition. The age found using the OPLIB opacities is 13.70 Gy, which is ≈0.4 Gy younger than the age found using OPAL. This means that a change in radiative opacities in the bulk of the radiative region (here a lowering due to the intrinsically lower opacity in high temperatures of OPLIB compared to OP and OPAL) might be a relevant candidate that reduces the age of HD140283.
Finally, we tested the impact of the electronic screening of the nuclear reactions. We simply switched off the screening by assuming, as suggested by Mussack & Däppen (2011) and Mussack (2011), that the overall effect would be similar. As with the two previous tests, this model reproduced all observational constraints within 1σ without the need to change the initial conditions. The main effect was a slight change in the central temperature at the ignition of hydrogen burning that was caused by the lowering of the screening by electrons. The change in the optimal age found is minimal, namely less than 0.05 Gy.
Our results thus show that none of these three effects significantly alters the conclusions of our study and that the main discrepancy in age using our modelling framework is obtained by varying the mass of the star. As discussed in Sect. 3, these variations can be obtained by varying the mixing-length parameter, but we find no evidence that would justify a preference of a given value in our grid-based modelling. Future modelling using recent descriptions of convection might also provide interesting insights into this question (e.g. Jørgensen & Weiss 2019; Manchon et al. 2024), given the key role of HD140283 as a potential testbed for deviations from solar-calibrated values of convective efficiency. It is also likely that allowing the initial helium mass fraction to vary within the existing primordial values would also lead to small changes in the inferred mass and therefore in the age of HD140283.
5. Conclusion
We have carried out a new inference of the age of the so-called oldest star in the Universe, HD140283, also known as the Methuselah star, using individual spectroscopic abundances and custom opacity tables at high and low temperatures taking into account the high oxygen enrichment of the star. We used the SPInS MCMC modelling software coupled with grids of Liège stellar evolution models to study the impact of using a non-solar-calibrated mixing-length parameter value and the fixed analytical corrections from Magic et al. (2015), alongside both a solar-scaled mixture and a tailored mixture from spectroscopic analyses.
We showed that the inferred age changes from ≈14 Gy to ≈13 Gy when the specific elemental abundances are changed. This effect of the composition is degenerate with the effect of the mixing-length parameter: Models with a tailored composition and a solar-calibrated value of αMLT give rise to a similar age for HD140283 as models with a solar-scaled composition and a reduced αMLT, such as those used by Tang & Joyce (2021). Compared to Bond et al. (2013) and VandenBerg et al. (2014), who included the high oxygen abundance of the star, but found an age that contradicts theories of the age of the Universe, we found that our younger solution results from the lower Gaia parallax (that was also used in Tang & Joyce 2021) compared to both Hubble and Hipparcos values used in Bond et al. (2013) and VandenBerg et al. (2014).
We find no clear evidence that would contradicts theories of the age of the Universe when we used using the Gaia astrometric solutions, the CHARA interferometric radius, and tailored spectroscopic abundances. We also investigated the impact of systematics on the models (turbulence, electronic screening, and opacities) and found that they only lead to small variations in the inferred age. Nevertheless, we consider that asteroseismic observations are required to accurately constrain the mass of HD140283 and thus its age. This might indicate a departure from the solar-calibrated mixing-length parameter value. These constraints would allow us to perform a detailed analysis such as that of Huber et al. (2024) to further test our stellar models on some of the oldest objects of the Milky Way. Regarding seismic constraints, we predict significantly different mean density values (thus different large frequency separations) and frequency of the maximum power between the solar-scaled and oxygen-enriched solution, namely 0.1049 g/cm3 and 0.1077 g/cm3 and 495.68 μHz and 510.84 μHz. The availability of asteroseismic data may also allow for detailed comparisons using various evolution codes, as was done both in hare-and-hounds exercises (Reese et al. 2016; Cunha et al. 2021) and in detailed asteroseismic studies of Kepler targets (Silva Aguirre et al. 2017).
Precision Astronomical Visible Observations (PAVO).
Center for High Angular Resolution Astronomy(CHARA).
Opacity Project (OP).
Accurate Equation of State and OPacity Utility Software (AESOPUS).
OPLIB tables for the mixture of HD140283 were not available.
Acknowledgments
G.B. is funded by the Fonds National de la Recherche Scientifique (FNRS). A.M.A. gratefully acknowledges support from the Swedish Research Council (VR 2020-03940) and from the Crafoord Foundation via the Royal Swedish Academy of Sciences (CR 2024-0015). This work was supported by a research grant (42101) from VILLUM FONDEN as well as The Independent Research Fund Denmark’s Inge Lehmann program (grant agreement No. 1131-00014B).
References
- Amarsi, A. M., Nissen, P. E., & Skúladóttir, Á. 2019, A&A, 630, A104 [NASA ADS] [CrossRef] [EDP Sciences] [Google Scholar]
- Amarsi, A. M., Liljegren, S., & Nissen, P. E. 2022, A&A, 668, A68 [NASA ADS] [CrossRef] [EDP Sciences] [Google Scholar]
- Asplund, M., Amarsi, A. M., & Grevesse, N. 2021, A&A, 653, A141 [NASA ADS] [CrossRef] [EDP Sciences] [Google Scholar]
- Badnell, N. R., Bautista, M. A., Butler, K., et al. 2005, MNRAS, 360, 458 [Google Scholar]
- Bahcall, J. N., Huebner, W. F., Lubow, S. H., Parker, P. D., & Ulrich, R. K. 1982, Rev. Mod. Phys., 54, 767 [NASA ADS] [CrossRef] [Google Scholar]
- Blancard, C., Cossé, P., & Faussurier, G. 2012, ApJ, 745, 10 [NASA ADS] [CrossRef] [Google Scholar]
- Bond, H. E., Nelan, E. P., VandenBerg, D. A., Schaefer, G. H., & Harmer, D. 2013, ApJ, 765, L12 [NASA ADS] [CrossRef] [Google Scholar]
- Buldgen, G., Farnir, M., Pezzotti, C., et al. 2019a, A&A, 630, A126 [EDP Sciences] [Google Scholar]
- Buldgen, G., Salmon, S. J. A. J., Noels, A., et al. 2019b, A&A, 621, A33 [NASA ADS] [CrossRef] [EDP Sciences] [Google Scholar]
- Buldgen, G., Noels, A., Scuflaire, R., et al. 2024, A&A, 686, A108 [NASA ADS] [CrossRef] [EDP Sciences] [Google Scholar]
- Castro, M., Vauclair, S., & Richard, O. 2007, A&A, 463, 755 [NASA ADS] [CrossRef] [EDP Sciences] [Google Scholar]
- Colgan, J., Kilcrease, D. P., Magee, N. H., et al. 2016, ApJ, 817, 116 [Google Scholar]
- Creevey, O. L., Thévenin, F., Berio, P., et al. 2015, A&A, 575, A26 [NASA ADS] [CrossRef] [EDP Sciences] [Google Scholar]
- Cunha, M. S., Roxburgh, I. W., Aguirre Børsen-Koch, V., et al. 2021, MNRAS, 508, 5864 [NASA ADS] [CrossRef] [Google Scholar]
- Deheuvels, S., Michel, E., Goupil, M. J., et al. 2010, A&A, 514, A31 [NASA ADS] [CrossRef] [EDP Sciences] [Google Scholar]
- Eggenberger, P., Buldgen, G., Salmon, S. J. A. J., et al. 2022, Nat. Astron., 6, 788 [NASA ADS] [CrossRef] [Google Scholar]
- Ferguson, J. W., Alexander, D. R., Allard, F., et al. 2005, ApJ, 623, 585 [Google Scholar]
- Frebel, A., & Norris, J. E. 2015, ARA&A, 53, 631 [NASA ADS] [CrossRef] [Google Scholar]
- Huber, D., Slumstrup, D., Hon, M., et al. 2024, ApJ, 975, 19 [NASA ADS] [CrossRef] [Google Scholar]
- Iglesias, C. A., & Rogers, F. J. 1996, ApJ, 464, 943 [NASA ADS] [CrossRef] [Google Scholar]
- Jørgensen, A. C. S., & Weiss, A. 2019, MNRAS, 488, 3463 [Google Scholar]
- Joyce, M., & Chaboyer, B. 2018, ApJ, 856, 10 [Google Scholar]
- Karovicova, I., White, T. R., Nordlander, T., et al. 2020, A&A, 640, A25 [NASA ADS] [CrossRef] [EDP Sciences] [Google Scholar]
- Lebreton, Y., & Reese, D. R. 2020, A&A, 642, A88 [NASA ADS] [CrossRef] [EDP Sciences] [Google Scholar]
- Lebreton, Y., Goupil, M. J., & Montalbán, J. 2014a, EAS Publ. Ser., 65, 99 [CrossRef] [EDP Sciences] [Google Scholar]
- Lebreton, Y., Goupil, M. J., & Montalbán, J. 2014b, EAS Publ. Ser., 65, 177 [NASA ADS] [CrossRef] [EDP Sciences] [Google Scholar]
- Magic, Z., Weiss, A., & Asplund, M. 2015, A&A, 573, A89 [NASA ADS] [CrossRef] [EDP Sciences] [Google Scholar]
- Manchon, L., Deal, M., Goupil, M. J., et al. 2024, A&A, 687, A146 [NASA ADS] [CrossRef] [EDP Sciences] [Google Scholar]
- Marigo, P., & Aringer, B. 2009, A&A, 508, 1539 [CrossRef] [EDP Sciences] [Google Scholar]
- Marigo, P., Aringer, B., Girardi, L., & Bressan, A. 2022, ApJ, 940, 129 [NASA ADS] [CrossRef] [Google Scholar]
- Mussack, K. 2011, Ap&SS, 336, 111 [CrossRef] [Google Scholar]
- Mussack, K., & Däppen, W. 2011, ApJ, 729, 96 [Google Scholar]
- Nissen, P. E., Akerman, C., Asplund, M., et al. 2007, A&A, 469, 319 [NASA ADS] [CrossRef] [EDP Sciences] [Google Scholar]
- Nordlander, T., Gruyters, P., Richard, O., & Korn, A. J. 2024, MNRAS, 527, 12120 [Google Scholar]
- Paquette, C., Pelletier, C., Fontaine, G., & Michaud, G. 1986, ApJS, 61, 177 [Google Scholar]
- Pitrou, C., Coc, A., Uzan, J.-P., & Vangioni, E. 2018, Phys. Rep., 754, 1 [Google Scholar]
- Planck Collaboration VI. 2020, A&A, 641, A6 [NASA ADS] [CrossRef] [EDP Sciences] [Google Scholar]
- Planck Collaboration VI. 2021, A&A, 652, C4 [NASA ADS] [CrossRef] [EDP Sciences] [Google Scholar]
- Proffitt, C. R., & Michaud, G. 1991, ApJ, 380, 238 [Google Scholar]
- Reese, D. R., Chaplin, W. J., Davies, G. R., et al. 2016, A&A, 592, A14 [NASA ADS] [CrossRef] [EDP Sciences] [Google Scholar]
- Scuflaire, R., Théado, S., Montalbán, J., et al. 2008, Ap&SS, 316, 83 [Google Scholar]
- Silva Aguirre, V., Lund, M. N., Antia, H. M., et al. 2017, ApJ, 835, 173 [Google Scholar]
- Siqueira-Mello, C., Andrievsky, S. M., Barbuy, B., et al. 2015, A&A, 584, A86 [NASA ADS] [CrossRef] [EDP Sciences] [Google Scholar]
- Spite, F., & Spite, M. 1982, A&A, 115, 357 [NASA ADS] [Google Scholar]
- Talon, S., Richard, O., & Michaud, G. 2006, ApJ, 645, 634 [Google Scholar]
- Tang, J., & Joyce, M. 2021, RNAAS, 5, 117 [NASA ADS] [Google Scholar]
- Thoul, A. A., Bahcall, J. N., & Loeb, A. 1994, ApJ, 421, 828 [Google Scholar]
- VandenBerg, D. A., Bond, H. E., Nelan, E. P., et al. 2014, ApJ, 792, 110 [NASA ADS] [CrossRef] [Google Scholar]
- Vernazza, J. E., Avrett, E. H., & Loeser, R. 1981, ApJS, 45, 635 [Google Scholar]
- Vick, M., Michaud, G., Richer, J., & Richard, O. 2013, A&A, 552, A131 [NASA ADS] [CrossRef] [EDP Sciences] [Google Scholar]
- Xiang, M., & Rix, H.-W. 2022, Nature, 603, 599 [NASA ADS] [CrossRef] [Google Scholar]
- Ying, J. M., Chaboyer, B., Boudreaux, E. M., et al. 2023, AJ, 166, 18 [NASA ADS] [CrossRef] [Google Scholar]
Appendix A: Posterior distributions for the MCMC runs
Posterior distributions for the SPInS runs using both the solar scaled abundances, in Fig. A.2 and Fig. A.1 the detailed spectroscopic abundances of HD140283 for a solar-scaled mixing-length parameter.
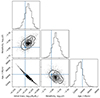 |
Fig. A.1. Posterior distributions from the SPInS runs for the logarithm of the mass, the age and the initial metal mass fraction using a solar-calibrated mixing-length parameter and the detailed element abundances. |
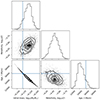 |
Fig. A.2. Posterior distributions from the SPInS runs for the logarithm of the mass, the age and the initial metal mass fraction using a solar-calibrated mixing-length parameter and the a solar-scaled mixture. |
All Tables
All Figures
|
Fig. 1. Abundances of the main contributors to the metal mass and opacity for HD140283, based on spectroscopic values from the literature, as well as on a solar-scaled compilation (without an enhancement for α-elements). |
| In the text | |
|
Fig. 2. Hertzsprung-Russell diagram of our grids. Left panel: Grid for the solar-scaled mixture with a solar-calibrated mixing-length parameter. Right panel: Grid for the tailored mixture of HD140283 with a solar-calibrated mixing-length parameter. The observational constraints for HD140283 are indicated by the green box. |
| In the text | |
|
Fig. 3. Hertzsprung-Russell diagram of the models with variations in the physical ingredients (diffusion, electronic screening, and opacities) for HD140283. |
| In the text | |
|
Fig. A.1. Posterior distributions from the SPInS runs for the logarithm of the mass, the age and the initial metal mass fraction using a solar-calibrated mixing-length parameter and the detailed element abundances. |
| In the text | |
|
Fig. A.2. Posterior distributions from the SPInS runs for the logarithm of the mass, the age and the initial metal mass fraction using a solar-calibrated mixing-length parameter and the a solar-scaled mixture. |
| In the text | |
Current usage metrics show cumulative count of Article Views (full-text article views including HTML views, PDF and ePub downloads, according to the available data) and Abstracts Views on Vision4Press platform.
Data correspond to usage on the plateform after 2015. The current usage metrics is available 48-96 hours after online publication and is updated daily on week days.
Initial download of the metrics may take a while.