| Issue |
A&A
Volume 690, October 2024
|
|
|---|---|---|
| Article Number | A275 | |
| Number of page(s) | 32 | |
| Section | Interstellar and circumstellar matter | |
| DOI | https://doi.org/10.1051/0004-6361/202450841 | |
| Published online | 17 October 2024 | |
Extended correlations between diffuse interstellar bands
Sorbonne Université, UPMC Université Paris 6 and CNRS,
UMR 7095, Institut d’Astrophysique de Paris,
France
★ Corresponding author; This email address is being protected from spambots. You need JavaScript enabled to view it.
Received:
23
May
2024
Accepted:
4
August
2024
Abstract
The systematic analysis of the correlations between diffuse interstellar bands (DIBs) is extended to weak DIBs through the comprehensive catalogue of the Apache Peak Observatory (APO) of 559 DIBs in 25 lines of sight with diverse interstellar properties. The main results are the following: 1) An extension of the number of DIBs identified to be related to C2, that is, those that need very shielded interstellar regions for their carriers to survive UV photo-dissociation. Based on the correlations with the reference C2 and ζ DIBs, anticorrelations with UV-favoured (σ) DIBs, and the strength ratios in shielded and unshielded sight lines, we propose 12 new C2 candidates and 34 possible “C2-related” DIBs (mostly at λ <5950 Å) in addition to the ~20 known confirmed C2 DIBs. With these additions, the census of C2 DIBs might approach completion. 2) We discovered that the intensities of a large set of poorly studied DIBs are strongly enhanced in one or two of the sight lines of HD 175156 and HD 148579. This tentative class, denoted χ for the time being, extends over the whole wavelength range of visible DIBs. It might include up to 50–100 members, half at λ > 6000 Å, and a number of C2 DIBs. These possible enhancements might reflect specific formation processes of their carriers that are yet to be identified in the interstellar medium of these two sight lines. The possible matches of the wavelength of five very broad DIBs, including three χ DIBs, with the strong bands that were recently measured by action spectroscopy might favour some long carbon chains and rings as carriers of some DIBs. These correlations and findings justify further theoretical and laboratory efforts for improving our understanding of the complex physics, spectroscopy, and chemistry of the various carbon chains and rings, and their possible formation and destruction in the diffuse interstellar medium.
Key words: astrochemistry / molecular processes / dust, extinction / ISM: lines and bands / ISM: molecules
© The Authors 2024
 Open Access article, published by EDP Sciences, under the terms of the Creative Commons Attribution License (https://creativecommons.org/licenses/by/4.0), which permits unrestricted use, distribution, and reproduction in any medium, provided the original work is properly cited.
This article is published in open access under the Subscribe to Open model. This email address is being protected from spambots. You need JavaScript enabled to view it. to support open access publication.
1 Introduction
Diffuse interstellar bands (DIBs), which are hundreds of unidentified broad absorption lines that are observed in interstellar lines of sight, have been discovered a century ago by Mary Lea Heger (Heger 1922a,b). After confirmation that they universally form in the diffuse interstellar medium (ISM), the search for their origin is almost as old (Merrill 1934, 1936; Merrill & Wilson 1938). During this long time (McCall & Griffin 2013; McCabe 2019), a vast diversity of carriers have been proposed. Many of them were discarded, such as impurities in interstellar dust grains (see e.g. Herbig 1975, 1995; Smith et al. 1977; Tielens & Snow 1995; Cami et al. 1997; Sarre 2006; Snow & McCall 2006; Cami & Cox 2014 for reviews about DIBs. See also e.g. Fan et al. 2017, 2019; Cami et al. 2018; Cox et al. 2017; York 2024 for more recent references).
A very small part of this mystery has been solved with the confirmation that five near-infrared DIBs are carried by the fullerene cation ![Mathematical equation: $\[\mathrm{C}_{60}^{+}\]$](/articles/aa/full_html/2024/10/aa50841-24/aa50841-24-eq1.png) (Foing & Ehrenfreund 1994, 1997; Fulara et al. 1993; Campbell et al. 2015; Campbell & Maier 2017; Cordiner et al. 2019; Linnartz et al. 2020). However, the nature of the carriers of the immense majority of the more than 600 known visible and near-infrared DIBs (Fan et al. 2019; Ebenbichler et al. 2022; Hamano et al. 2022) is still unknown.
(Foing & Ehrenfreund 1994, 1997; Fulara et al. 1993; Campbell et al. 2015; Campbell & Maier 2017; Cordiner et al. 2019; Linnartz et al. 2020). However, the nature of the carriers of the immense majority of the more than 600 known visible and near-infrared DIBs (Fan et al. 2019; Ebenbichler et al. 2022; Hamano et al. 2022) is still unknown.
In addition to fullerenes, it is generally agreed (see e.g. Cami & Cox 2014) that DIB carriers are probably other large carbon-based molecules (with ~ 10–100 atoms) in the gas phase, such as polycyclic aromatic hydrocarbons (PAHs), long carbon chains, or rings. However, other carriers, such as smaller molecules, are possible (see e.g. Tielens 2014, for the complexity of the problem).
Since their convincing identification (Léger & Puget 1984; Allamandola et al. 1985), relatively large PAHs have remained good DIB carrier candidates (see e.g. van der Zwet & Allamandola 1985; Léger & D’Hendecourt 1985; Crawford et al. 1985; Salama et al. 1996, 2011 and references therein; Salama & Ehrenfreund 2014). From their prominent mid-infrared emission bands in galaxies, it is well established that as a whole, PAHs contain several percent (up to ≳10%) of the total interstellar carbon (e.g. Puget & Léger 1989; Tielens 2008, 2013; Draine & Li 2007; Shivaei et al. 2024). To date, however, all attempts to identify a single interstellar PAH as DIB carrier have failed, while a few small PAHs have been identified in dense clouds (McGuire et al. 2021; McGuire 2022; Burkhardt et al. 2021; Cernicharo et al. 2021; Sita et al. 2022). Nevertheless, PAHs may remain important DIB carriers if their distribution is dominated by a small number of species, especially in the form of cations. It is generally thought that the most abundant PAHs are the most compact (pericondensed), such as circumcoronene C54H18. They are often called grand PAHs (e.g. Tielens 2013; Andrews et al. 2015). Their importance seems to have been confirmed by the first JWST1 observations of the Orion Bar (Chown et al. 2024), for example. However, these large PAHs remain difficult to produce and study in the laboratory.
After the confirmation of the five DIBs carried by ![Mathematical equation: $\[\mathrm{C}_{60}^{+}\]$](/articles/aa/full_html/2024/10/aa50841-24/aa50841-24-eq2.png) , a variety of DIBs carried by fullerene compounds may be possible (e.g. Omont 2016), including pure fullerene cages (Candian et al. 2019; Omont & Bettinger 2021), hydrogenated fullerenes (fulleranes; e.g. Zhang et al. 2020), other exohedral or endohedral hetero-atom compounds, such as exohedral FeC60, in various charge states. However, the overall abundance of fullerenes is relatively low, as found for
, a variety of DIBs carried by fullerene compounds may be possible (e.g. Omont 2016), including pure fullerene cages (Candian et al. 2019; Omont & Bettinger 2021), hydrogenated fullerenes (fulleranes; e.g. Zhang et al. 2020), other exohedral or endohedral hetero-atom compounds, such as exohedral FeC60, in various charge states. However, the overall abundance of fullerenes is relatively low, as found for ![Mathematical equation: $\[\mathrm{C}_{60}^{+}\]$](/articles/aa/full_html/2024/10/aa50841-24/aa50841-24-eq3.png) (a few 10−4 of the total interstellar carbon), pure fullerenes have no strong bands in the visible, and the abundance of possible hetero-fullerenes is unknown.
(a few 10−4 of the total interstellar carbon), pure fullerenes have no strong bands in the visible, and the abundance of possible hetero-fullerenes is unknown.
Carbon chains, with n ≲ 10, a polyyne or cumulenic Cn skeleton, and possible hetero atoms, H, N, O, and so on, have been observed since the early 1970s in dense molecular clouds (see e.g. the review by Taniguchi et al. 2024). They have repeatedly been proposed as DIB carriers (see e.g. Douglas 1977; Thaddeus 1995; Snow 1995a,b; Allamandola et al. 1999; Maier et al. 2004; Rice & Maier 2013; Zack & Maier 2014a,b; Campbell & Maier 2017). Long chains and rings remain good DIB carrier candidates, even though short chains (n≲10) are excluded because their known wavelengths do not correlate with those of DIBs (e.g. Zack & Maier 2014a,b), probably because of their photo-destruction in the diffuse ISM. Their spectra (e.g. Jochnowitz & Maier 2008a,b; Buntine et al. 2022; Marlton et al. 2022, 2023, 2024; Rademacher et al. 2022) generally include a series of very strong broad bands throughout the visible range, for which the wavelength can be roughly proportional to the number n of carbon atoms. This property has made them especially appealing as DIB carrier candidates (e.g. Campbell & Maier 2017, and Section 6).
A key feature of DIBs that provides fundamental clues for the identification of their carriers, is the level of correlation between them in various sight lines. Strong correlations within some DIB subsets that are much higher than with other DIBs allow us to define DIB families. The three most important DIB families are related to the behaviour and the abundance of their carriers in various intensities of the ultraviolet (UV) interstellar radiation. They are σ DIBs, which are strongest in the normal diffuse ISM (with a fraction of molecular hydrogen of fH2 ~ 0.1–0.3; e.g. Vos et al. 2011, Fig. 20); ζ DIBs, which are strong in moderately shielded regions of the diffuse ISM (Krelowski & Walker 1987; see also Herbig 1995); and C2 DIBs (Thorburn et al. 2003), which are stronger in more shielded regions, where the bands of the C2 molecule are generally observed (see Section 4.1).
More detailed correlation studies (Fan et al. 2017; Ensor et al. 2017) have provided further insights into the properties of DIB carriers (see Section 2.1). Using the data of the DIB Atlas of Hobbs et al. (2008, 2009), Omont & Bettinger (2020) analysed the correlation between the DIB wavelength and the apparent UV resilience (or boost) of their carriers. They noted that this property fits linear carriers well, such as carbon chains or polyacenes, whose series of very strong bands have wavelengths that linearly vary with the length of the molecule.
The availability of the Apache Point Observatory Catalog of Optical Diffuse Interstellar Bands (APO Catalog) of 559 DIBs in 25 sight lines with diverse interstellar properties (Fan et al. 2019, 2020; see details in Section 3.1) has given a new dimension to possible correlation studies. The first studies, such as Fan et al. (2022) and Smith et al. (2021), are briefly analysed in Section 2.2, together with other studies, notably with the ESO Diffuse Interstellar Bands Large Exploration Survey (EDIBLES; Cox et al. 2017; Cami et al. 2018).
The aim of the present paper is to further explore the richness of the APO Catalog for studying DIB correlations, with a particular focus on unexplored correlations involving weak DIBs. A first goal is to extend the census of C2-like DIBs, and to further study their correlation (or anticorrelation) with longer-wavelength DIBs. Special attention is paid to all clues that may be of interest for confirming the conjecture that the carriers of C2 DIBs or associated DIBs might be long carbon chains or rings. In addition to correlations, a key input for this purpose is the result of laboratory spectroscopy of long chains and rings. This mainly includes breakthrough data reported in the past from matrix spectroscopy by the Basel group (e.g. Jochnowitz & Maier 2008a,b; Zack & Maier 2014a,b) or recently from action spectroscopy by the Melbourne and Edinburgh groups (Buntine et al. 2022; Marlton et al. 2022, 2023, 2024; Rademacher et al. 2022).
The paper is organised as follows: Section 2 summarises the results of previous DIB correlation studies. Section 3 describes the capabilities of the APO Catalog and the method used here to explore weak-DIB correlations. These methods are applied in Section 4 to propose an extension of the C2 family based on correlations with reference C2 and ζ DIBs, strength ratios in shielded and unshielded sight lines, and anticorrelations with σ DIBs, which confirms that the new members are also confined to a short wavelength, λ ≲ 5900 Å. By checking the correlations of the extended C2 family, we found that a large fraction of its members are significantly correlated with a large set of longer-wavelength DIBs. Section 5 is devoted to the analysis of this set of poorly studied DIBs, which are enhanced in two peculiar lines of sight. We debate without a firm conclusion whether their correlation might allow us to tentatively define a new family of DIBs. Section 6 summarises various possible indications that carbon chains and rings are DIB carriers, including five coincidences between wavelengths and widths of very broad strong DIBs and the strong bands of two carbon chains and one ring that were recently reported from action spectroscopy. Finally, Section 7 summarises the main findings of this study.
Following Fan et al. (2019), the APO DIBs are generally denoted by their abbreviated wavelength in Å (except when quoted otherwise). For instance, the DIB at λ = 6613.70 Å is denoted λ6613.
2 Previous correlation studies of diffuse interstellar bands
2.1 Early studies of the main diffuse interstellar bands
The study of the various correlations implying strong DIBs among themselves or with reddening, atomic, or molecular column densities has a long history. It has provided a good part of our current limited knowledge about DIB carriers. As early as 1938, Merrill and Wilson reported a correlation of the strongest DIBs with the sight-line reddening E(B − V). Much later, it was established mainly by Krelowski and coworkers (e.g. (Krelowski & Walker 1987; Krelowski 1989; Krelowski et al. 1992; Fulara & Krełowski 2000; see also Herbig 1995) that most of the strong DIBs may be classified into the two broad σ and ζ families. Still later, the C2 family was identified (Thorburn et al. 2003; Kaźmierczak et al. 2010; Elyajouri et al. 2018; Fan et al. 2024). The practical confinement of C2 DIBs to short wavelengths, λ < 5800 Å, is a striking property (see e.g. the list of the 16 C2 DIBs given by Thorburn et al. 2003, reproduced in Table B.1).
More sophisticated correlations were explored among DIBs that were observed along lines of sight with diverse properties, including a study of the Orion sight lines with extremely strong UV radiation; diverse correlations and anti-correlations between pairs of DIBs and with E(B − V) and column densities of H or H2 (Cami et al. 1997; Friedman et al. 2011; Vos et al. 2011; Kos & Zwitter 2013; Baron et al. 2015); a principal component analysis (Ensor et al. 2017); and a DIB ordering according to their sensitivity to UV destruction (Fan et al. 2017; Elyajouri et al. 2018).
2.2 Correlations of diffuse interstellar bands with comprehensive catalogues
Correlation studies of DIBs have taken on a new dimension since the advent of comprehensive DIB catalogues that include all the DIBs that are detectable in multiple lines of sight. These catalogues have opened the possibility to extend correlation studies to hundreds of weak DIBs. The preliminary APO catalogue of Hobbs et al. (2008, 2009) was limited to two well-chosen lines of sight, HD 204827, with moderate UV radiation, and HD 183143, with relatively strong UV. In addition to the completeness of its list of ~500 DIBs, which is fundamental for their identification, it provides a few parameters for each DIB, that is, the two equivalent widths (EW) and the DIB width (full width at half maximum; FWHM).
The inferred equivalent-width ratio that compares the strength of a DIB along a low-UV (ζ) and a high-UV (σ) line of sight,
![Mathematical equation: $\[\mathrm{R}_{21}=\mathrm{EW}(\mathrm{HD} \text { 204827)/EW(HD 183143), }\]$](/articles/aa/full_html/2024/10/aa50841-24/aa50841-24-eq4.png) (1)
(1)
gives a first view of the DIB sensitivity to UV and thus of the family (σ, ζ, or C2) to which the DIB belongs. It was shown by Omont & Bettinger (2020) that R21, and therefore, the UV resilience or boost of the DIB carrier, are significantly correlated with its wavelength. This may be a good argument for carbon chains as DIB carriers (Section 6) because the wavelength of their strong bands is correlated with their length, and therefore, with their resilience against photo-destruction.
The APO Catalog (Section 3.1) extends the survey of 559 DIBS to 25 sight lines (Table A.1), providing hundreds of detections in each sight line. With sensitive data, whose quality is well characterised, it is a much more powerful tool for detailed studies of DIB correlations. It was previously used for two discussions of the correlations of strong DIBs. Fan et al. (2022) used the correlation (and anticorrelation) of a sample of 54 strong DIBs for revisiting the UV-sensitivity sequence of DIB families and a possible hierarchy of DIB correlations. They introduced a new class of DIBs that are intermediate between the ζ and σ families. This class is denoted ζσ hereafter. The degree of correlation among all these ζ, ζσ, and σ DIBs is so high that they might belong to a single type of carriers, independently of the charge state. Smith et al. (2021) reviewed the case of DIB pairs presenting the highest degree of correlation. They identified a few groups of highly correlated DIBs, some of which might have the same carriers.
The new large DIB survey EDIBLES (Cox et al. 2017; Cami et al. 2018) offers similar or better capabilities on a larger number of sight lines, including a few APO sight lines. However, its publication is at an earlier stage of availability. Its data were used for a thorough study of the profiles of C2 DIBs (Elyajouri et al. 2018), confirming the homogeneity of this DIB family. EDIBLES data have already provided key extensions of DIB correlations: Smoker et al. (2023) have extended them to near-infrared DIBs (Joblin et al. 1990; Geballe et al. 2011; Cami & Cox 2014; Hamano et al. 2022; Ebenbichler et al. 2022; Castellanos et al. 2024). Their conclusions showed that most prominent near-infrared DIBs are better correlated with visible σ DIBs than with ζ DIBs. Ebenbichler et al. (2024) have extended the correlations to DIB profiles and showed tight correlations within eight DIB families. Fan et al. (2024) reported a deeper insight into the correlations of C2 DIBs with the C2 and C3 molecules. They showed that the relative enhancement of C2 DIBs with respect to non-C2 DIBs in denser regions of the ISM might result in good part from the weakening of non-C2 DIBs there. It is clear that much more is expected to come from EDIBLES data when complete correlation studies implying weak visible and infrared DIBs are performed.
3 APO catalogue, and our method
3.1 APO catalogue
The APO Catalog (Fan et al. 2019, 20202) is the main product of the DIB survey project that was carried out since 1999 with the 3.5 telescope and the ARC echelle spectrograph (ARCES) at the Apache Point Observatory. It provides the properties (wavelength, width, and equivalent width with the uncertainty) of 559 DIBs from 4259 Å to 8763 Å in 25 lines of sight of nearby O and B stars (Table A.1). These sight lines were chosen with diverse interstellar properties from very low reddening and very strong UV to high-reddening regions that are well shielded from the UV. The catalogue is restricted to DIBs that were detected in at least 5 of the 25 sight lines. It is an extension of the DIB Atlas in the two sight lines of HD 204827 and HD 183143, which was published by Hobbs et al. (2008, 2009). The data of these two sight lines were examined again and are included in the new APO catalogue. The catalogue also includes 11 DIBs with a very broad width published by Sonnentrucker et al. (2018). However, relatively few new DIBs were found with respect to the 545 DIBs that were identified in the two previous papers (Hobbs et al. 2008, 2009).
The catalogue is available online at the Centre de Données de Strasbourg (CDS)2. Fan et al. (2019, 2020) provided all the details of the observations, the sight-line properties (summarised in Table A.1), and data analysis. They listed the DIB equivalent widths, FWHM widths, 3σ detection sensitivity (typical EW ~ 1.5–3 mÅ), and so on. and statistics.
The APO Catalog was recently used for the analysis of correlations among strong DIBs (Fan et al. 2022; Smith et al. 2021, 2022). Its data quality and the large number of sight lines in which these DIBs are detected allow the identification of correlations with large Pearson coefficients. In some cases, these correlation coefficients may even approach unity for relatively strong members of the σ and ζ DIB families. As quoted by Smith et al. (2021), for example, this might open the search for DIBs that are carried by the same molecule.
3.2 Method for weak-DIB correlation studies
It is obvious that extending the correlation studies to weak DIBs may bring much information about DIBs and their carriers, especially by extending the membership of classical DIB families or identifying new families or subfamilies. However, it is well known that an accurate estimate of weak DIBs and even their detection are difficult because they are plagued by stellar lines, DIB blending and crowding, uncertain continuum placement, and so on. Despite the care brought to DIB extraction by the APO group, the quality of the data cannot be homogeneous for the weakest DIBs. In addition, their correlations are weakened by the low signal-to-noise ratio, which is often close to the limit of S/N = 3, and mainly by the limited number of sight lines in which both weak DIBs are detected. Therefore, a rigorous extension of correlation studies to weak DIBs is difficult. Nevertheless, it is clear that these correlations including weak DIBs of the APO Catalog contain an enormous amount of information that is expected to help us make progress in the identification of DIB carriers. However, the huge number of possible correlations among 500 DIBs makes it imperative to adopt a simplified approach to explore the problem.
Therefore, as a first step and despite the drawbacks, we adopted the most straightforward method for studying the correlations implying weak DIBs of the APO Catalog, as listed below.
– A systematic use of the plain Pearson correlation coefficients between the equivalent widths of DIBs, calculated without taking their estimated uncertainties into account.
– Following Fan et al. (2022), for example, two sets of Pearson coefficients were used for the correlation between the DIBs i and j. The regular Pearson coefficients, between their equivalent widths, EWi and EWj, denoted q(ij) here, are well adapted for highly correlated strong DIBs (e.g. Smith et al. 2021). The equivalent width normalised to reddening,
![Mathematical equation: $\[\mathrm{EN}_i=\mathrm{EW}_i / E(\mathrm{~B}-\mathrm{V}),\]$](/articles/aa/full_html/2024/10/aa50841-24/aa50841-24-eq5.png) (2)
(2)
gives greater weight to weak DIBs. The corresponding normalised Pearson coefficients, denoted kn(ij), are better adapted to weak DIBs and to anticorrelations, as shown by Fan et al. (2022). However, the uncertainties on E(B − V) estimates for the sample sight lines also affect the accuracy of the correlation calculations. The large differences between kn(ij) and q(ij) are shown in Fig. C.7. In some cases (Section 4 and Appendix B), the mean of kn(ij) and q(ij),
![Mathematical equation: $\[\mathrm{knq}(i j)=[\mathrm{kn}(i j)+\mathrm{q}(i j)] / 2,\]$](/articles/aa/full_html/2024/10/aa50841-24/aa50841-24-eq6.png) (3)
(3)
is used for DIBs of intermediate strength, such as C2 DIBs.
– In deriving q(ij) or kn(ij) values, if possible, all sight lines were used in which both DIBs i and j are detected, although these coefficients depend on the set of sight lines that is used. This maximised the limited number of sight lines n(ij) where the two members of a pair of weak DIBs are both detected; nevertheless, n(ij) is often close to 7 (out of 25), or even lower. Correlations are hardly meaningful when n(ij) ≤ 5. However, as described in Section 5, it was discovered that the members of a peculiar set of DIBs have a peculiar behaviour in two sight lines, HD 175156 and HD 148579. Keeping these lines of sight in the calculation of correlation coefficients may strongly distort their values (see examples in Appendix C.1, Fig. C.4). Therefore, it may be better to discard these sight lines when calculating correlations implying these DIBs, that is, considering only those of the other 23 sight lines in which the two DIBs are detected. On the other hand, HD 175156 and HD 148579 were kept to study special correlations that imply these DIBs that are enhanced there (Section 5 and Appendix C).
– No use was made of the provided APO upper limits for undetected DIBs. The caveat for contamination (DIBs quoted as (c) in the APO Catalog) was generally not taken into account in order to maximise the number of sight lines in which weak DIBs are detected.
– The degree to which Pearson coefficients may be considered significant depends on the number of sight lines n(ij) in which the two DIBs are both detected, on the nature of the coefficient, q or kn, and on the context. A value q ~ 0.8 may mean a moderate correlation between strong DIBs with a high S/N ratio, especially for DIBs that are highly correlated with reddening (Friedman et al. 2011), while even kn ~ 0.8 means a high correlation for strong DIBs and a fortiori for weak DIBs, because of the uncertainties on E(B − V). Roughly speaking, as confirmed, e.g. by the analysis of correlations implying reference C2-DIBs (Section 4.1), values of kn down to ~0.6 and even ~0.5, may reflect significant correlations, for instance for DIBs with a low correlation with reddening; values of q or kn in the range −0.2 to +0.4 mean a poor or no correlation, with little graduation for various values in this range; kn ≲ −0.4, and even −0.3, generally reflect a significant anticorrelation.
A difficult case for quantitative DIB correlations was found for the two quoted sight lines, HD 175156 and HD 148579, where the normalised equivalent widths of some DIBs are strongly enhanced compared with other sight lines (Section 5 and Appendix C). The values of coefficients kn for correlations between two of these enhanced DIBs may reach very high formal values, ≳0.9. These high values (Figs. C.3 and C.4) may seem meaningless because the correlation is dominated by a single line of sight and the number of other sight lines in which the two DIBs are detected is very low. However, the mere fact that the two DIBs are simultaneously enhanced may be enough to imply an important actual correlation (see Section 5 and Appendix C.2).
The Topcat tool3 (TOPCAT & STIL: Starlink Table/VOTable Processing Software; Taylor 2005) is well fitted for studying correlations between DIBs of the APO Catalog. It is systematically used in this study.
4 Extension of the C2 diffuse interstellar band family
4.1 Current C2 diffuse interstellar bands
The identification of a new class of DIBs whose carriers seem to survive better in regions that are very well shielded from UV radiation was a key point in the history of DIB studies (Thorburn et al. 2003; see also Kaźmierczak et al. 2010, 2014; Elyajouri et al. 2018; Ebenbichler et al. 2024). They are generally seen in sight lines with substantial absorption by C2 molecules in the interstellar gas, hence the name C2 DIBs. However, the correlation between C2 DIBs and the column density of C2 molecules is loose, and a key property of C2 DIBs is that their intensity does not seem to decrease in dense environments, in contrast to other regular DIBs (Fan et al. 2024, 2017).
The reference sample of C2 DIBs is the commonly used sample that was identified by Thorburn et al. (2003), which is broadly consistent with the samples of Elyajouri et al. (2018) and Fan et al. (2022). It includes 16 DIBs, all at λ < 5800 Å, that are listed in Table B.1. It excludes a few related DIBs that were added to the list by various authors, λλ5245, 5547, 5769.9, 5793, 5828, 5849, 5910 and 6729 (Table B.2). They often display a peculiar behaviour with respect to the other C2 DIBs.
The C2 DIB family seems relatively homogeneous and well defined compared with the σ and ζ families (Fan et al. 2017, 2022; Ensor et al. 2017; Elyajouri et al. 2018). Their band profiles are similar (Elyajouri et al. 2018; Ebenbichler et al. 2024). Their number does not seem to exceed a fraction of ~10% of the currently known DIBs (Fan et al. 2017). Importantly, they are confined to short wavelengths, mostly at λ ≲ 5900 Å (Tables B.1–B.4). In addition, most of them are strongly anticorrelated to prominent σ DIBs, and they display high values for equivalent width ratios in the ζ to σ sight lines (Eq. (1), see below, Figs. 1–3). In the following, the search for new C2 DIBs was therefore performed first. We started by exploring the APO Catalog for all DIBs that are significantly correlated with well-established classical C2 DIBs and share their key properties.
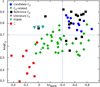 |
Fig. 1 Correlation diagram for candidate C2 DIBs (blue dots, Table B.3) and possible C2-related DIBs (green diamonds, Table B.4) compared to reference C2 DIBs (black squares, Table B.1), candidate C2 DIBs from the literature (grey diamonds, Table B.2), possible DIBs similar to λ5849 (F5849, cyan triangles), and to a comparison sample of ζ DIBs (Fan et al. 2022, red dots). The horizontal axis displays the normalised anticorrelation Pearson coefficient, kn6009, with the σ DIB λ6009 (excluding the sight lines of HD 175156 and HD 148579). The vertical axis displays the average correlation coefficient, knqC2 (Eq. (3)), with a subsample of six reference C2 DIBs (λλ4726, 4963, 4984, 5418, 5512, and 5546). The selection criteria (Eqs. (4,5); dotted blue lines) distinguish C2 DIBs well from ζ DIBs. Most C2 DIBs and related DIBs are significantly anticorrelated with σ DIBs (kn6009 < 0). See Fig. B.1 for an extended version of this figure, including the DIB labels. |
4.2 New C2 diffuse interstellar bands
The main criterion for identifying new C2 DIBs among weak DIBs is their high correlation with the classical C2 DIBs in the reference sample of Thorburn et al. (2003). We assume below that this is well quantified by computing the average Pearson coefficients over the panel of the six C2 DIBs with the best APO data used by Fan et al. (2022, see their Fig. B2), λλ4726, 4963, 4984, 5418, 5512, and 5546, which we call the C2F22 sample below. Because of the anomalous intensities of some DIBs in the sight lines of HD 175156 and HD 148579 (Section 5), it seems more consistent to compute these correlation coefficients without taking these two lines of sight into account.
These average normalised and regular correlation coefficients, knC2 and qC2, are presented in Tables B.1–B.4 for the best C2 DIB candidates, together with their mean, knqC2 (Eq. (3)). The latter seems best suited for the range of intensities of C2-like DIBs, from strong reference C2 DIBs to the weakest C2 DIB candidates. Most of the reference C2 DIBs appear to be highly correlated with the C2F22 sample, with knqC2 ≥ 0.8 for 12 out of 16 of them, including the whole C2F22 sample itself. However, the four others, λλ5003, 5541, 5170, and 4363, are moderately correlated with the reference C2F22 sample, with knqC2 ≲ 0.65.
A well-known property of classical C2 DIBs is their anti-correlation with σ DIBs, which reflects the opposite behaviour of these two classes of DIBs with respect to the UV intensity (e.g. Fan et al. 2022). Tables B.1–B.4 give the normalised correlation coefficient kn6009 of the 16 reference DIBs and candidate C2 DIBs with the most extreme σ DIB, λ6009. Figs. 1 and B.1 display the correlation coefficient kn6009 vs knqC2 for the 16 reference C2 DIBs, the new candidate C2 DIBs, and a comparison sample of ζ DIBs. The vast majority of the reference DIBs (14/16) are strongly anticorrelated with λ6009, with −0.8 < kn6009 < −0.45. Of the two exceptions, the case of λ4726 is known to be peculiar because it is much stronger and broader than all regular C2 DIBs. The case of λ5170 is more surprising (Fig. B.1, Appendix B.2).
Another traditional way of identifying C2 DIBs is based on the DIB ratio, R21, in a shielded sight line, such as HD 204827, to an unshielded sight line, such as HD 183143 (Eq. (1)). Fig. 2 displays the APO value of R21 or its equivalent (Appendix B.3) versus knqC2. A comparison with the reference C2 DIBs (Figs. 2 and B.2) shows that the combination of knqC2 > 0.7 and a ratio R21 > 1.5 clearly indicates a C2 DIB.
To summarise, 14 out of 16 reference C2 DIBs meet the following three conditions:
![Mathematical equation: $\[\mathrm{knq}_{\mathrm{C} 2} \gtrsim 0.70 \text {, }\]$](/articles/aa/full_html/2024/10/aa50841-24/aa50841-24-eq7.png) (4)
(4)
![Mathematical equation: $\[\mathrm{kn}_{6009} \lesssim-0.4 \text {, and }\]$](/articles/aa/full_html/2024/10/aa50841-24/aa50841-24-eq8.png) (5)
(5)
![Mathematical equation: $\[R_{21} \gtrsim 1.5.\]$](/articles/aa/full_html/2024/10/aa50841-24/aa50841-24-eq9.png) (6)
(6)
Figures 1–3 show that these conditions distinguish ζ DIBs well. It seems logical to exploit this specificity of C2 DIBs to identify new C2 DIB candidates. The three conditions of Eqs. (4–6) were used for this purpose in the following way:
– Solid C2 DIB candidates must be significantly correlated with the basic panel of 6 prominent C2 DIBs, C2F22 (Table B.1), as closely as the 16 classical C2 DIBs. Therefore, they must strictly verify Eq. (4). The two other conditions, Eqs. (5,6), are also required, at least approximately. In addition to the 16 reference C2, 12 other DIBs meet these three conditions. They are listed in Table B.3. All of them verify knqC2 > 0.65, kn6009 ≲ −0.46 and R21 ≲ 1.5 (Figs. 1–3).
– These conditions may be relaxed for additional C2-related DIB candidates. For instance, Table B.4 lists 34 DIBs verifying knqC2 > 0.50, kn6009 < 0.05, and R21 ≳ 1.1. Figs. 1–3 show that these DIBs are located between the groups of reference C2 DIBs and reference ζ DIBs from Fan et al. (2022). This intermediate position of the group of possible C2-related DIBs is especially illustrated in the correlation diagram of Fig. 3 that displays R21 versus kn6010 (equivalent to kn6009, Appendix B.3). The extension of this diagram to the whole range, −0.9 < kn6010 < 1.0, shows the whole series of decaying or boosting UV-sensitivity of DIB families from C2 to σ through C2-related, ζ, and ζσ DIBs.
However, the extension of the selection to such a large number of weak DIBs implies that correlations with limited statistical quality are included. An additional criterion was added to mitigate this risk and strengthen the selection of C2-related DIBs. The diagram of the correlation with λ5849 versus λ5797 (Fig. 4) shows that the reference C2 DIBs follow a well-defined sequence very different from the sequence spanned by the ζ, ζσ, and σ main DIBs of Fan et al. (2022) and by other not-C2 DIBs that are strongly correlated with these main DIBs (Table D.1). It was therefore imposed that the candidates of Tables B.3 and B.4 also pertain to the 5849–5797 C2 sequence, in addition to meeting the conditions of Eqs. (4)–(6). Fig. 4 shows that the 12 solid C2 candidates of Table B.3 strictly follow the C2 sequence. An additional candidate that meets Eqs. (4–6) was discarded because it was located within the main-DIB sequence of Fig. 4. Similarly, only DIBs that approximately followed the C2 sequence were kept as C2-related candidates listed in Table B.4.
Despite the strength of these correlation criteria, it is clear that all these new C2 DIB candidates need some confirmation before they can definitely be considered as belonging to the C2 DIB family or to a transition family bridging the gap between the C2 and ζ families. We might search for a confirmation like this through further correlations implying better data and additional sight lines, correlations with the bands of the interstellar molecule C2, similar to Thorburn et al. (2003), or DIB-profile analyses extending the work of Elyajouri et al. (2018) and Ebenbichler et al. (2024).
As listed in Table B.5, these 12 solid C2 candidates display similar average properties as the group of highly correlated reference C2 DIBs, as regards the degree of correlation with reference C2 DIBs and anticorrelation with σ DIBs. However, their average intensity is only about half that of the reference C2 DIBs, which may explain why they were more difficult to identify. Similarly, Table B.5 shows that the possible C2-related DIBs are also much weaker than the highly correlated reference C2 DIBs and reference ζ DIBs.
Finally, practically all new C2 DIB candidates and possible C2-related DIBs (and reference C2 DIBs) meet two key properties of C2 DIBs (see Tables B.1–B.4): 1) most are narrow (FWHM < 0.9 Å, except for λ4699, 4726, 4987, 5262, and 6365, whose widths lie in the range 1.3–2.8 Å), and 2) most are confined to short wavelengths (λ ≤5945 Å, except for λλ6093, 6365, 6729, and 6736).
It is remarkable that the whole extended C2 family remains well distinct from the ζ family in the diagrams of Figs. 1–3. However, the possible intermediate case of λ5849 and λ5828 is discussed in Appendix B.2, and the tentative C2-related DIBs seem to partially fill the gap between the ζ and C2 families (Fig. 3) as was noted by Fan et al. (2022), for example. On the other hand, the extended C2 family strongly overlaps the possible χ DIBs (Section 5, Tables C.1–C.2), including reference C2 DIBs, such as λλ4726, 4984, 5512, 5541, 5546, and 5769.09. This is discussed in Section 5.
Figs. 1–3 and Figs. B.1–B.2 show that the detailed behaviour of some of the 16 reference C2 DIBs is diverse. The range of anticorrelation with σ DIBs traced by kn6009 extends from −0.8 to 0.0 and that of the correlation with the ζ DIB λ5797 q5797 extends from 0.2 to 0.8, without a tight correlation between these two properties. The most extreme case is λ4363. It has the lowest correlation, knqC2, with the reference C2F22 sample and the lowest correlation with λ5797, while its UV sensitivity, traced by kn6009 and R21, is as high as normal. The DIBs λ4726 and λ5170 have values of kn6010 and q5797 close to ζ DIBs (Figs. 3, 4), but values of knqC2 much higher than ζ DIBs. DIB λ5541 is also close to ζ DIBs for knqC2 and q5797, but not for kn6009. Another group of most typical reference C2 DIBs, such as λλ4963, 4969, 4984, and 5512, has high correlation rates with λ5797 and λ5849.
To summarise, adding these 12 solid C2 candidates and 34 possible C2-related DIBs (Tables B.3 and B.4) to the 16 reference C2 DIBs (Table B.1), plus λλ5828, 5849, and 5769.9, yields a total number of 65 potential C2 DIBs, 30 of which may be considered to be confirmed, including two transition DIBs between C2 and ζ, λλ5828 and 5849, in addition to 16 reference DIBs and 12 solid C2 candidates. Although a large fraction of C2-related DIBs may be members of an intermediate family between C2 and ζ, rather than actual C2 DIBs, this may be compared with ~20 suggested C2 DIBs before this work, 18 of which were confirmed. It is certain that a number of additional APO (weak) C2-related DIBs, possibly ~10–20%, are still missed. Therefore, the number of C2 candidates proposed here agrees with the statement of Fan et al. (2017) that the class of C2 DIBs includes fewer than 10% of the currently known DIBs4. However, the fraction of possible APO DIBs that are identified as C2-like in Tables B.1–B.4 is higher at short wavelengths, namely, 53%, 36%, and 21% in the ranges λ < 5000 Å, 5000–5500 Å and 5500–6000 Å, respectively, and only 1% at λ > 6000 Å.
Although no C2 DIB carrier has yet been identified, it is thought that this well-defined DIB family may present special clues for an identification of DIB carriers. Its limitation at short wavelengths, λ < 6000 A (Fig. B.3), may be due to a high sensitivity of their carriers to UV photo-dissociation (e.g. Omont & Bettinger 2020), and it might indicate neutral or anionic long carbon chains or rings as carriers (Section 6.2). It is remarkable that this limitation to λ < 6000 Å is preserved by more than tripling the number of possible C2 candidates.
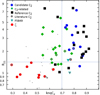 |
Fig. 2 Same definitions as for the symbols in Fig. 1 for the correlation diagram of candidate C2 DIBs and possible C2-related DIBs. The horizontal axis displays the average Pearson correlation factor, knqC2 (Eq. (3) and Fig. 1). The vertical axis displays the ratio of the DIB equivalent widths in the sight line of HD 204827 to HD 183143 (Eq. (1); actual values or equivalent values, see Appendix B.3). The selection criteria (Eqs. (4,6); dotted blue lines) distinguish C2 DIBs well from ζ DIBs. Most C2 DIBs and related DIBs have R21 ≥ 1.5. See Fig. B.2 for an extended version of this figure, including DIB labels. |
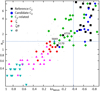 |
Fig. 3 Correlation diagram for C2 DIBs with the same symbols and definitions as in Figs. 1–2, where the horizontal axis displays the normalised correlation factor, kn6010 (equivalent to kn6009, Appendix B.3), and the vertical axis displays the ratio of the DIB equivalent widths in the line of sight HD 204827 to HD 183143 (Eq. (1)). Reference ζσ and σ DIBs of Fan et al. (2022) have been added to show the whole range of variation of kn6010 and R21. The selection criteria (Eqs. (5,6); dotted blue lines) distinguish C2 DIBs well from ζ DIBs. The intermediate position of C2-related DIBs (Table B.4, green diamonds) between C2 and ζ DIBs, is clearly visible, as is the peculiar position of two reference DIBs, λλ4726, 5170, and of λ5849 at the boundary of ζ DIBs in Fig. 2 of Fan et al. (2022). |
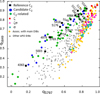 |
Fig. 4 Regular correlation coefficients of all APO DIBs with λ5849 vs. λ5797 (excluding the sight lines of HD 175156 and HD 148579). Reference C2, candidate C2, and C2-related DIBs span a sequence distinct from the sequence spanned by the 47 ζ, ζσ, and σ main DIBs of Fan et al. (2022), and 106 other DIBs (orange dots, Table D.1) that are strongly correlated with these main DIBs (Appendix D.1). Other APO DIBs are plotted as small grey squares. |
5 Set of diffuse interstellar bands that are enhanced in peculiar sight lines
Generally, many lines of sight significantly contribute to the determination of the correlation coefficient between two strong DIBs. However, it was discovered that the correlations within a peculiar large set of DIBs may be dominated by a single APO sight line. This section explores the properties of this set of DIBs and discusses the origin of their enhancement in peculiar sight lines and the nature of their carriers.
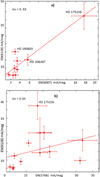 |
Fig. 5 Examples of the distribution of the normalised equivalent width (EN) of DIBs detected in various APO sight lines (with correlation fits and normalised Pearson coefficients kn) for three DIBs, including i) (a) two DIBs, λ6128 and λ6087, that are enhanced in the sight line of HD 175156, compared with all other sight lines (Rav(175156) = 3.0 and 3.9, η175 = 4.1 and 7, respectively, Eqs. (7, 8), Table C.1); and ii) (b) a more normal DIB, λ5766, classified as ζ-type (Fan et al. 2022); the intensity of λ5766 in HD 175156, EN(5766), remains comparable with or lower than in some other sight lines (Rav(175156)= 1.2, η175 =0.40). EN(6128) in HD 175156 is out of the correlation fit by a factor ~3. The errors bars for ENi = EWi/E(B − V) are built from the APO uncertainties on the EW and a systematic representative uncertainty on E(B − V) equal to 0.03 mag. |
5.1 Strongly enhanced diffuse interstellar bands in HD 175156 and HD 148579
When we systematically searched for correlations of C2 DIBs with all other DIBs, we found that some poorly studied DIBs in various wavelength ranges displayed a high correlation with part of the C2 DIBs. Moreover, these high correlations are dominated by substantial enhancements of these DIBs in some specific lines of sight, mostly HD 175156 (see e.g. Fig. 5) and HD 148579 (see Fig. C.2). These two APO sight lines appear to have been little studied outside of the APO data (however, see Vos et al. 2011 and Krełowski et al. 2021 for HD 148579). This may explain that this enhancement was not reported previously.
The enhancement of DIB i in sight line s may be quantified by defining the ratio
![Mathematical equation: $\[\mathrm{R}_{\mathrm{av}}{ }^i(s)=\mathrm{EN}_s^i / \mathrm{EN}_{\mathrm{av}}^i\]$](/articles/aa/full_html/2024/10/aa50841-24/aa50841-24-eq10.png) (7)
(7)
for each DIB, where ![Mathematical equation: $\[\mathrm{EN}_{\mathrm{av}}^{i}\]$](/articles/aa/full_html/2024/10/aa50841-24/aa50841-24-eq11.png) is the average of
is the average of ![Mathematical equation: $\[\mathrm{EN}_{s}^{i}\]$](/articles/aa/full_html/2024/10/aa50841-24/aa50841-24-eq12.png) (Eq. (2)) over the sight lines in which the DIB i is detected, or, better, by the reduced variable
(Eq. (2)) over the sight lines in which the DIB i is detected, or, better, by the reduced variable
![Mathematical equation: $\[\eta^i(s)=\left(\mathrm{EN}_s^i-\mathrm{EN}_{\mathrm{av}}^i\right) / \sigma_{\mathrm{EN}}(s),\]$](/articles/aa/full_html/2024/10/aa50841-24/aa50841-24-eq13.png) (8)
(8)
where σEN(s) is the standard deviation of the ![Mathematical equation: $\[\mathrm{EN}_{s}^{i}\]$](/articles/aa/full_html/2024/10/aa50841-24/aa50841-24-eq14.png) distribution. Examples of striking enhancements in the sight line of HD 175156 (HD 148579) are displayed in Fig. 5a (Fig. C.2a).
distribution. Examples of striking enhancements in the sight line of HD 175156 (HD 148579) are displayed in Fig. 5a (Fig. C.2a).
In order to analyse the case of these two exceptional sight lines, the distributions of ηi(s) over i for the 25 APO sight lines are investigated in Appendix A.2 (see Fig. A.1 and Table A.1). It confirms that the distribution over i of ![Mathematical equation: $\[\mathrm{EN}_{s}^{i}\]$](/articles/aa/full_html/2024/10/aa50841-24/aa50841-24-eq15.png) (or ηi(s)) is approximately normal (roughly Gaussian) for most sight lines s except for three, namely HD 175156, HD 148579, and HD 23512. For these three sight lines, the number of substantially enhanced DIBs, for example, exceeding
(or ηi(s)) is approximately normal (roughly Gaussian) for most sight lines s except for three, namely HD 175156, HD 148579, and HD 23512. For these three sight lines, the number of substantially enhanced DIBs, for example, exceeding ![Mathematical equation: $\[\mathrm{EN}_{\mathrm{av}}^{i}\]$](/articles/aa/full_html/2024/10/aa50841-24/aa50841-24-eq16.png) by more than 2σ, is much greater than a few percent. It reaches 27%, 30%, and 16%, respectively, which corresponds to 79, 43, and 19 DIBs, respectively. The case of HD 23512 is intermediate; the dozen DIBs in excess beyond 2σ, including λλ5599, 5600, and 4259, does not allow a detailed study in this sight line. It would need a better detection rate than the APO Catalog (21%, Table A.1).
by more than 2σ, is much greater than a few percent. It reaches 27%, 30%, and 16%, respectively, which corresponds to 79, 43, and 19 DIBs, respectively. The case of HD 23512 is intermediate; the dozen DIBs in excess beyond 2σ, including λλ5599, 5600, and 4259, does not allow a detailed study in this sight line. It would need a better detection rate than the APO Catalog (21%, Table A.1).
The distribution of the values of ηi(175156) and ηi(148579) for all APO DIBs is provided in Figs. 6a and 6b, respectively, with that of ηi(183143) and ηi(204827) for comparison in Fig. 6c. For HD 175156 and HD 148579, a substantial number of DIBs are in excess above η ≳ 2 (see Table A.1). Practically all corresponding ratios Rav(175156) and Rav(148579) are greater than 2 (Tables C.1–C.2, Fig. C.1), meaning that the sight line has a dominant weight in the correlations of these DIBs. Examples of these correlation diagrams for these two sight lines are displayed in Figs. 5 and C.2, respectively. It is not surprising that the correlation coefficient of two DIBs with high Rav values may reach high values up to kn ≳ 0.9 (Figs. 5a and C.2a). On the other hand, kn remains generally low when one DIB has a low η value (Figs. 5b and C.2b).
However, in extreme cases, where there is no significant correlation between the other sight lines (Fig. C.3), the formally high values of the Pearson correlation coefficients lose their usual meaning. With the limited number of APO detections in these sight lines, especially HD 148579 (Table A.1), this is a major difficulty for exploiting these data and the information that they may hold about DIB carriers. This problem is discussed in Appendix C.2, where an empirical method is proposed for roughly estimating lower values for the correlation coefficients.
The uncertainty of these estimates prevents us from answering the question whether this collection of enhanced DIBs might define a new DIB family. Nevertheless, we propose to call them “χ” DIBs for the time being, for the purpose of investigating their properties and their connection with classical DIB families, as done in Section 5.2. More precisely, those that are enhanced by more than 2σ in HD 175156 (HD 148579) are called χa (χb). The 79 χa DIBs are listed in Table C.1 and the 43 χb DIBs in Table C.2. Eleven DIBs are both χa and χb, namely, λλ 4975.97, 5512, 5706, 5922, 6093, 6102, 6103, 6468, 6755, 6862, and 7470. Such a high proportion of χb DIBs that are also χa and the similarity of many properties justify discussing χa and χb DIBs together as χ DIBs. χa DIBs are more numerous than χb. A possible cause of this difference is the poor quality of APO observations of HD 148579 at λ ≳ 6500 Å, where very few DIBs are detected.
Most of the 111 χ DIBs (Tables C.1–C.2) are relatively weak. The distribution of their average normalised equivalent width, ENav, over all sight lines (except for HD 175156 and HD 148579) is plotted in Fig. C.5b and discussed in Appendix C.3. For more than 75% of them, ENav is lower than 10 mÅ/mag. However, the χa (χb) DIBs are significantly stronger in HD 175156 (HD 148579), with typical EN ≳ 10mÅ/mag (Tables C.1–C.2 and Fig. C.5a). The few peculiar stronger χ DIBs are discussed in Appendix C.3. The most remarkable ones are λ4726 (a well-known very strong peculiar C2 DIB), λ6591, λ4439 (a ζ DIB), and λλ6412, 5419, and 6128 (see Section 6.1). The distribution of the widths of the χ DIBs is displayed in Fig. C.5c. It is comparable to that of all DIBs. Most χa and χb DIBs (~80%) are narrow, with an FWHM ≲ 1 Å. Only five are broader than 2 Å (λλ4726, 5419, 5525, 6128, and 6412); their detection is more difficult, so that they need to be strong.
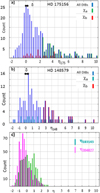 |
Fig. 6 Distribution of the reduced enhancement η175 (resp. η148) (Eq. (8)) of the DIB normalised equivalent width, EN, of all DIBs, χa DIBs and χb DIBs, in the sight line of HD 175156 (resp. HD 148579). Both lines of sight have four DIBs with formal values of η> 10.5 (Table C.2 and Fig. A.1). In panel (c), these distributions are compared with more normal EN distributions in HD 183143 and HD 204827, (see also Fig. A.1). The shift δ of the central roughly Gaussian distribution from ENav (Table A.1) is also displayed. |
5.2 Properties of enhanced diffuse interstellar bands in HD 175156 and HD 148579
A first question is the degree of correlation of χ DIBs within each of the χa and χb classes and between the two classes. This question is difficult to answer because most of the correlation diagrams between any two χ DIBs are somewhat similar to those of Figs. C.3 and C.4, for which the formal values of the Pearson correlation coefficients are meaningless. The approximate estimated lower values of the correlation coefficients proposed in Appendix C.2 are systematically used. However, they remain very uncertain.
A few DIBs were first identified within each of the χa and χb classes, which appear to be highly correlated with most other DIBs of their class. For all χ DIBs, Tables C.1–C.2 report the average of these lower limits of the correlation coefficients (kn175 and kn148) over three such DIBs in each class, namely: λλ6087, 6093, and 6128 for χa DIBs (Table C.1, Eq. (C.2)) and λλ5257, 6142, and 6485 for χb DIBs (Table C.2, Eq. (C.3)). The histograms of Figs. C.6a, and C.6b show that these average limits, kn175 and kn148, are significantly high (≳0.5) for a large fraction (≳75%) of the DIBs within each χ class (see Appendix C.2). However, the correlations with the other χ class are lower.
Interestingly, the χ DIBs include three very broad DIBs that might match the strong bands of two long carbon chains and a ring that were recently measured by action spectroscopy (Marlton et al. 2022, 2023, 2024), namely λλ6128, 6412, and 5419, which match the ring ![Mathematical equation: $\[\mathrm{C}_{14}^{+}\]$](/articles/aa/full_html/2024/10/aa50841-24/aa50841-24-eq17.png) and the chains C17H+ and HC11H+, respectively (see Section 6.1). Tables C.1–C.2 report the average lower limits of the correlation coefficients (knchr) of all χ DIBs with these three DIBs (Eq. (C.1)). The corresponding histograms are displayed in Fig. C.6c. The correlations are again substantial for these three DIBs with most of the χa and χb DIBs.
and the chains C17H+ and HC11H+, respectively (see Section 6.1). Tables C.1–C.2 report the average lower limits of the correlation coefficients (knchr) of all χ DIBs with these three DIBs (Eq. (C.1)). The corresponding histograms are displayed in Fig. C.6c. The correlations are again substantial for these three DIBs with most of the χa and χb DIBs.
Although correlations between the majority of χ DIBs appear to be substantial despite their simplified definition, the large uncertainty about the correlation coefficients seems to currently prevent the definition of a new DIB family. Two main problems seem difficult to overcome: (i) the search for additional strongly correlated χ DIBs should be extended to lower values of η175 and η148, <2; (ii) the current definition of χ DIBs implies a large overlap with C2 DIBs and with ζ, ζσ, and σ main DIBs, which seems difficult to reconcile with a consistent new family definition.
Among the 111 χ DIBs, Tables C.1–C.2 identify a total of 27 DIBs that also belong to reference C2 DIBs (6), candidate C2 DIBs (3), or C2-related DIBs (18). This is about 40% of all 65 C2-like DIBs, and more than half the subclass of 34 C2-related DIBs (Table B.4). Reciprocally, Tables C.1 and C.2 show that about half χa and χb DIBs with λ< 5950 Å are C2 associated. This is also obvious in the various diagrams characterising the C2-like DIBs and their UV sensitivity, such as R21/kn6010 (Fig. C.7) and q5849/q5797 (Fig. C.8).
More generally, these two diagrams give an idea of the diversity of the properties of χ DIBs and their UV sensitivity. The values of the correlation (or anticorrelation) coefficient kn6009 (and kn6011, see Appendix B.3) extend over practically the whole possible range from −1 to +1 (Fig. C.7). Similarly, in the diagram q5849/q5797 (Fig. C.8), the distribution of the χa and χb DIBs not only strongly overlaps the sequence of C2-associated DIBs, but also the sequence of classical ζ, ζσ and σ main DIBs and their associates, and it covers the whole area between the two sequences. More quantitatively, the connection of the χ DIBs with the main classical DIBs is also reflected in the significant fraction of high values of their correlation coefficients q with representative classical main DIBs reported in Table C.3. This fraction is high for ζ, ζσ, and σ DIBs, such as λλ5797, 6196, 6613, 6270, and 5780, where it reaches half of the χ DIBs for q > 0.70, ~20% for q > 0.85, and ~10% for q > 0.90. It is lower for the extreme σ DIB, λ6009. About 20% of the χ DIBs have a level of correlation with the 47 main non-C2 (ζ, ζσ and σ) DIBs of Fan et al. (2022), which is comparable with the minimum level of correlation of these main DIBs between themselves.
Fig. 7 displays the detailed wavelength distribution of the 111 χ DIBs of Tables C.1–C.2. (see also Figs. C.9–C.10, showing the wavelength distributions of χa and χb DIBs separately). This distribution might be not random. There are some indications of evidence for a possible degree of periodic distribution with a period of about 300 Å. This does not seem conclusive, however.
 |
Fig. 7 Wavelength distribution in bins of 100 Å of the 111 χ DIBs of Tables C.1–C.2, selected based on their enhanced intensity in the sight lines of HD 175156 or HD 148579. For comparison, the inset shows the wavelength distribution for all 559 APO DIBs (see Figs. C.9 and C.10 for the wavelength distribution of χa and χb DIBs, respectively). |
5.3 Possible origin of the peculiarity of the HD 175156 and HD 148579 sight lines
Some special conditions in the ISM of the sight lines of HD 175156 and HD 148579 might explain the observed peculiarities of their DIBs. A search in CDS SIMBAD Astronomical Database shows that limited information is available about both sight lines except for that which is provided in Fan et al. (2019) and is summarised in Table A.1. Nevertheless, both sight lines display a significant infrared excess that might be related to PAH emission.
The Gaia DR3 distance of HD 175156 is 568±45 pc. From the strong DIBs they observed, Benvenuti & Porcedu (1989) identified its sight line as ζ (from Krelowski’s private communication). The properties of this sight line were further described by Crawford (1992). He suggested that the observed strong single-component interstellar absorption occurs in outlying diffuse gas that is associated with the molecular cloud that causes the Aquila Ridge in the Milky Way. A Spitzer 5–14 μm spectrum was obtained and analysed by Massa et al. (2022) in a strip ~5″×60″ around the star. The stacked spectrum shows a strong PAH emission, especially around 6.2 μm.
HD 148579 is located in the well-studied region of star formation, ρ Oph. Its Gaia DR2 distance is only 139±3 pc. The interstellar absorption was found to be dominated by a single cloud by Siebenmorgen et al. (2020) (see also the DIB profile study of Krełowski et al. 2021). Cotten & Song (2016) quoted a strong infrared excess in the sight line of this star from the measured 22 μm WISE5 intensity6.
The possible enhanced PAH emission that is observed in the sight line of HD 175156 and is perhaps associated with the infrared excess in HD 148579 may lead us to wonder about two possibilities for DIB carriers. They might be either PAHs, perhaps photo-processed, or carbon rings (or chains) generated from PAHs in interstellar shocks, following the process proposed by Hrodmarsson et al. (2022, 2023). There appears to be no known evidence of shocks in these regions. However, the general context of star formation and the vicinity of massive young stars might favour their presence. Further studies of these regions and similar ones appear highly desirable in order to explore the origin of the enhanced abundance of χ DIB carriers.
6 Possible signs indicating that carbon chains and rings might be carriers of some diffuse interstellar bands
Prompted by the surprising detection of HC5N and HC7N in the ISM (Avery et al. 1976; Kroto et al. 1978), Douglas (1977) proposed that longer carbon chains might be the main carriers of diffuse interstellar bands. This was based on the properties of carbon chains, such as described by Pitzer & Clementi (1959), especially their series of strong bands in the visible range that shift to the red with their size, and their expected stability in UV photon absorption due to internal conversion and infrared emission.
The long-lasting DIB mystery and the soundness of this conjecture triggered an enormous effort for the synthesis and the visible spectroscopy of long chains, especially in the Basel laboratory led by John Maier (see the reviews by Maier 1998, Jochnowitz & Maier 2008a,b who give a complete list of the compounds studied at the time, and Zack & Maier 2014a,b). However, it was disappointing not to achieve any DIB carrier confirmation except for the ![Mathematical equation: $\[\mathrm{C}_{60}^{+}\]$](/articles/aa/full_html/2024/10/aa50841-24/aa50841-24-eq18.png) fullerene, so that Zack & Maier (2014a) concluded that Douglas’ proposition that the absorbing species are long chain carbon molecules, Cn where n may lie in the range 5–15 was now excluded. They added that generally carbon chains up to a dozen atoms, their ions, and simple derivatives containing H or N are not responsible for the typical DIBs.
fullerene, so that Zack & Maier (2014a) concluded that Douglas’ proposition that the absorbing species are long chain carbon molecules, Cn where n may lie in the range 5–15 was now excluded. They added that generally carbon chains up to a dozen atoms, their ions, and simple derivatives containing H or N are not responsible for the typical DIBs.
In almost all cases, measurements were only achieved for n ≲ 15, while it is notorious that these small hydrocarbons may be readily photo-dissociated in the diffuse ISM (e.g. Tielens 2014). These laboratory results and various computations have brought striking confirmations of the basic relation that λ(n) is approximately proportional to n for many strong bands of carbon chains and rings, roughly in accordance with the particle-in-the-box model (see e.g. Anderson & Gordon 2008 and references therein). In a few cases, calculations have confirmed that their large oscillator strengths fn are also roughly proportional to n (e.g. Fischer & Maier 1997, Reddy et al. 2019). However, until recently, most measurements were performed for chains that are too short for their strong bands to be in the DIB visible range (but see Section 6.1). The behaviour of these bands in the visible DIB domain therefore has to rely on extrapolations, whose uncertainty precludes any DIB identification. It is also possible that the linear behaviour of λ with n breaks down for some species, such as HC2nH (Pino et al. 2001).
As emphasised by Zack & Maier (2014a,b), for example, a key and difficult question about the compatibility of long chains or rings with being DIB carriers is the width of their strong bands. If the lifetime of the excited state due to internal conversion is shorter than 0.1 ps, the induced line width, ≳10–20 Å, is too broad to be compatible with that of most detectable DIBs (around 1 Å or less). The internal conversion lifetime of excited states depends on the specific configuration of other excited states and their vibrational levels, so that it is hardly predictable (however, see Ghosh et al. 2019 for C2p+1 chains, and also Pino et al. 2011 for internal conversion of PAHs). Double-resonance spectroscopy of HC2nH+ chains has shown that the narrowness of their strong bands (1–10 cm−1) might be compatible with the observed DIB widths (Rice et al. 2010). Recent measurements of ring cations ![Mathematical equation: $\[\mathrm{C}_{2 n}^{+}\]$](/articles/aa/full_html/2024/10/aa50841-24/aa50841-24-eq19.png) have found, however that the widths are far too broad to be compatible (see references in Section 6.1). Therefore, the question remains generally open whether the width of the strong optical bands of long chains or rings, corresponding to high excited levels, is compatible with the narrowness of most DIBs.
have found, however that the widths are far too broad to be compatible (see references in Section 6.1). Therefore, the question remains generally open whether the width of the strong optical bands of long chains or rings, corresponding to high excited levels, is compatible with the narrowness of most DIBs.
6.1 Possible coincidences of diffuse interstellar bands with gas-phase bands of the C14+ ring, the C17H+ chain, and the HC11H+ chain
The spectroscopy of large molecules, including carbon clusters and other DIB carrier candidates, has made spectacular progress in the past few years, based on methods such as action spectroscopy, cavity ring-down spectroscopy, and double resonance. In addition to the confirmation of ![Mathematical equation: $\[\mathrm{C}_{60}^{+}\]$](/articles/aa/full_html/2024/10/aa50841-24/aa50841-24-eq20.png) as the carrier of five near-infrared DIBs, gas-phase spectroscopy was recently achieved for whole series of strong bands of cation carbon rings and chains with a number of carbon atoms reaching up to ~20–30. These outstanding results were obtained by the Melbourne group, led by E.J. Bieske, including
as the carrier of five near-infrared DIBs, gas-phase spectroscopy was recently achieved for whole series of strong bands of cation carbon rings and chains with a number of carbon atoms reaching up to ~20–30. These outstanding results were obtained by the Melbourne group, led by E.J. Bieske, including ![Mathematical equation: $\[\mathrm{C}_{2 p}^{+}\]$](/articles/aa/full_html/2024/10/aa50841-24/aa50841-24-eq21.png) rings (Buntine et al. 2021, 2022; Marlton et al. 2023), C2p+1 H+ chains and rings (Marlton et al. 2022), and HC2p+1H+ chains (Marlton et al. 2024), and by Rademacher et al. (2022) for
rings (Buntine et al. 2021, 2022; Marlton et al. 2023), C2p+1 H+ chains and rings (Marlton et al. 2022), and HC2p+1H+ chains (Marlton et al. 2024), and by Rademacher et al. (2022) for ![Mathematical equation: $\[\mathrm{C}_{2 p}^{+}\]$](/articles/aa/full_html/2024/10/aa50841-24/aa50841-24-eq22.png) rings. The quality of these data is such that it should allow us to identify the DIB carriers. However, these measurements have revealed that in most of the studied cases, the gas-phase widths of the bands, especially of
rings. The quality of these data is such that it should allow us to identify the DIB carriers. However, these measurements have revealed that in most of the studied cases, the gas-phase widths of the bands, especially of ![Mathematical equation: $\[\mathrm{C}_{2 p}^{+}\]$](/articles/aa/full_html/2024/10/aa50841-24/aa50841-24-eq23.png) rings, are too broad to be compatible with DIB observations (Rademacher et al. 2022; Marlton et al. 2023). Nevertheless, the wavelengths and widths of three of the most remarkable χ DIBs might be compatible with these measurements of cation carbon rings or chains.
rings, are too broad to be compatible with DIB observations (Rademacher et al. 2022; Marlton et al. 2023). Nevertheless, the wavelengths and widths of three of the most remarkable χ DIBs might be compatible with these measurements of cation carbon rings or chains.
6.1.1 Diffuse interstellar band λ6128 and the C14+ ring
As noted by Buntine et al. (2021) and Rademacher et al. (2022), and further analysed by Marlton et al. (2023), the relatively sharp main band of ![Mathematical equation: $\[\mathrm{C}_{14}^{+}\]$](/articles/aa/full_html/2024/10/aa50841-24/aa50841-24-eq24.png) ring, measured to be at 6127.1±1 Å by two-colour photo-dissociation action spectroscopy by Marlton et al. (2023), is compatible within less than 1σ with the relatively strong and broad χa DIB, λ6128.26±0.35. The DIB width, 2.7 Å, is also compatible with the laboratory width, 6 cm−1 (2.3 Å). Fig. 3 of Rademacher et al. (2022) displays a number of vibronic transitions in the range of 200–500 cm−1 above the band origin (strongest peak of the band system). However, there is no match with observed DIBs in this range, especially since all DIB widths are narrow, ≲1 Å, while all vibronic bands are much broader, ≳5 Å. These broad widths of the vibronic bands of the
ring, measured to be at 6127.1±1 Å by two-colour photo-dissociation action spectroscopy by Marlton et al. (2023), is compatible within less than 1σ with the relatively strong and broad χa DIB, λ6128.26±0.35. The DIB width, 2.7 Å, is also compatible with the laboratory width, 6 cm−1 (2.3 Å). Fig. 3 of Rademacher et al. (2022) displays a number of vibronic transitions in the range of 200–500 cm−1 above the band origin (strongest peak of the band system). However, there is no match with observed DIBs in this range, especially since all DIB widths are narrow, ≲1 Å, while all vibronic bands are much broader, ≳5 Å. These broad widths of the vibronic bands of the ![Mathematical equation: $\[\mathrm{C}_{14}^{+}\]$](/articles/aa/full_html/2024/10/aa50841-24/aa50841-24-eq25.png) ring might explain why they are not detected as DIBs. In addition to the broad nature of the
ring might explain why they are not detected as DIBs. In addition to the broad nature of the ![Mathematical equation: $\[\mathrm{C}_{14}^{+}\]$](/articles/aa/full_html/2024/10/aa50841-24/aa50841-24-eq26.png) vibronic transitions, the fact that this spectral region of the DIB spectrum is congested further prevents their possible detection.
vibronic transitions, the fact that this spectral region of the DIB spectrum is congested further prevents their possible detection.
λ6128 is remarkable among the 79 χa DIBs because it is highly correlated with the whole χa set (Appendix C.3), and it is significantly stronger and broader than most other χa DIBs (Table C.1, Fig. C.5a). Its normalised equivalent width is EN = 8.9 and 42 mÅ/mag in the sight lines of HD 183143 and HD 175156, respectively. From these values, we may derive the possible fraction of interstellar carbon locked in the ![Mathematical equation: $\[\mathrm{C}_{14}^{+}\]$](/articles/aa/full_html/2024/10/aa50841-24/aa50841-24-eq27.png) ring from the general equation (e.g. Cami 2014; Omont 2016)
ring from the general equation (e.g. Cami 2014; Omont 2016)
![Mathematical equation: $\[\mathrm{X}_{\mathrm{CM}}=3 \times 10^{-8}(\mathrm{EN} / \mathrm{f})\left(\mathrm{N}_{\mathrm{C}} / 20\right)[5800 / \lambda(\mathrm{\Aring})]^{2},\]$](/articles/aa/full_html/2024/10/aa50841-24/aa50841-24-eq28.png) (9)
(9)
where the total carbon abundance in the interstellar medium is assumed to be nC/nH = 3.9 × 10⁻⁴, and NC is the number of carbon atoms of the molecule. For the fraction of interstellar carbon locked in its possible carrier, the ![Mathematical equation: $\[\mathrm{C}_{14}^{+}\]$](/articles/aa/full_html/2024/10/aa50841-24/aa50841-24-eq29.png) ring, this yields
ring, this yields
![Mathematical equation: $\[\mathrm{X}_{\mathrm{C}}\left(\mathrm{C}_{14}^{+}\right)=(1.7 \text { and } 8) \times 10^{-6} \times\left(0.1 / \mathrm{f}_{6127}\right)\]$](/articles/aa/full_html/2024/10/aa50841-24/aa50841-24-eq30.png) (10)
(10)
in the sight lines of HD 183143 and HD 175156, respectively. However, it seems that there is no estimate for the oscillator strength of this band of ![Mathematical equation: $\[\mathrm{C}_{14}^{+}\]$](/articles/aa/full_html/2024/10/aa50841-24/aa50841-24-eq31.png) (see Strelnikov et al. 2019; Buntine et al. 2021). As for any molecule, the f-value of
(see Strelnikov et al. 2019; Buntine et al. 2021). As for any molecule, the f-value of ![Mathematical equation: $\[\mathrm{C}_{14}^{+}\]$](/articles/aa/full_html/2024/10/aa50841-24/aa50841-24-eq32.png) should be high enough to prevent an unlikely enormous abundance of this species, as stressed by Campbell & Maier (2017), for instance.
should be high enough to prevent an unlikely enormous abundance of this species, as stressed by Campbell & Maier (2017), for instance.
 |
Fig. 8 Comparison of the original band and the first vibronic band of C17H+ chain measured at 6407±3 Å and 6311–6321 Å, respectively, by Marlton et al. (2022, Fig. 5 (top)); and, (bottom), (i) the very broad DIB at 6412.37±0.96 Å, and (ii) the possible very broad DIB observed at about 6314 Å (both are marked by red arrows). The displayed DIB spectrum in the sight line of HD 183143 is copied from the published DIB spectral atlas published by Hobbs et al. (2009). The vertical blue line marks the position of the wavelength of the original band of C17H+ chain within the reported spectrum of HD 183143. The horizontal blue and red double arrows show the reported uncertainties on the measured values of the wavelengths of the origin band of C17H+ and of the APO DIB λ6412, respectively. |
6.1.2 Diffuse interstellar band λ6412 and the C17H+ chain
Marlton et al. (2022) reported 15607±8 cm−1 (6407±3 Å) for the peak position of the strong original band of the C17H+ linear chain, measured by two-colour resonance-enhanced photo-dissociation, and 8.2 Å (20 cm−1) for its width. This is perhaps compatible with the very broad and strong χb DIB, λ6412, whose APO wavelength is 6412.37±0.96Å (i.e. 15 594.9±2.4 cm−1) and its very broad width of 7.6 Å (18 cm−1) (Fig. 8). In the APO Catalog, this DIB is quoted as “detected” in 10 sight lines (including HD 148579, but not HD 175156) and “contaminated” in one sight line (HD 183143). It is also quoted as possible by Sonnentrucker et al. (2018, see also Herbig & Leka 1991; Jenniskens & Désert 1994; Tuairisg et al. 2000). However, it is not reported in the HD 183143 DIB catalogue of Hobbs et al. (2009), probably because of its contamination (Fig. 8). Therefore, it was missed by Marlton et al. (2022) in their search of possible DIB coincidences with their laboratory measurements. This coincidence might be credible when considering the matched broad widths, ~8 Å, the difficulty in accurately characterising these very broad DIBs, and the rarity of the latter (only a dozen in the whole visible range). If confirmed, this match might be key in showing the presence of a first long carbon chain as the carrier of a strong DIB, with an EW= 119 mÅ and 91 mÅ in HD 183143 and HD 148579, respectively.
In addition to the original band at 6407 Å, the high-quality laboratory spectrum of the C17H+ chain displays a spectacular double vibronic progression, corresponding to at least two stretching modes at ~230 cm−1 and ~1780 cm−1 (see Fig. 4 of Marlton et al. 2022). All vibronic companions are at least twice broader than the original band at 6407 Å, which could have made their detection as DIBs almost hopeless. Nevertheless, there is a possible match between the first vibronic band of C17H+ at 6311–6321 Å and a possible very broad DIB (Fig. 8). This feature was interpreted as a very broad DIB by Herbig (1975) and Tuairisg et al. (2000), but it was not included in the preliminary and final APO DIB catalogues (Hobbs et al. 2009, Fan et al. 2019) and it was only quoted as possible by Sonnentrucker et al. (2018). All its properties are very uncertain in any case because it is impossible to determine exactly where it begins and ends, and where the underlying continuum is located. Herbig quoted 6314 Å for its centre, and Tuairisg et al. proposed a FWHM = 23 Å and EW = 390 mÅ in HD 183143. The approximate agreement in position, width, and even profile with the vibronic band of C17H+ is striking (Fig. 8). However, the above value for the EW, 3.3 times greater than the APO value for λ6412, would not be compatible with Fig. 4 of Marlton et al. (2022, partly reproduced in Fig. 8), where the vibronic band is weaker than twice the original band, but any estimate of the DIB EW is very uncertain because of contamination by strong stellar lines (see the spectrum of HD 183143 in Fig. 8, from Hobbs et al. 2009).
The other vibronic bands of C17H+ (Marlton et al. 2022) are even broader and often weaker than the first band at 6311–6321 Å. It is therefore not surprising that no matching DIB can be identified among APO DIBs close to the measured positions. Other smaller chains, C2p+1H+, that were measured by Marlton et al. (2022) seem to have a width of their origin band that is comparable to C17H+. The absence of strong broad DIBs that match the position of their origin band within the ±8 cm−1 uncertainty of the measurements might be explained again by the difficulty of detecting very broad DIBs that are comparable to λ6412 and possibly weaker than it, and/or by the destruction of these smaller chains in the ISM.
The possible identification of an associated vibronic DIB significantly enhances the credibility of C17H+ as the carrier of λ6412. The APO normalised equivalent width of λ6412 is estimated as EN = 94 and 267 mÅ/mag in the sight lines of HD 183143 and HD 148579, respectively. From these values, we may derive the possible fraction of interstellar carbon locked in C17H+ chain from Eq. (9), which yields XC17H+ ~ 3×10⁻⁶/f6407 and 8×10⁻⁶/f6407 in the sight lines of HD 183143 and HD 148579, respectively, where f6407 is the oscillator strength of the origin band of C17H+. Marlton et al. (2022) calculated a total oscillator strength fT = 5.2 for the 11∑+−X1∑+ transition of C17H+ based on ωB97X-D/cc-pVDZ TD-DFT7-level calculations. Their Figure 4 shows that the origin band contributes only a small fraction of this value, maybe ~5–10%. This would yield
![Mathematical equation: $\[\mathrm{X}_{\mathrm{C}}\left(\mathrm{C}_{17} \mathrm{H}^{+}\right) \sim(0.5-1) \times 10^{-5}\]$](/articles/aa/full_html/2024/10/aa50841-24/aa50841-24-eq33.png) (11)
(11)
for the fraction of interstellar carbon locked in the C17H+ chain in the sight line of HD 183143. This may be compared with the possible abundance in the same sight line of ![Mathematical equation: $\[\mathrm{C}_{14}^{+}\]$](/articles/aa/full_html/2024/10/aa50841-24/aa50841-24-eq34.png) ,
, ![Mathematical equation: $\[\mathrm{X}_{\mathrm{C}}\left(\mathrm{C}_{14}^{+}\right)=1.7 \times 10^{-6} \times\left(0.1 / \mathrm{f}_{6127}\right)\]$](/articles/aa/full_html/2024/10/aa50841-24/aa50841-24-eq35.png) , if it were the carrier of λ6128 (Eq. (10)) and of
, if it were the carrier of λ6128 (Eq. (10)) and of ![Mathematical equation: $\[\mathrm{C}_{60}^{+}, \quad \mathrm{X}_{\mathrm{C}}\left(\mathrm{C}_{60}^{+}\right) \sim 10^{-4}\]$](/articles/aa/full_html/2024/10/aa50841-24/aa50841-24-eq36.png) (Walker et al. 2015, 2016).
(Walker et al. 2015, 2016).
λ6412 is well correlated with most χb DIBs and with a number of χa DIBs (Appendix C). It is only mildly correlated with the reddening, E(B − V) (q=0.56). It is slightly more correlated with the ζ, ζσ, and σ major DIBs (q ~ 0.65–0.75).
6.1.3 Diffuse interstellar bands λ5450 and λ5419 and the HC11H+ chain
Marlton et al. (2024) have recently reported the two-colour resonance enhanced photo-dissociation spectroscopy of HC2p+1H+ (p = 2–6) chains. They quoted a possible match between two strong bands of HC11H+ chain with two strong very broad DIBs, namely, i) the origin band of the ![Mathematical equation: $\[\tilde{\mathrm{C}}^{2} \Pi_{u}-\tilde{\mathrm{X}}^{2} \Pi_{g}\]$](/articles/aa/full_html/2024/10/aa50841-24/aa50841-24-eq37.png) transition at λ = 5451±3 Å (FWHM = 15 Å), with the DIB λ5450 (APO λ = 5450.1 Å, FWHM = 9.9 Å); and ii) its mixed first vibronic band, shifted by 95 cm−1, at λ = 5423+4 Å (FWHM = 10 Å), with the DIB λ5419 (APO λ = 5419.6 Å, FWHM = 7 Å). However, various arguments may question these identifications (Marlton et al. 2024). In addition, λ5450 and λ5419 are poorly correlated (kn = 0.46, q = 0.61), λ5450 is not a χ DIB, it is poorly correlated with χ DIBs and strongly correlated with the main DIBs (q6196 = 0.90), while it is the reverse for λ5419, which is a major χa DIB. Therefore, it seems probable that the match between the two DIBs and the bands of HC11H+ is not perfect, and that one of the DIBs at least is contaminated by some blend. This is confirmed by the APO Catalog, where λ5450 is quoted as “contaminated” for most sight lines, and λ5419 for half of the sight lines.
transition at λ = 5451±3 Å (FWHM = 15 Å), with the DIB λ5450 (APO λ = 5450.1 Å, FWHM = 9.9 Å); and ii) its mixed first vibronic band, shifted by 95 cm−1, at λ = 5423+4 Å (FWHM = 10 Å), with the DIB λ5419 (APO λ = 5419.6 Å, FWHM = 7 Å). However, various arguments may question these identifications (Marlton et al. 2024). In addition, λ5450 and λ5419 are poorly correlated (kn = 0.46, q = 0.61), λ5450 is not a χ DIB, it is poorly correlated with χ DIBs and strongly correlated with the main DIBs (q6196 = 0.90), while it is the reverse for λ5419, which is a major χa DIB. Therefore, it seems probable that the match between the two DIBs and the bands of HC11H+ is not perfect, and that one of the DIBs at least is contaminated by some blend. This is confirmed by the APO Catalog, where λ5450 is quoted as “contaminated” for most sight lines, and λ5419 for half of the sight lines.
6.2 Further discussion of chains and rings as possible carriers of χ and C2 diffuse interstellar bands
A few arguments in favour of long carbon chains and rings as possible carriers of χ and C2 DIBs may be summarised as follows.
The confirmation that 94% C2-like DIBs have a short wavelength, λ < 5950 Å, reinforces the conclusions of Omont & Bettinger (2020) about the correlation between wavelength, size, and UV resilience of the carriers of weak and narrow DIBs, and the likelihood of elongated carriers for these DIBs. Neutral and anionic carbon chains or rings are the most obvious and simplest candidates for these carriers.
Although no identification is confirmed, the possible match of five strong very broad DIBs with strong bands of long carbon chains or ring is impressive. It seems unlikely that all are mere coincidence. In particular, it is striking that they include four of the dozen DIBs that are broader than 7 Å. The possible identifications of very broad DIBs carried by the C17H+ chain and the ![Mathematical equation: $\[\mathrm{C}_{14}^{+}\]$](/articles/aa/full_html/2024/10/aa50841-24/aa50841-24-eq38.png) ring seem relatively alluring for λ6412 and λ6128, but they also need confirmation by further good-quality observations in various sight lines. If confirmed, these would be the first identifications of long carbon chains or rings in the diffuse ISM. It might open the way to considering the possibility of other types of long molecules as DIB carriers. It would be logical to first consider the possible presence in the diffuse ISM of different charge states of other long members of chain series whose short members are observed in dense clouds, such as Cn, HCn, HCnH, HC2p+1 N, and C2p+1N. Various conditions should be addressed, however, including stability, chain or ring transformation, chemistry, formation, band width and profile, and vibronic bands.
ring seem relatively alluring for λ6412 and λ6128, but they also need confirmation by further good-quality observations in various sight lines. If confirmed, these would be the first identifications of long carbon chains or rings in the diffuse ISM. It might open the way to considering the possibility of other types of long molecules as DIB carriers. It would be logical to first consider the possible presence in the diffuse ISM of different charge states of other long members of chain series whose short members are observed in dense clouds, such as Cn, HCn, HCnH, HC2p+1 N, and C2p+1N. Various conditions should be addressed, however, including stability, chain or ring transformation, chemistry, formation, band width and profile, and vibronic bands.
Three of these very broad DIBs, λλ6128, 6412, and 5419, are members of the possible χ class, whose DIBs are enhanced in the HD 175156 or HD 148579 sight lines. If the possible semi-periodic λ distribution, with a period of ~300 Å, of χ DIBs were confirmed, it might be compatible with chain or ring carriers that display this periodicity.
Although they are mostly weak, the sum of the normalised equivalent widths of all C2-like and χ DIBs represents a significant fraction of the total equivalent width of all DIBs. For instance, in the sight line of HD 204827, ENtot(C2) ~ 900 mÅ/mag, and ENtot(χ) ~ 1300 mÅ/mag (~800 mÅ/mag for narrow χ DIBs). These values may be compared with those for all DIBs, except for λ4429, in HD 204827, ENtot(Allwo4429) ~ 5100 mÅ/mag (2900 mÅ/mag, for all narrow DIBs) (Omont & Bettinger 2020, Table 2). This yields ~18% and ~25% for the contributions of C2 and χ DIBs to the total equivalent width of all DIBs (31% and 28% for all narrow DIBs), respectively. The contribution is much smaller in the σ sight lines, such as HD183143.
The possibility that carbon chains and rings contribute to the carriers of major DIBs might be considered as well, for instance the ~50 DIBs considered by Fan et al. (2022), which are known to be strongly correlated, and their associates (Appendix D.1). For instance, the extrapolation up to C27 of the matrix spectra of C2p+1 chains, measured by Wyss et al. (1999) and Forney et al. (1996) up to n = 2p+1 = 21, might match λλ5797, 6196, and 6613 DIBs for C23, C25, and C27, respectively (Appendix D.2). In addition to the uncertainty of the extrapolations, however, it seems that these chains could hardly survive to cyclisation in the diffuse ISM, and the expected ![Mathematical equation: $\[{ }^{1} \Sigma_{\mathrm{u}}^{+}-\mathrm{X}^{1} \Sigma_{\mathrm{g}}^{+}\]$](/articles/aa/full_html/2024/10/aa50841-24/aa50841-24-eq39.png) strong band of linear C27 seems hardly compatible with the likely presence of a Q band in the DIB profile of λ6613 (see e.g. MacIsaac et al. 2022), so that such an identification appears questionable.
strong band of linear C27 seems hardly compatible with the likely presence of a Q band in the DIB profile of λ6613 (see e.g. MacIsaac et al. 2022), so that such an identification appears questionable.
Various indications, including the detailed view of vibronic bands of C2p+1H+ and HC2p+1H+ chains obtained by Marlton et al. (2022, 2024), tend to show that the chains of interest as DIB carriers probably have low-frequency optically active vibration modes in the range of 100–400 cm−1. As is well known, correlations should be key for identifying DIBs with a common carrier, including vibronic DIBs. In principle, different DIBs with the same carrier and the same lower level should be 100% correlated. In practice, the data are always noisy, and lower correlation coefficients may be considered, perhaps q ≳ 0.95 for strong DIBs with good-quality data, and ≳ 0.90 for data of poorer quality. However, similarly high correlations may be reached with similar but different carriers.
As shown in particular by several studies using APO data (Fan et al. 2017, 2022; Smith et al. 2021), many strong DIBs meet the above requirements for possible vibronic DIBs. Tables D.3–D.4 list a number of possible vibronic DIBs that are highly correlated with λλ5797, 6196, or 6613 and are blueshifted by a few hundred cm−1, which might be compatible with carbon chains, such as C2p+1. Their number is limited to some DIBs for λλ5797 and 6196 (Table D.3). Nevertheless, the high number (~15–20) of possible vibronic DIBs associated with λ6613 (Table D.4) is impressive. Although it may be partly fortuitous, it probably implies a different carrier structure from λ5797 and λ6196, whichever it is.
If the identification of C17H+ as the carrier of λ6412 were confirmed, the estimate of the fraction of interstellar carbon that it contains, XC(C17H+) ~(0.5–1)×10−5 (Eq. (11)), would give a lower limit of the interstellar carbon that is locked in chains or rings in the diffuse ISM. Including chains and rings of different nature, length, and charge (whether DIB carriers or not) might yield an abundance that is one or two orders of magnitude higher for all chains and rings. This would remain lower by an order of magnitude at least than the total carbon in PAHs (~4x10⁻² in normal galaxies; see e.g. Shivaei et al. 2024), but it would still be significant.
In conclusion, each of the above arguments is fragile, and none of them is decisive in proving that long chains and rings are important DIB carriers. Nevertheless, their accumulation is impressive. This conjecture would also require that they have efficient formation processes in the diffuse ISM and that they are stable against photo-dissociation. However, the convergence of arguments in favour of chains and rings justifies further efforts to confirm this half-century conjecture.
7 Summary and conclusion
The systematic analysis of DIB correlations has been extended through the remarkable capabilities of the APO Catalog. It is shown that important results can be derived, even with weak DIBs, despite the limited statistics.
The number of C2-like DIB candidates has been substantially increased. In addition to the ~20 known confirmed C2 DIBs, 12 new C2 candidates and 34 possible C2-related DIBs were identified, mostly at λ < 6000 Å. Some of these candidates need to be confirmed, for example by profile analysis or correlations with bands of the interstellar C2 molecule. A more thorough analysis of C2-like DIBs may lead to a continuous series of DIBs with sensitivity to UV-quenching ranging from reference C2 to ζ DIBs. With these candidates, the census of C2 DIBs appears to be not far from being complete, in agreement with the prediction of Fan et al. (2017) that the total number of C2 DIBs probably does not exceed ~10% of all DIBs. The group of C2-like DIBs remains key in view of DIB-carrier identification because of their limitation to short wavelengths, which might indicate long carbon chains or rings.
The strong enhancement of two subsets of DIBs in two sight lines, HD 175156 and HD 148579, was a surprise. Their significant correlations justified discussing them as a single class that was tentatively denoted χ. It might include part of the C2 DIBs. However, it is clear that this new feature of the DIB panorama needs further analysis. A deeper statistical analysis should aim at confirming the consistency of this class, and whether it might lead to the definition of a new DIB family. Finding other similar sight lines in EDIBLES, for example, would be mandatory for this purpose. Possible processes at the origin of the enhancement of these DIB carriers should be investigated by screening possible peculiar interstellar conditions in these sight lines. It would be important to confirm that the interstellar material that causes this is located close to these stars and how it might be affected by this vicinity.
A few other signs were identified that may point to chains or rings as major DIB carriers, including the confining of C2 DIBs at short wavelengths and the possible tentative identification of C17H+ and HC11H+ chains (each of which include two very broad bands) and ![Mathematical equation: $\[\mathrm{C}_{14}^{+}\]$](/articles/aa/full_html/2024/10/aa50841-24/aa50841-24-eq40.png) ring (one broad band) as carriers of strong DIBs, including three χ bands. If confirmed, this would make various carbon chains and rings, with about 15 to 30 carbon atoms, significant members of the panel of cosmic molecules. However, even in the most extreme estimates, the possible total abundance of chains and rings in the diffuse ISM will probably remain modest, at least an order of magnitude lower than the total carbon in PAHs. Trying to confirm the identification of C17H+ chain and
ring (one broad band) as carriers of strong DIBs, including three χ bands. If confirmed, this would make various carbon chains and rings, with about 15 to 30 carbon atoms, significant members of the panel of cosmic molecules. However, even in the most extreme estimates, the possible total abundance of chains and rings in the diffuse ISM will probably remain modest, at least an order of magnitude lower than the total carbon in PAHs. Trying to confirm the identification of C17H+ chain and ![Mathematical equation: $\[\mathrm{C}_{14}^{+}\]$](/articles/aa/full_html/2024/10/aa50841-24/aa50841-24-eq41.png) ring with better data and other sight lines is a first priority for validating this conjecture. If the presence of the
ring with better data and other sight lines is a first priority for validating this conjecture. If the presence of the ![Mathematical equation: $\[\mathrm{C}_{14}^{+}\]$](/articles/aa/full_html/2024/10/aa50841-24/aa50841-24-eq42.png) ring were confirmed, an accurate estimate of its f-value would also allow one to better estimate the total abundance of all
ring were confirmed, an accurate estimate of its f-value would also allow one to better estimate the total abundance of all ![Mathematical equation: $\[\mathrm{C}_{2 n}^{+}\]$](/articles/aa/full_html/2024/10/aa50841-24/aa50841-24-eq43.png) rings, most of which are not DIB carriers because their bands are too broad.
rings, most of which are not DIB carriers because their bands are too broad.
The ability of chains and rings as short as ![Mathematical equation: $\[\mathrm{C}_{17} \mathrm{H}^{+}, \mathrm{C}_{14}^{+}\]$](/articles/aa/full_html/2024/10/aa50841-24/aa50841-24-eq44.png) or HC11H+ to be DIB carriers is conditioned by a survival against photo-dissociation much better than that of PAHs of similar size. It seems possible that this might result from an efficient optical fluorescence that might induce a cooling that is much faster than infrared cooling (Iida et al. 2022; Lacinbala et al. 2022). This remains to be modelled in detail for these molecules, however. Various chemical processes that include chains and rings should be explored to assess their relative abundances. Finally, at least one viable formation process of interstellar chains and rings should be identified, such as PAH shattering in shocks (Duley & Kuzmin 2010; Jones 2016; Hrodmarsson et al. 2022, 2023), or chains attached to PAHs or PAH clusters (Zanolli et al. 2023).
or HC11H+ to be DIB carriers is conditioned by a survival against photo-dissociation much better than that of PAHs of similar size. It seems possible that this might result from an efficient optical fluorescence that might induce a cooling that is much faster than infrared cooling (Iida et al. 2022; Lacinbala et al. 2022). This remains to be modelled in detail for these molecules, however. Various chemical processes that include chains and rings should be explored to assess their relative abundances. Finally, at least one viable formation process of interstellar chains and rings should be identified, such as PAH shattering in shocks (Duley & Kuzmin 2010; Jones 2016; Hrodmarsson et al. 2022, 2023), or chains attached to PAHs or PAH clusters (Zanolli et al. 2023).
Various extensions of this work may be considered. Two main goals should be to address the nature and origin of the enhancement of the so-called χ DIBs in peculiar sight lines, as quoted above, and to further explore the possible C2-related subfamily (Table B.4) that is intermediate between C2 and ζ DIBs.
A systematic theoretical exploration of optical spectra of possible long chains and rings might be considered, for instance by extending the treatment of Marlton et al. (2022), to pursue the identification of series of strong bands in the DIB domain. Further studies of internal conversion similar to that of Ghosh et al. (2019) might be helpful. The highest priority should be given to sophisticated laboratory spectroscopy, including neutral and anionic species, using various methods of gas-phase spectroscopy, which is mandatory for an identification of DIBs.
Acknowledgements
I thank the referee, N. Cox, for his very helpful comments and suggestions. I especially thank Ugo Jacovella and Holger Bettinger for continuous discussions and their important suggestions during the preparation of the paper. I am indebted to Pierre Cox and Patrick Boissé for their careful reading of the manuscript and their suggestions for improving it. I want to especially thank A. Witt for providing an unpublished analysis about the properties of the ISM in the sight lines of HD 175156 and HD 148579. I thank the whole APO team and especially Haoyu Fan for working out the unique APO Catalog. I thank S. Marlton for kindly providing detailed spectral data, and O. Berné, E. Dartois, L. Hobbs, C. Joblin, R. Lallement, J. Maier, T. Pino, D. Welty and He Zhao for various help and the discussions we have had on the contents of the paper. Finally, I made great use of the TOPCAT tool, https://www.star.bris.ac.uk/~mbt/topcat/; “TOPCAT & STIL: Star-link Table/VOTable Processing Software” (Taylor 2005) – and would like here to thank its developers.
Appendix A APO sight-lines and DIB intensities
A.1 APO sight-lines properties
The properties of the 25 stars of the APO Catalog and their sight lines are briefly described in Fan et al. (2019). The information about their main properties is reproduced in Table A.1. The sight lines, most frequently quoted in the present paper, include:
- HD 204827 (Cepheus) and HD 183143 (HT Sge), whose DIB properties were listed in the preliminary version of the APO Catalog of Hobbs et al. (2008, 2009). HD 183143 is the reference for typical σ sight lines. HD 204827 is substantially UV-shielded; it is often used as reference both for ζ and C2 DIBs (e.g. Thorburn et al. 2003). The ratio R21 = EW(HD204827)/EW(HD183143) (Eq. 1) provides a straightforward information about the behaviour of a DIB with respect to UV intensity, and therefore, about its belonging to DIB families, σ (R21 ≲ 0.5), ζσ (0.5 ≲ R21 ≲ 0.7), ζ (0.8 ≲ R21 ≲ 1.5) and C2 (R21 ≳ 1.5).
- HD 175156 (Scutum) and HD 148579 (Ophiucus) display specific enhancements of χa and χb DIBs, respectively, that are at the origin of the definition of the tentative χ class (Section 5). See Section 5.3 for the limited knowledge about the properties of these sight lines.
- HD 23512 (Taurus) might also have some enhancements of specific DIBs.
- HD 37061 (NU Ori) has a very strong UV intensity.
- HD 166734 (Serpens) and HD 168625 (V4030 Sgr) display high normalised equivalent widths for σ DIBs. HD 166734 has the highest detection rate of all sight lines.
- VI Cyg 12 and VI Cyg 5 have a high extinction.
A.2 Distribution of DIB intensities in APO sight lines
Fig. A.1 displays the histograms of η values (reduced normalised equivalent widths, Eq. [8]) for the 25 APO lines of sight. For most sight lines (except HD 175156, HD 148579 and HD 23512), the η distribution is compact and it may roughly be approximated by a Gaussian, whose centre is shifted by δ. Approximate values of δ were inferred from the histograms and they are reported in Table A.1. After correction for this shift, the histograms were used to approximately estimate the number of detected DIBs whose EN/ENav exceeds 2σ (Table A.1), for supporting the discussion of Section 5.1.
Properties of APO sight-lines.
 |
Fig. A.1 Distribution of the reduced enhancement η (Eq. 8) of the DIB normalised equivalent width, EN, in all 25 APO sight lines. In each histogram, red arrows mark the position of η-δ = ±2, where δ is the shift of the central roughly Gaussian distribution from ENav (Table A.1). The line of sight of HD 175156 has four DIBs with formal values of η175 − 14, 15, 17 and 35 (Table C.1) − outside of the range displayed here (−3 < η <10.5). The line of sight of HD 148579 has four DIBs with formal values of η148 − 11, 13, 16 and 32 (Table C.2) − outside of this range. |
Appendix B Individual data of C2 DIBs
B.1 Extended tables and figures
Table B.1 recalls the most standard list of 16 reference C2-DIBs, established by Thorburn et al. (2003), and their properties. This list was basically confirmed by Kaźmierczak et al. (2010) and Elyajouri et al. (2018).
Additional C2 DIBs previously proposed by various authors are listed in Table B.2. They include: i) λ6729 (Thorburn et al. 2003; Fan et al. 2022) and λλ5061, 5245 & 5910 (Ebenbichler et al. 2024), that are also included in Tables B.3 or B.4; ii) λ5828 (Fan et al. 2022) and λ5849 (Kaźmierczak et al. 2014), that are significantly anticorrelated with λ6009 and might be in the transition between the C2 and ζ families; iii) λ5547 and λ5769.91, that were tentatively proposed as C2 DIBs by Elyajouri et al. (2018); however, they hardly fit the criteria discussed here for C2-DIB candidates, although λ5547 is included in the list of C2-related DIBs (Table B.4); iv) λ5793 is definitely not a C2 DIB, although it was listed as so by error in Table 1 of Fan et al. 2022, while it is rightly quoted as a ζ DIB in the rest of this paper.
As discussed in Section 4, the parameters of classical C2 DIBs of Table B.1 are the reference for establishing the criteria of Eqs. (4–6), that are used for identifying possible additional members of the extended C2 family. These criteria include: i) knqC2 = (knC2 + qC2)/2 (Eq. 3), the average correlation coefficient of the DIB with the sample of six major C2 DIBs from Fan et al. (2022); ii) the anticorrelation coefficient with λ6009, one of the most extreme σ DIBs; and iii) the ratio R21 = EW(204827)/EW(183143) (Eq. 1). They are combined for defining a quality factor, QC2, for belonging to the C2 family, from their proximity to the criteria of Eqs. (4–6) (see Figs B.1–B.2).
As described in Section 4.2, the values of QC2 allow the selection of 12 solid C2-DIB candidates, with QC2 = 4 or 3. They are listed in Table B.3, with the same parameters as for reference C2-DIBs in Table B.1. 34 additional tentative candidates, with QC2 = 2 or 1, are similarly listed in Table B.4, as C2-related DIBs.
Figures B.1 and B.2 are the extensions of Fig. 1 & Fig. 2 with source labels. They display the positions of all C2-like DIBs (reference, candidates and related), with respect to the C2 selection criteria of Eqs. (4–6). Reference ζ DIBs (Fan et al. 2022) have been added for comparison. Fig. B.1 plots knqC2 versus kn6009. Fig. B.2 plots R21 (Eq. 1) vs knqC2.
B.2 Groups and peculiarities of C2 and related DIBs
As quoted, the degree of correlation between the 16 reference C2 DIBs (Table B.1, Thorburn et al. 2003) is diverse. From Fig. B.1, one may distinguish a main group (denoted “HighCorr”) of 12 DIBs, highly correlated (knqC2 ≳ 0.8) with the six C2 DIBs of Fan et al. (2022), and a group (“MidCorr”) of four DIBs (λλ5003, 5541, 5762 & 4363), mildly correlated (knqC2 ≲ 0.65). It is seen that most solid C2 candidates may be associated with the HighCorr group, and none with the MidCorr group. Most possible C2-related DIBs are intermediate between the MidCorr group and ζ DIBs.
Table B.5 summarises some average properties of the different groups of C2 DIBs and candidates. It is seen that the solid C2 candidates are comparable to the HighCorr reference group for knqC2 and kn6009, but they have a much weaker intensity, e.g. EN(204827). The possible C2-related DIBs have a comparable intensity with the C2 candidates, but significantly lower correlation coefficients.
Note that the 27 C2 DIBs or candidates, that are tentatively classified as χ DIBs, are discussed in Appendix C.4 (see Tables C.1–C.2, B.3–B.4 and Fig. C.7). They include most χ DIBs with kn6009 < −0.2, and a significant number of Thorburn reference C2-DIBs, namely: λλ 4726, 4984, 5512, 5541, 5546, 5769.09.
In the diagram, knqC2/kn6009 (Fig. B.1), two reference C2 DIBs, λλ 4726, 5170, occupy a peculiar position in the upper left part of the figure (see also Fig. 3). They seem to be associated with the major DIB λ5849, that is known to be at the transition between the ζ and C2 families. Such an association might be confirmed by the high correlation coefficients of these two C2 DIBs with λ5849 (Fig. 4). Another C2 DIB, λ5828 (Fan et al. 2022, Table B.2), and a C2-related DIB of Table B.4, λ4987, lie close to these three DIBs in Fig. B.1. In order to see whether they might be associated with λλ 5849, 4726, 5170, they are identified with the same symbol as λ5849 in Figs. B.1–B.2 and 3–2. The association seems possible for λ5828, but more doubtful for λ4987.
B.3 Substitute parameters of C2 DIBs and others
Because of the incomplete detections of DIBs in any sight line, some of the key parameters, used for characterising or selecting C2 DIBs, would lack in Tables B.3–B.4. In most cases such lacking parameters may simply be replaced by substituted values inferred from similar sight lines or DIBs that are present in the APO Catalog.
• EN(204827)
The normalised equivalent width, EN(204827), is used to characterise the strength of C2 (and ζ) DIBs and in the definition of the ratio R21 = EN(204827)/EN(183141) (Eq. 1). When a DIB is not detected in the sight line of HD 204827, the value used for EN(204827) may be inferred from the detection of the DIB in HD 147889 and the high correlation of the strength of C2 DIBs in these two sight lines. In the case of C2-like DIBs, the relation EN(204827) ~ 0.89 × EN(147889) is used [while for all DIBs, EN(204827) ~ 0.75 × EN(147889)].
• EN(183143)
EN(183143) is used to characterise the strength of DIBs in σ sight lines and in the definition of the ratio R21. In case of non detection, it may be inferred from a detection in the highly correlated sight line of HD 166734, using EN(183143) ~ 1.38 × EN(166734).
• R21
In most cases, R21 is calculated from the actual or inferred values of EN(204827) and EN(183141). However, in case the C2-like DIB is undetected in both HD 183143 and HD 166734, an approximate lower value of R21 may be inferred from the upper limits of EN in these two sight lines.
• Correlation coefficients with λ6009 DIB
λ6009 is one of the most extreme σ DIBs, with a high detection rate, so that its anticorrelation with C2 DIBs is used to characterise their sensitivity to UV quenching (Figs. 1 and B.1). It has a twin DIB, λ6011, of similar intensity, that is correlated at 96%, so that it is likely that they have the same carrier. When calculating or discussing correlations or anticorrelations with other DIBs, it is equivalent or slightly better to use EN(6010) = [EN(6009)+EN(6011)]/2 or EW(6010) = [EW(6009)+EW(6011)]/2) (as it is done, e.g. in Figs. 3 & C.7).
Data of 16 reference C2-DIBs listed in Thorburn et al. (2003)
Data of C2-DIB candidates from the literature
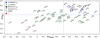 |
Fig. B.1 Correlation diagram for candidate C2-DIBs (blue dots, Table B.3) and possible C2-related DIBs (green diamonds, Table B.4), comparing them to reference C2-DIBs (black squares, Table B.1), candidate C2-DIBs from the literature (grey diamonds, Table B.2), possible DIBs similar to λ5849 (F5849, cyan triangles) and a comparison sample of ζ DIBs (red dots). The horizontal axis displays the normalised anticorrelation Pearson coefficient, kn6009, with the σ DIB λ6009 (excluding the sight lines of HD 175156 and HD 148579). The vertical axis displays the average correlation coefficient, knqC2 (Eq. 3), with a subsample of six reference C2 DIBs (λλ4726, 4963, 4984, 5418, 5512 and 5546). It is seen that the selection criteria (Eqs. (4,6)) discriminate well C2 DIBs from ζ DIBs. Most C2 DIBs and related DIBs are significantly anticorrelated with σ DIBs (kn6009. < 0). See Fig. 1 for a reduced version of this figure without DIB labels. |
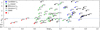 |
Fig. B.2 Same definitions as symbols as Fig. B.1 for the correlation diagram of solid candidate C2-DIBs and possible C2-related DIBs. The horizontal axis displays the average normalised Pearson correlation factor, knqC2 (Eq. 3 and Fig. B.1). The vertical axis displays the ratio of the DIB equivalent widths in the sight line of HD 204827 to HD 183143 (Eq. 1; actual values or equivalent values, see Appendix B.3). It is seen that the selection criteria (Eqs. [4,5], dotted blue lines) discriminate well C2 DIBs from ζ DIBs. Most C2 DIBs and related DIBs have R21 ≥ 1.5. See Fig. 2 for a reduced version of this figure without DIB labels. |
Data of 12 confirmed new C2-DIB candidates
Data of 34 C2-related candidates
Average properties of various C2-DIB groupsa
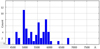 |
Fig. B.3 Wavelength distribution of all 65 C2 DIBs and candidates (Tables B.3–B.4), showing their limitation to λ < 6000 Å for most of them. |
Appendix C Individual data of χ DIBs
C.1 Extended tables and figures of χ DIBs
Table C.1 lists the 79 χa DIBs, that are enhanced in HD 175156, with their main properties (Section 5.1), including: the normalised equivalent width, EN(175156), and its reduced value η175 (Eq. 8); the enhancement ratio, Rav(175156) (Eq. 7, Fig. C.1); the correlation coefficients with λλ6009, 5797 & 5512, plus R21, that characterised their UV behaviour; and average correlation coefficients with three main χa DIBs, three main χb DIBs (Eqs. C.2–C.3) and with the three strong very broad χ DIBs whose wavelengths might match strong bands of two carbon chains and a ring (Sections 5.2 & 6.1),
![Mathematical equation: $\[k n_{\mathrm{chr}}=\left(k n_{6412}+k n_{5419}+k n_{6128}\right) / 3 \text {, }\]$](/articles/aa/full_html/2024/10/aa50841-24/aa50841-24-eq75.png) (C.1)
(C.1)
Table C.2 lists similar quantities for 43 χb DIBs, that are enhanced in HD 148579, and their properties in this sight line.
Fig. C.1 displays the distribution of the ratio Rav(175156) [resp. Rav(148579)] (Eq. 7), for χa (resp. χb) DIBs, compared with all detected DIBs.
An example of peculiar enhancement in the sight line of HD 148579 is provided in Fig. C.2a for two χb DIBs. They are much stronger than in all other sight lines, by a factor, Rav(148579) ~ 3, compared with the sight-line average. On the other hand, Fig. C.2b displays the case of a normal (σ) DIB, whose intensity in HD 148579 remains comparable to or lower than some other sight lines [Rav(148579) = 0.87].
Fig. C.3 & Fig. C.4 show examples of significant, but indeterminate, correlations in the sight lines of HD 175156 and HD 148579 (with formal Pearson coefficients kn ≳ 0.8). In Fig. C.4, examples are given about the way approximate lower limits of kn were systematically estimated in such cases. Such limits are reported in Tables C.1–C.2 for kn5512, and they were used for kn6087, kn6093, kn6128, kn5257, kn6412, kn6845 and kn5419, which enter in the calculation of the average coefficients kn175, kn148 and knchr that are reported in Tables C.1–C.2 (Section 5.1, Eqs. (C.1–C.3).
Fig. C.5 displays the distribution of EN(175156), ENav and the DIB width, for χa DIBs and HD 175156, and similar quantities for χb DIBs and HD 148579.
Fig. C.6 displays the distribution of the lower limits of the average values of the correlation coefficients of χa and χb DIBs with three groups of three χ DIBs (Eqs. C.1–C.3).
Fig. C.7 shows the diagrams of kn6010 vs R21, for χa and χb DIBs and comparison samples. Fig. C.8 shows a similar diagram for q5797 vs q5849.
Table C.3 reports some statistics about the highest correlation coefficients of χ DIBs with classical strongest DIBs (Appendix C.4).
Fig. C.9 & Fig. C.10 display the wavelength distribution of χa and χb DIBs, respectively.
C.2 Correlations between χ DIBs with indeterminate coefficients
Figs. C.3 & C.4 display a few representative examples of correlation diagrams for χ sources, where the formal calculations yield meaningless high values (≳0.80) for the normalised Pearson coefficients, because the correlation is dominated by one (or rarely two) sight line, where the normalised equivalent widths of both DIBs are more than twice the average value of EN observed in all other sight lines. In such cases only lower limits can be estimated for the Pearson coefficients, such as those reported in the inserts of Fig. C.4. The most frequent cases are those of Figs. C.3 & C.4a, where all other sight lines than HD 175156 and HD 148579 display no significant correlation. Nevertheless, the very high values of EN observed for both DIBs in at least one sight line (generally HD 175156) show that there is a very significant correlation between both DIBs when including all sight lines. Such a correlation is conservatively estimated by the value kn > 0.50 (Fig. C.4a). In other cases, there is a significant correlation between the two DIBs when excluding the sight lines of HD 175156 and HD 148579 (Figs. C.4b,c,d). Depending on the strength of this correlation, a lower limit for the actual correlation, including all sight lines, is conservatively estimated as kn > 0.60, kn > 0.70 or kn > 0.80 (Figs. C.4b,c,d). Intermediate lower limits of 0.55, 0.65 or 0.75 may also be used for intermediate cases.
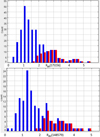 |
Fig. C.1 Distribution of the ratio Rav(175156) (Eq. 7) [resp. Rav (148579)] of the DIB normalised equivalent widths in the sight line of HD 175156 (resp. HD 148579) to their average in all sight lines, for all detected DIBs (blue), and for χa and χb DIBs (red), respectively (Tables C.1–C.2). |
Using such an approximate correlation gauge, it is possible to identify the χa and χb DIBs that are the most strongly correlated within their class. In this way, a small group of three DIBs was identified in each class. It is thought that the average correlation coefficient kn of the other DIBs of the same class provides an estimate of their degree of correlation with the whole class. The chosen core DIBs are λλ6087, 6093 & 6128 for χa DIBs. They are used for defining the average coefficient,
![Mathematical equation: $\[k n_{175}=\left(k n_{6087}+k n_{6093}+k n_{6128}\right) / 3 \text {, }\]$](/articles/aa/full_html/2024/10/aa50841-24/aa50841-24-eq76.png) (C.2)
(C.2)
that is reported in Table C.1. Similarly, Table C.2 reports the value of the average coefficient,
![Mathematical equation: $\[k n_{148}=\left(k n_{5257}+k n_{6412}+k n_{6845}\right) / 3\]$](/articles/aa/full_html/2024/10/aa50841-24/aa50841-24-eq77.png) (C.3)
(C.3)
Data of 79 χa DIBs
As most individual correlation coefficients have only lower limits, their averages, kn175, kn148 and knchr (Eq. C.1), are themselves lower limits. Tables C.1–C.2 show that, for χa DIBs, 73% (resp. 90%) of the values of kn175 are ≥ 0.5 (resp. ≥0.45), and 90% of the values of kn148 are ≥ 0.5 for χb DIBs. This means that, within each class, ~80–90% of the DIBs are significantly correlated with the whole class.
C.3 Prominent χ DIBs
Only two χa and one χb DIB candidates have ENav ≳ 100 mÅ/mag, namely: the well-known peculiar C2 DIB λ4726 (172 mÅ/mag), λ6591 (108 mÅ/mag) and λ6412 (102 mÅ/mag, see below). All three are broad, FWHM=2.8, 7.8 and 7.6Å, respectively. Only two additional χa DIBs have ENav ~ 40–60 mÅ/mag, λ4780 and the well-known DIB, λ5849, that is intermediate between C2 and ζ DIBs.
As discussed in Section 5.2, the most extraordinary χ DIB is λ6412 (EN148579 = 267 mÅ/mag). The DIB λ6128 (EN175156 = 42 mÅ/mag) is significantly weaker and narrower. However, it is stronger than most other χa DIBs and similarly highly correlated with many of them [80% (resp. 94%) with kn6128 >0.50 (resp. 0.45)]. As discussed in Section 6.1, λ6128 might coincide with the strong band of the ![Mathematical equation: $\[\mathrm{C}_{14}^{+}\]$](/articles/aa/full_html/2024/10/aa50841-24/aa50841-24-eq111.png) ring.
ring.
Data of 43 χb DIBs
Another prominent χa DIB is λ5419 (EN175156 = 388 mÅ/mag). As discussed in Section 6.1, it is also very strong and very broad, and it might perhaps match a vibronic band of the HC11H+ chain.
Other remarkable χ DIBs first include the four other highly correlated DIBs, λλ6093, 6087, 5257, 6845 (Eqs. (C.2–C.3). The DIB λ6093 is remarkable since it is both a χa and χb DIB, and may be classified as a C2-related DIB candidate (Table B.4) from its strong UV sensitivity (Figs. B.1 & B.2), despite its longer wavelength than most other C2-like DIBs.
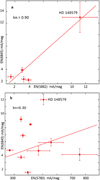 |
Fig. C.2 Examples of the intensity distribution of DIBs detected in the various sight lines (similar to Fig. 5, with correlation fits and normalised Pearson coefficients kn) for three DIBs including: a) two DIBs, λ6845 and λ5862, that are enhanced in the sight line of HD 148579, compared with all other sight lines (Rav(148579) = 3.3 and 2.8, respectively); and b) a more normal DIB, λ5780, classified as σ-type (Fan et al. 2022); the intensity of λ5780 in HD 148579 remains comparable with or lower than some other sight lines (Rav(148579) = 0.87). |
Correlation coefficients of χ DIBs with strongest DIBs.
C.4 Connection with C2 DIBs and main DIBs
Tables C.1–C.2 and B.3–B.4 show that six χ DIBs are also reference C2 DIBs, three are solid C2 candidates, and 18 are possible C2-related DIBs. In total, there is a substantial overlap with C2 DIBs, since 27 out of 111 χ DIBs (24%, both χa and χb) are related to C2 DIBs. Such an overlap is further characterised in Figs. C.7 & C.8.
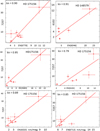 |
Fig. C.3 Examples of significant, but indeterminate, correlations in the sight lines of HD 175156 and HD 148579 (with correlation fits and formal Pearson coefficients kn ≥ 0.8). In all cases, it is estimated that a conservative lower limit of the actual value of kn is 0.5. |
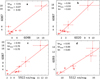 |
Fig. C.4 Examples of estimated lower limits for indeterminate normalised Pearson correlation coefficients, in the insert: knall, formal coefficient with all sight lines (displayed fit); knwoo, formal coefficient excluding the sight lines of HD 175156 and HD 148579; kn, estimated lower limit (Tables C.1–C.2). Note the large differences between the values of knall and knwoo. |
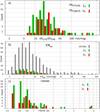 |
Fig. C.5 Distribution of normalised equivalent width and width, FWHM, of χa and χb DIBs: a) Distribution of EN175156 of χa DIBs in the sight line of HD 175156 and of EN1148579 of χb DIBs in the sight line of HD 148579; b) Distribution of average value of EN, ENav, over all sight lines, for all DIBs and for χa and χb DIBs; c) Distribution of the widths of χa and χb DIBs. |
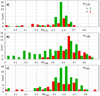 |
Fig. C.6 Average lower-limit values of normalised correlation coefficients kn, for the χa DIBs (green bars) and the χb DIBs (red bars), with: a) three χa DIBs λλ6087, 6093, 6128 (kn175, Table C.1, Eq. C.2); b) three χb DIBs λλ5257, 6412, 6845 (kn148, Table C.2, Eq. C.3); c) three χ DIBs that might be carried by a carbon chain or ring, λλ5419, 6128 & 6412 (knchr, Tables C.1–C.2, Eq. C.1). |
On the other hand, χ DIBs strongly overlap with ζ, ζσ and σ main DIBs (Fig. C.8). 27 of them are strongly correlated with the 47 non-C2 main DIBs defined by Fan et al. (2022), with at least one correlation coefficient q ≥ 0.88 (Tables D.1 and C.1–C.2).
Fig. C.8 displays the distribution of the χ DIBs with respect to the C2-like DIBs and the non-C2 main DIBs, in the diagram q5849 vs q5797. Similarly, Fig. C.7 shows that the correlation (or anticorrelation) coefficient kn6010 of the χ DIBs extends over the whole range −0.9 to +0.9.
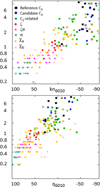 |
Fig. C.7 Correlation diagram for 79 χa DIBs (Table C.1) and 43 χb DIBs (Table C.2), compared with C2 reference and candidate DIBs and C2-related DIBs (Tables B.3–B.4), and reference main ζ, ζσ and σ DIBs from Fan et al. (2022). The vertical axis displays the ratio R21 of the DIB equivalent widths in the sight line of HD 204827 to HD 183143 (actual values or equivalent values, see Appendix B.3). In the top (resp. bottom) panel, the horizontal axis displays the anticorrelation factor, kn6010, equivalent to kn6009 (resp. q6010, equivalent to q6009) (excluding the sight lines of HD 175156 and HD 148579). The comparison of the top and bottom panels visualises the difference between kn6010 and q6010. |
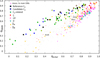 |
Fig. C.8 Regular correlation coefficients q with λ5797 versus λ5849 (excluding the sight lines of HD 175156 and HD 148579) for: i) χa and χb DIBs (Tables C.1–C.2); ii) the same comparison samples as Fig. C.7; and iii) the additional sample of 106 DIBs of Table D.1 that are strongly correlated with the main DIBs (Appendix D.1, pink small dots). |
Appendix D Some properties of main DIBs
D.1 DIBs that are strongly correlated with main DIBs
Table D.1 lists the 106 additional non-C2 DIBs that are strongly correlated with the set of 47 ζ, ζσ & σ main DIBs defined by Fan et al. (2022), with, at least, one regular correlation coefficient q ≥ 0.88, i.e. a value at least comparable with the minimum value of the correlation of these 47 main DIBs between themselves (Fan et al. 2022; Smith et al. 2022). Table D.1 also identifies the strong DIB, among λ5797 (ζ), λλ6196, 6613 (ζσ), λ6270 (σ close to the ζσ limit), λ5780 (σ) and λ6009 (extreme σ), for which the correlation is maximum. This gives an indication of the family to which the DIB belongs, that needs to be confirmed.
D.2 Possible coincidences of wavelengths of C2p+1 chains with strong DIBs
Table D.2 shows explicit values of the wavelengths of a very strong band (![Mathematical equation: $\[{ }^{1} \Sigma_{\mathrm{u}}^{+}-\mathrm{X}^{1} \Sigma_{\mathrm{g}}^{+}\]$](/articles/aa/full_html/2024/10/aa50841-24/aa50841-24-eq131.png) ) of C2p+1 chains in Ne-matrix, either measured by Wyss et al. (1999) and Forney et al. (1996) up to n = 2p + 1 = 21, or extrapolated from their measurements with a slope λ/n = 206 Å. These extrapolated wavelengths, λnNeext, for n = 23 to 27, are compared with the wavelengths of the major narrow DIBs, λλ5797, 6196 & 6613. There is a striking possible agreement, since the DIB wavelengths are slightly blue shifted from λnNeext by a few tens of Å, respectively, i.e. a value compatible with the expected red shift from the Ne-matrix.
) of C2p+1 chains in Ne-matrix, either measured by Wyss et al. (1999) and Forney et al. (1996) up to n = 2p + 1 = 21, or extrapolated from their measurements with a slope λ/n = 206 Å. These extrapolated wavelengths, λnNeext, for n = 23 to 27, are compared with the wavelengths of the major narrow DIBs, λλ5797, 6196 & 6613. There is a striking possible agreement, since the DIB wavelengths are slightly blue shifted from λnNeext by a few tens of Å, respectively, i.e. a value compatible with the expected red shift from the Ne-matrix.
But, the conjecture that these highly correlated DIBs could be carried by C2p+1 chains would face various difficulties, including:
i) The uncertainties on the wavelength extrapolations and the matrix shift preclude to check the actual wavelength match.
ii) There is no good match between any DIB and the actual matrix measurements for C19 and C21.
iii) The DIB profile of λ6613 implies the likely presence of a Q band (see e.g. MacIsaac et al. 2022), unlike the profiles of λλ5797 & 6196, the profiles of C2p+1 chains up to C19, and the profiles of most C2 DIBs (Elyajouri et al. 2018). This seems hardly compatible with the expected ![Mathematical equation: $\[{ }^{1} \Sigma_{\mathrm{u}}^{+}-\mathrm{X}^{1} \Sigma_{\mathrm{g}}^{+}\]$](/articles/aa/full_html/2024/10/aa50841-24/aa50841-24-eq132.png) strong band of linear C27, unless, perhaps, this chain was bent. But, there is no other evidence of such a change of structure of C27 with respect to shorter chains.
strong band of linear C27, unless, perhaps, this chain was bent. But, there is no other evidence of such a change of structure of C27 with respect to shorter chains.
iv) It seems that such very long chains could hardly survive to cyclisation in the diffuse ISM, after the absorption of a ~10 eV UV photon. However, detailed models for such cyclisations, including delayed fluorescence, are still lacking.
D.3 Possible vibronic systems of major DIBs
Several DIBs are highly correlated with λλ5797, 6196 & 6613 and blue shifted by less than a few hundred cm−1. They might be possible vibronic DIBs (Smith et al. 2021; Fan et al. 2022).
Such possible vibronic DIBs include those listed in Table D.3, for λ5797 and λ6196. Their number is limited, even taking into account the enhanced difficulty for detecting DIBs at short wavelength. This might perhaps be roughly compatible with the extrapolation to C23-C25 of the vibronic structures seen in the matrix measurement of Wyss et al. (1999) for C19 and C21. But, the values of these possible vibronic shifts seem hardly compatible with the extrapolation of the theoretical values of the lowest ![Mathematical equation: $\[\sigma_{g}^{+}\]$](/articles/aa/full_html/2024/10/aa50841-24/aa50841-24-eq133.png) mode of C19-C21 (Ghosh et al. 2019).
mode of C19-C21 (Ghosh et al. 2019).
On the other hand, the high number of possible vibronic DIBs associated with λ6613 (Table D.4) is impressive, especially when compared with λλ5797, 6196, although it might include fortuitous coincidences. This difference may be partially explained by the larger DIB wavelength range possible for vibronic DIBs of λ6613, but it probably implies a different carrier structure.
DIBs that are strongly correlated with main DIBs
Comparison of Ne-matrix wavelengths of C2p+1 carbon chains with very strong narrow DIBs, λλ5797, 6196, 6613.
Possible vibronic DIBs associated with major DIBs, λ5797 (ζ) and λ6196 (ζσ).
Possible DIB vibronic system of the major DIB λ6613 (ζσ)
References
- Allamandola, L. J., Tielens, A. G. G. M., & Barker, J. R. 1985, ApJ, 290, L25 [Google Scholar]
- Allamandola, L. J., Hudgins, D. M., Bauschlicher, C. W., et al. 1999, A&A, 352, 659 [NASA ADS] [Google Scholar]
- Anderson, B. D., & Gordon, C. M. 2008, J. Chem. Educ., 85, 1279 [NASA ADS] [CrossRef] [Google Scholar]
- Andrews, H., Boersma, C., Werner, M. W., et al. 2015, ApJ, 807, 99 [NASA ADS] [CrossRef] [Google Scholar]
- Avery, L. W., Broten, N. W., MacLeod, J. M., et al. 1976, ApJ, 205, L173 [NASA ADS] [CrossRef] [Google Scholar]
- Baron, D., Poznanski, D., Watson, D., et al. 2015, MNRAS, 451, 332 [NASA ADS] [CrossRef] [Google Scholar]
- Benvenuti, P., & Porceddu, I. 1989, A&A, 223, 329 [NASA ADS] [Google Scholar]
- Buntine, J. T., Cotter, M. I., Jacovella, U., et al. 2021, J. Chem. Phys. 155, 214302 [NASA ADS] [CrossRef] [Google Scholar]
- Buntine, J. T., Carrascosa, E., Bull, J. N., et al. 2022, Rev. Sci. Instrum., 93, 043201 [NASA ADS] [CrossRef] [Google Scholar]
- Burkhardt, A. M., Long Kelvin Lee, K., Bryan Changala, P., et al. 2021, ApJ, 913, L18 [NASA ADS] [CrossRef] [Google Scholar]
- Cami, J. 2014, The Diffuse Interstellar Bands, IAU Symposium, 297, 370 [NASA ADS] [Google Scholar]
- Cami, J., & Cox, N. L. J. 2014, The Diffuse Interstellar Bands, IAU Symposium, 297 [Google Scholar]
- Cami, J., Sonnentrucker, P., Ehrenfreund, P., et al. 1997, A&A, 326, 822 [NASA ADS] [Google Scholar]
- Cami, J., Cox, N. L., Farhang, A., et al. 2018, The Messenger, 171, 31 [NASA ADS] [Google Scholar]
- Campbell, E. K., & Maier, J. P., 2017, J. Chem. Phys., 146, 160901 [CrossRef] [Google Scholar]
- Campbell, E. K., Holz, M., Gerlich, D., & Maier, J. P. 2015, Nature, 523, 322 [NASA ADS] [CrossRef] [Google Scholar]
- Candian, A., Gomes Rachid, M., MacIsaac, H., et al. 2019, MNRAS, 485, 1137 [CrossRef] [Google Scholar]
- Castellanos, R., Najarro, F., Garcia, M., et al. 2024, MNRAS, 532, 2065 [NASA ADS] [CrossRef] [Google Scholar]
- Cernicharo, J., Agúndez, M., Cabezas, C., et al. 2021, A&A, 649, L15 [EDP Sciences] [Google Scholar]
- Chown, R., Sidhu, A., Peeters, E., et al. 2024, A&A, 685, A75 [NASA ADS] [CrossRef] [EDP Sciences] [Google Scholar]
- Cordiner, M. A., Linnartz, H., Cox, N. L. J., et al. 2019, ApJ, 875, L28 [NASA ADS] [CrossRef] [Google Scholar]
- Cotten, T. H., & Song, I. 2016, ApJS, 225, 15 [Google Scholar]
- Cox, N. L. J., Cami, J., Kaper, L., et al. 2014, A&A, 569, A117 [NASA ADS] [CrossRef] [EDP Sciences] [Google Scholar]
- Cox, N. L. J., Cami, J., Farhang, A., et al. 2017, A&A, 606, A76 [NASA ADS] [CrossRef] [EDP Sciences] [Google Scholar]
- Crawford, I. A. 1992, The Observatory, 112, 161 [NASA ADS] [Google Scholar]
- Crawford, M. K., Tielens, A. G. G. M., & Allamandola, L. J. 1985, ApJ, 293, L45 [Google Scholar]
- Douglas, A. E. 1977, Nature, 269, 130 [NASA ADS] [CrossRef] [Google Scholar]
- Draine, B. T., & Li, A. 2007, ApJ, 657, 810 [CrossRef] [Google Scholar]
- Duley, W. W., & Kuzmin, S. 2010, ApJ, 712, L165 [NASA ADS] [CrossRef] [Google Scholar]
- Ebenbichler, A., Postel, A., Przybilla, N., et al. 2022, A&A, 662, A81 [NASA ADS] [CrossRef] [EDP Sciences] [Google Scholar]
- Ebenbichler, A., Smoker, J. V., Lallement, R., et al. 2024, A&A, 686, A50 [NASA ADS] [CrossRef] [EDP Sciences] [Google Scholar]
- Elyajouri, M., Lallement, R., Cox, N. L. J., et al. 2018, A&A, 616, A143 [NASA ADS] [CrossRef] [EDP Sciences] [Google Scholar]
- Ensor, T., Cami, J., Bhatt, N. H., et al. 2017, ApJ, 836, 162 [NASA ADS] [CrossRef] [Google Scholar]
- Fan, H., Welty, D. E., York, D. G., et al. 2017, ApJ, 850, 194 [NASA ADS] [CrossRef] [Google Scholar]
- Fan, H., Hobbs, L. M., Dahlstrom, J. A., et al. 2019, ApJ, 878, 151 [NASA ADS] [CrossRef] [Google Scholar]
- Fan, H., Hobbs, L. M., Dahlstrom, J. A., et al. 2020, VizieR Online Data Catalog: J/ApJ/ 878/151 [Google Scholar]
- Fan, H., Schwartz, M., Farhang, A., et al. 2022, MNRAS, 510, 3546 [NASA ADS] [CrossRef] [Google Scholar]
- Fan, H., Rocha, C. M. R., Cordiner, M., et al. 2024, A&A, 681, A6 [NASA ADS] [CrossRef] [EDP Sciences] [Google Scholar]
- Fischer, G., & Maier, J. P. 1997, Chem. Phys., 223, 149 [Google Scholar]
- Foing, B. H., & Ehrenfreund, P. 1994, Nature, 369, 296 [NASA ADS] [CrossRef] [Google Scholar]
- Foing, B. H., & Ehrenfreund, P. 1997, A&A, 317, L59 [NASA ADS] [Google Scholar]
- Forney, D., Freivogel, P., Grutter, M., et al. 1996, J. Chem. Phys. 104, 4954 [NASA ADS] [CrossRef] [Google Scholar]
- Friedman, S. D., York, D. G., McCall, B. J., et al. 2011, ApJ, 727, 33 [NASA ADS] [CrossRef] [Google Scholar]
- Fulara, J., & Krełowski, J. 2000, New A Rev., 44, 581 [NASA ADS] [CrossRef] [Google Scholar]
- Fulara, J., Jakobi, M., & Maier, J. P. 1993, Chem. Phys. Lett., 211, 227 [NASA ADS] [CrossRef] [Google Scholar]
- Geballe, T. R., Najarro, F., Figer, D. F., et al. 2011, Nature, 479, 200 [NASA ADS] [CrossRef] [Google Scholar]
- Ghosh, A., Reddy, S. R., & Mahapatra, S. 2019, J. Chem. Phys. 151, 054304 [NASA ADS] [CrossRef] [Google Scholar]
- Hamano, S., Kobayashi, N., Kawakita, H., et al. 2022, ApJS, 262, 2 [NASA ADS] [CrossRef] [Google Scholar]
- Heger, M. L. 1922a, Lick Observatory Bull., 10, 141 [NASA ADS] [CrossRef] [Google Scholar]
- Heger, M. L. 1922b, Lick Observatory Bull., 10, 146 [NASA ADS] [Google Scholar]
- Herbig, G. H. 1975, ApJ, 196, 129 [NASA ADS] [CrossRef] [Google Scholar]
- Herbig, G. H. 1995, ARA&A, 33, 19 [Google Scholar]
- Herbig, G. H., & Leka, K. D. 1991, ApJ, 382, 193 [NASA ADS] [CrossRef] [Google Scholar]
- Hobbs, L. M., York, D. G., Snow, T. P., et al. 2008, ApJ, 680, 1256 [NASA ADS] [CrossRef] [Google Scholar]
- Hobbs, L. M., York, D. G., Thorburn, J. A., et al. 2009, ApJ, 705, 3 [Google Scholar]
- Hrodmarsson, H. R., Bouwman, J., Tielens, A. G. G. M., & Linnartz, H. 2022, Int. J. Mass Spectrom., 476, 116834 [CrossRef] [Google Scholar]
- Hrodmarsson, H. R., Bouwman, J., Tielens, A. G. G. M., & Linnartz, H. 2023, Int. J. Mass Spectrom., 485, 116996 [CrossRef] [Google Scholar]
- Iida, S., Hu, W., Zhang, R., et al. 2022, MNRAS, 514, 844 [NASA ADS] [CrossRef] [Google Scholar]
- Jenniskens, P., & Desert, F.-X. 1994, A&AS, 106, 39 [NASA ADS] [Google Scholar]
- Joblin, C., Maillard, J. P., D’Hendecourt, L., et al. 1990, Nature, 346, 729 [NASA ADS] [CrossRef] [Google Scholar]
- Jochnowitz, E. B., & Maier, J. P. 2008a, Annu. Rev. Phys. Chem., 59, 519 [NASA ADS] [CrossRef] [Google Scholar]
- Jochnowitz, E. B., & Maier, J. P. 2008b, Mol. Phys., 106, 2093 [CrossRef] [Google Scholar]
- Jones, A. P. 2016, Roy. Soc. Open Sci., 3, 160223 [NASA ADS] [CrossRef] [Google Scholar]
- Kaźmierczak, M., Schmidt, M. R., Bondar, A., et al. 2010, MNRAS, 402, 2548 [CrossRef] [Google Scholar]
- Kaźmierczak, M., Schmidt, M., Weselak, T., et al. 2014, The Diffuse Interstellar Bands, IAU Symposium, 297, 121 [Google Scholar]
- Kos, J., & Zwitter, T. 2013, ApJ, 774, 72 [NASA ADS] [CrossRef] [Google Scholar]
- Krelowski, J. 1989, Astron. Nachr., 310, 255 [NASA ADS] [CrossRef] [Google Scholar]
- Krelowski, J., & Walker, G. A. H. 1987, ApJ, 312, 860 [NASA ADS] [CrossRef] [Google Scholar]
- Krelowski, J., Snow, T. P., Seab, C. G., et al. 1992, MNRAS, 258, 693 [NASA ADS] [CrossRef] [Google Scholar]
- Krełowski, J., Galazutdinov, G. A., Gnaciński, P., et al. 2021, MNRAS, 508, 4241 [CrossRef] [Google Scholar]
- Kroto, H. W., Kirby, C., Walton, D. R. M., et al. 1978, ApJ, 219, L133 [NASA ADS] [CrossRef] [Google Scholar]
- Lacinbala, O., Calvo, F., Dartois, E., et al. 2023, A&A, 671, A89 [NASA ADS] [CrossRef] [EDP Sciences] [Google Scholar]
- Léger, A., & Puget, J. L. 1984, A&A, 137, L5 [Google Scholar]
- Léger, A., & D’Hendecourt, L. 1985, A&A, 146, 81 [NASA ADS] [Google Scholar]
- Linnartz, H., Cami, J., Cordiner, M., et al. 2020, J. Mol. Spectrosc., 367, 111243 [NASA ADS] [CrossRef] [Google Scholar]
- MacIsaac, H., Cami, J., Cox, N. L. J., et al. 2022, A&A, 662, A24 [NASA ADS] [CrossRef] [EDP Sciences] [Google Scholar]
- Maier, J. P. 1998, J. Phys. Chem. A, 102, 3462 [NASA ADS] [CrossRef] [Google Scholar]
- Maier, J. P., Walker, G. A. H., & Bohlender, D. A. 2004, ApJ, 602, 286 [CrossRef] [Google Scholar]
- Marlton, S. J. P., Jack T. Buntine, J. T., Liu, C., et al. 2022, J. Phys. Chem. A, 126, 6678 [NASA ADS] [CrossRef] [Google Scholar]
- Marlton, S. J. P., Jack T. Buntine, J. T., Watkins, P., et al. 2023, J. Phys. Chem. A, 127, 1168 [NASA ADS] [CrossRef] [Google Scholar]
- Marlton, S. J. P., Liu, C., Watkins, P., & Bieske, E. J. 2024, Phys. Chem. Chem. Phys., 26, 12306 [NASA ADS] [CrossRef] [Google Scholar]
- Massa, D., Gordon, K. D., & Fitzpatrick, E. L. 2022, ApJ, 925, 19 [NASA ADS] [CrossRef] [Google Scholar]
- McCabe, M. 2019, Astron. Geophys., 60, 4.29 [NASA ADS] [CrossRef] [Google Scholar]
- McCall, B.J., & Griffin, R. E. 2013, Proc. R. Soc. A, https://doi.org/10.1098/rspa.2012.0604 [Google Scholar]
- McGuire, B. A. 2022, ApJS, 259, 30 [NASA ADS] [CrossRef] [Google Scholar]
- McGuire, B. A., Loomis, R. A., Burkhardt, A. M., et al. 2021, Science, 371, 1265 [Google Scholar]
- Merrill, P. W. 1934, PASP, 46, 206 [NASA ADS] [CrossRef] [Google Scholar]
- Merrill, P. W. 1936, PASP, 48, 179 [NASA ADS] [CrossRef] [Google Scholar]
- Merrill, P. W., & Wilson, O. C. 1938, ApJ, 87, 9 [NASA ADS] [CrossRef] [Google Scholar]
- Omont, A. 2016, A&A, 590, A52 [NASA ADS] [CrossRef] [EDP Sciences] [Google Scholar]
- Omont, A., & Bettinger, H. F. 2020, A&A, 637, A74 [NASA ADS] [CrossRef] [EDP Sciences] [Google Scholar]
- Omont, A., & Bettinger, H. F. 2021, A&A, 650, A193 [NASA ADS] [CrossRef] [EDP Sciences] [Google Scholar]
- Pino, T., Ding, H., Güthe, F., & Maier, J. P. 2001, J. Chem. Phys., 114, 2208 [NASA ADS] [CrossRef] [Google Scholar]
- Pino, T., Carpentier, Y., Féraud, G., et al. 2011, EAS Publ. Ser., 46, 355 [NASA ADS] [CrossRef] [EDP Sciences] [Google Scholar]
- Pitzer, K. S., & Clementi, E. 1959, J. Am. Chem. Soc., 81, 4477 [CrossRef] [Google Scholar]
- Puget, J. L., & Leger, A. 1989, ARA&A, 27, 161 [NASA ADS] [CrossRef] [Google Scholar]
- Rademacher, J., Reedy, E. S., & Campbell, E. K. 2022, J. Phys. Chem., A 126, 2127 [NASA ADS] [CrossRef] [Google Scholar]
- Reddy, S. R., Ghosh, A., & Mahapatra, S. 2019, J. Chem. Phys. 151, 054303 [NASA ADS] [CrossRef] [Google Scholar]
- Rice, C. A., & Maier, J. P. 2013, J. Phys. Chem. A, 117, 5 [Google Scholar]
- Rice, C. A., Rudnev, V., Dietsche, R., et al. 2010, AJ, 140, 203 [NASA ADS] [CrossRef] [Google Scholar]
- Salama, F., & Ehrenfreund, P. 2014, The Diffuse Interstellar Bands, IAU Symposium, 297, 364 [NASA ADS] [Google Scholar]
- Salama, F., Bakes, E. L. O., Allamandola, L. J., & Tielens, A. G. G. M. 1996, ApJ, 458, 621 [NASA ADS] [CrossRef] [Google Scholar]
- Salama, F., Galazutdinov, G. A., Krełowski, J., et al. 2011, ApJ, 728, 154 [NASA ADS] [CrossRef] [Google Scholar]
- Sarre, P. J. 2006, J. Mol. Spectrosc., 238, 1 [NASA ADS] [CrossRef] [Google Scholar]
- Shivaei, I., Alberts, S., Florian, M., et al. 2024, A&A, 690, A89 [NASA ADS] [CrossRef] [EDP Sciences] [Google Scholar]
- Siebenmorgen, R., Krełowski, J., Smoker, J., et al. 2020, A&A, 641, A35 [NASA ADS] [CrossRef] [EDP Sciences] [Google Scholar]
- Sita, M. L., Changala, P. B., Xue, C., et al. 2022, ApJ, 938, L12 [NASA ADS] [CrossRef] [Google Scholar]
- Smith, W. H., Snow, T. P., & York, D. G. 1977, ApJ, 218, 124 [CrossRef] [Google Scholar]
- Smith, F. M., Harriott, T. A., Majaess, D., et al. 2021, MNRAS, 507, 5236 [NASA ADS] [CrossRef] [Google Scholar]
- Smith, E. R., Smith, F. M., Harriott, T. A., et al. 2022, RNAAS, 6, 82 [NASA ADS] [Google Scholar]
- Smoker, J. V., Müller, A., Monreal Ibero, A., et al. 2023, A&A, 672, A181 [NASA ADS] [CrossRef] [EDP Sciences] [Google Scholar]
- Snow, T. 1995a, Diffuse Interstellar Bands, 202, 325 [NASA ADS] [CrossRef] [Google Scholar]
- Snow, T. 1995b, Diffuse Interstellar Bands, 202, 379 [NASA ADS] [CrossRef] [Google Scholar]
- Snow, T. P., & McCall, B. J. 2006, ARA&A, 44, 367 [NASA ADS] [CrossRef] [Google Scholar]
- Sonnentrucker, P., York, B., Hobbs, L. M., et al. 2018, ApJS, 237, 40 [NASA ADS] [CrossRef] [Google Scholar]
- Strelnikov, D. V., Link, M., & Kappes, M. M. 2019, J. Phys. Chem. A, 123, 5325 [NASA ADS] [CrossRef] [Google Scholar]
- Taniguchi, K., Gorai, P., & Tan, J. C. 2024, Ap&SS, 369, 34 [NASA ADS] [CrossRef] [Google Scholar]
- Taylor, M. B., 2005, Astronomical Data Analysis Software and Systems XIV, eds. P. Shopbell et al., ASP Conf. Ser. 347, 29 [NASA ADS] [Google Scholar]
- Thaddeus, P. 1995, Diffuse Interstellar Bands, 202, 369 [NASA ADS] [CrossRef] [Google Scholar]
- Thorburn, J. A., Hobbs, L. M., McCall, B. J., et al. 2003, ApJ, 584, 339 [Google Scholar]
- Tielens, A. G. G. M. 2008, ARA&A, 46, 289 [NASA ADS] [CrossRef] [Google Scholar]
- Tielens, A. G. G. M. 2013, Rev. Mod. Phys., 85, 1021 [NASA ADS] [CrossRef] [Google Scholar]
- Tielens, A. G. G. M. 2014, The Diffuse Interstellar Bands, IAU Symposium, 297, 399 [NASA ADS] [Google Scholar]
- Tielens, A. G. G. M., & Snow, T. P. 1995, The Diffuse Interstellar Bands, Astrophysics and Space Science Library (Kluwer), 202 [Google Scholar]
- Tuairisg, S. Ó., Cami, J., Foing, B. H., et al. 2000, A&AS, 142, 225 [NASA ADS] [CrossRef] [EDP Sciences] [Google Scholar]
- van der Zwet, G. P., & Allamandola, L. J. 1985, A&A, 146, 76 [NASA ADS] [Google Scholar]
- Vos, D. A. I., Cox, N. L. J., Kaper, L., Spaans, M., & Ehrenfreund, P. 2011, A&A, 533, A129 [NASA ADS] [CrossRef] [EDP Sciences] [Google Scholar]
- Walker, G. A. H., Bohlender, D. A., Maier, J. P., et al. 2015, ApJ, 812, L8 [NASA ADS] [CrossRef] [Google Scholar]
- Walker, G. A. H., Campbell, E. K., Maier, J. P., et al. 2016, ApJ, 831, 130 [CrossRef] [Google Scholar]
- Wyss, M., Grutter, M., & Maier, J. P. 1999, Chem.. Phys. Lett., 304, 35 [NASA ADS] [CrossRef] [Google Scholar]
- York, D. G. 2024, Res. Astron. Astrophys., 24, 016001 [NASA ADS] [CrossRef] [Google Scholar]
- Zack, L. N., & Maier, J. P. 2014a, The Diffuse Interstellar Bands, IAU Symposium, 297, 237 [NASA ADS] [Google Scholar]
- Zack, L. N., & Maier, J. P. 2014b, Chem. Soc. Rev., 43, 4602 [CrossRef] [Google Scholar]
- Zanolli, Z., Malcıoğlu, O. B., & Charlier, J.-C. 2023, A&A, 675, L9 [NASA ADS] [CrossRef] [EDP Sciences] [Google Scholar]
- Zhang, Y., Sadjadi, S., & Hsia, C.-H. 2020, Ap&SS, 365, 67 [NASA ADS] [CrossRef] [Google Scholar]
James Webb Space Telescope.
Despite the announcement in Fan et al. (2017), it seems that the justification of this statement was never published.
Wide-Field Infrared Survey Explorer.
Note added during the refereeing process. A private communication from A. Witt confirms that both lines of sight show characteristics suggestive of strongly UV-irradiated dust clouds, where photo-processing may play a more significant role than would be typical for interstellar clouds subject to the more average interstellar radiation field. In addition, he suggests that, in both cases, a substantial part of the reddening comes from dust located in the vicinity of the star.
Time-dependent density functional theory.
All Tables
Comparison of Ne-matrix wavelengths of C2p+1 carbon chains with very strong narrow DIBs, λλ5797, 6196, 6613.
All Figures
|
Fig. 1 Correlation diagram for candidate C2 DIBs (blue dots, Table B.3) and possible C2-related DIBs (green diamonds, Table B.4) compared to reference C2 DIBs (black squares, Table B.1), candidate C2 DIBs from the literature (grey diamonds, Table B.2), possible DIBs similar to λ5849 (F5849, cyan triangles), and to a comparison sample of ζ DIBs (Fan et al. 2022, red dots). The horizontal axis displays the normalised anticorrelation Pearson coefficient, kn6009, with the σ DIB λ6009 (excluding the sight lines of HD 175156 and HD 148579). The vertical axis displays the average correlation coefficient, knqC2 (Eq. (3)), with a subsample of six reference C2 DIBs (λλ4726, 4963, 4984, 5418, 5512, and 5546). The selection criteria (Eqs. (4,5); dotted blue lines) distinguish C2 DIBs well from ζ DIBs. Most C2 DIBs and related DIBs are significantly anticorrelated with σ DIBs (kn6009 < 0). See Fig. B.1 for an extended version of this figure, including the DIB labels. |
| In the text | |
|
Fig. 2 Same definitions as for the symbols in Fig. 1 for the correlation diagram of candidate C2 DIBs and possible C2-related DIBs. The horizontal axis displays the average Pearson correlation factor, knqC2 (Eq. (3) and Fig. 1). The vertical axis displays the ratio of the DIB equivalent widths in the sight line of HD 204827 to HD 183143 (Eq. (1); actual values or equivalent values, see Appendix B.3). The selection criteria (Eqs. (4,6); dotted blue lines) distinguish C2 DIBs well from ζ DIBs. Most C2 DIBs and related DIBs have R21 ≥ 1.5. See Fig. B.2 for an extended version of this figure, including DIB labels. |
| In the text | |
|
Fig. 3 Correlation diagram for C2 DIBs with the same symbols and definitions as in Figs. 1–2, where the horizontal axis displays the normalised correlation factor, kn6010 (equivalent to kn6009, Appendix B.3), and the vertical axis displays the ratio of the DIB equivalent widths in the line of sight HD 204827 to HD 183143 (Eq. (1)). Reference ζσ and σ DIBs of Fan et al. (2022) have been added to show the whole range of variation of kn6010 and R21. The selection criteria (Eqs. (5,6); dotted blue lines) distinguish C2 DIBs well from ζ DIBs. The intermediate position of C2-related DIBs (Table B.4, green diamonds) between C2 and ζ DIBs, is clearly visible, as is the peculiar position of two reference DIBs, λλ4726, 5170, and of λ5849 at the boundary of ζ DIBs in Fig. 2 of Fan et al. (2022). |
| In the text | |
|
Fig. 4 Regular correlation coefficients of all APO DIBs with λ5849 vs. λ5797 (excluding the sight lines of HD 175156 and HD 148579). Reference C2, candidate C2, and C2-related DIBs span a sequence distinct from the sequence spanned by the 47 ζ, ζσ, and σ main DIBs of Fan et al. (2022), and 106 other DIBs (orange dots, Table D.1) that are strongly correlated with these main DIBs (Appendix D.1). Other APO DIBs are plotted as small grey squares. |
| In the text | |
|
Fig. 5 Examples of the distribution of the normalised equivalent width (EN) of DIBs detected in various APO sight lines (with correlation fits and normalised Pearson coefficients kn) for three DIBs, including i) (a) two DIBs, λ6128 and λ6087, that are enhanced in the sight line of HD 175156, compared with all other sight lines (Rav(175156) = 3.0 and 3.9, η175 = 4.1 and 7, respectively, Eqs. (7, 8), Table C.1); and ii) (b) a more normal DIB, λ5766, classified as ζ-type (Fan et al. 2022); the intensity of λ5766 in HD 175156, EN(5766), remains comparable with or lower than in some other sight lines (Rav(175156)= 1.2, η175 =0.40). EN(6128) in HD 175156 is out of the correlation fit by a factor ~3. The errors bars for ENi = EWi/E(B − V) are built from the APO uncertainties on the EW and a systematic representative uncertainty on E(B − V) equal to 0.03 mag. |
| In the text | |
|
Fig. 6 Distribution of the reduced enhancement η175 (resp. η148) (Eq. (8)) of the DIB normalised equivalent width, EN, of all DIBs, χa DIBs and χb DIBs, in the sight line of HD 175156 (resp. HD 148579). Both lines of sight have four DIBs with formal values of η> 10.5 (Table C.2 and Fig. A.1). In panel (c), these distributions are compared with more normal EN distributions in HD 183143 and HD 204827, (see also Fig. A.1). The shift δ of the central roughly Gaussian distribution from ENav (Table A.1) is also displayed. |
| In the text | |
|
Fig. 7 Wavelength distribution in bins of 100 Å of the 111 χ DIBs of Tables C.1–C.2, selected based on their enhanced intensity in the sight lines of HD 175156 or HD 148579. For comparison, the inset shows the wavelength distribution for all 559 APO DIBs (see Figs. C.9 and C.10 for the wavelength distribution of χa and χb DIBs, respectively). |
| In the text | |
|
Fig. 8 Comparison of the original band and the first vibronic band of C17H+ chain measured at 6407±3 Å and 6311–6321 Å, respectively, by Marlton et al. (2022, Fig. 5 (top)); and, (bottom), (i) the very broad DIB at 6412.37±0.96 Å, and (ii) the possible very broad DIB observed at about 6314 Å (both are marked by red arrows). The displayed DIB spectrum in the sight line of HD 183143 is copied from the published DIB spectral atlas published by Hobbs et al. (2009). The vertical blue line marks the position of the wavelength of the original band of C17H+ chain within the reported spectrum of HD 183143. The horizontal blue and red double arrows show the reported uncertainties on the measured values of the wavelengths of the origin band of C17H+ and of the APO DIB λ6412, respectively. |
| In the text | |
|
Fig. A.1 Distribution of the reduced enhancement η (Eq. 8) of the DIB normalised equivalent width, EN, in all 25 APO sight lines. In each histogram, red arrows mark the position of η-δ = ±2, where δ is the shift of the central roughly Gaussian distribution from ENav (Table A.1). The line of sight of HD 175156 has four DIBs with formal values of η175 − 14, 15, 17 and 35 (Table C.1) − outside of the range displayed here (−3 < η <10.5). The line of sight of HD 148579 has four DIBs with formal values of η148 − 11, 13, 16 and 32 (Table C.2) − outside of this range. |
| In the text | |
|
Fig. B.1 Correlation diagram for candidate C2-DIBs (blue dots, Table B.3) and possible C2-related DIBs (green diamonds, Table B.4), comparing them to reference C2-DIBs (black squares, Table B.1), candidate C2-DIBs from the literature (grey diamonds, Table B.2), possible DIBs similar to λ5849 (F5849, cyan triangles) and a comparison sample of ζ DIBs (red dots). The horizontal axis displays the normalised anticorrelation Pearson coefficient, kn6009, with the σ DIB λ6009 (excluding the sight lines of HD 175156 and HD 148579). The vertical axis displays the average correlation coefficient, knqC2 (Eq. 3), with a subsample of six reference C2 DIBs (λλ4726, 4963, 4984, 5418, 5512 and 5546). It is seen that the selection criteria (Eqs. (4,6)) discriminate well C2 DIBs from ζ DIBs. Most C2 DIBs and related DIBs are significantly anticorrelated with σ DIBs (kn6009. < 0). See Fig. 1 for a reduced version of this figure without DIB labels. |
| In the text | |
|
Fig. B.2 Same definitions as symbols as Fig. B.1 for the correlation diagram of solid candidate C2-DIBs and possible C2-related DIBs. The horizontal axis displays the average normalised Pearson correlation factor, knqC2 (Eq. 3 and Fig. B.1). The vertical axis displays the ratio of the DIB equivalent widths in the sight line of HD 204827 to HD 183143 (Eq. 1; actual values or equivalent values, see Appendix B.3). It is seen that the selection criteria (Eqs. [4,5], dotted blue lines) discriminate well C2 DIBs from ζ DIBs. Most C2 DIBs and related DIBs have R21 ≥ 1.5. See Fig. 2 for a reduced version of this figure without DIB labels. |
| In the text | |
|
Fig. B.3 Wavelength distribution of all 65 C2 DIBs and candidates (Tables B.3–B.4), showing their limitation to λ < 6000 Å for most of them. |
| In the text | |
|
Fig. C.1 Distribution of the ratio Rav(175156) (Eq. 7) [resp. Rav (148579)] of the DIB normalised equivalent widths in the sight line of HD 175156 (resp. HD 148579) to their average in all sight lines, for all detected DIBs (blue), and for χa and χb DIBs (red), respectively (Tables C.1–C.2). |
| In the text | |
|
Fig. C.2 Examples of the intensity distribution of DIBs detected in the various sight lines (similar to Fig. 5, with correlation fits and normalised Pearson coefficients kn) for three DIBs including: a) two DIBs, λ6845 and λ5862, that are enhanced in the sight line of HD 148579, compared with all other sight lines (Rav(148579) = 3.3 and 2.8, respectively); and b) a more normal DIB, λ5780, classified as σ-type (Fan et al. 2022); the intensity of λ5780 in HD 148579 remains comparable with or lower than some other sight lines (Rav(148579) = 0.87). |
| In the text | |
|
Fig. C.3 Examples of significant, but indeterminate, correlations in the sight lines of HD 175156 and HD 148579 (with correlation fits and formal Pearson coefficients kn ≥ 0.8). In all cases, it is estimated that a conservative lower limit of the actual value of kn is 0.5. |
| In the text | |
|
Fig. C.4 Examples of estimated lower limits for indeterminate normalised Pearson correlation coefficients, in the insert: knall, formal coefficient with all sight lines (displayed fit); knwoo, formal coefficient excluding the sight lines of HD 175156 and HD 148579; kn, estimated lower limit (Tables C.1–C.2). Note the large differences between the values of knall and knwoo. |
| In the text | |
|
Fig. C.5 Distribution of normalised equivalent width and width, FWHM, of χa and χb DIBs: a) Distribution of EN175156 of χa DIBs in the sight line of HD 175156 and of EN1148579 of χb DIBs in the sight line of HD 148579; b) Distribution of average value of EN, ENav, over all sight lines, for all DIBs and for χa and χb DIBs; c) Distribution of the widths of χa and χb DIBs. |
| In the text | |
|
Fig. C.6 Average lower-limit values of normalised correlation coefficients kn, for the χa DIBs (green bars) and the χb DIBs (red bars), with: a) three χa DIBs λλ6087, 6093, 6128 (kn175, Table C.1, Eq. C.2); b) three χb DIBs λλ5257, 6412, 6845 (kn148, Table C.2, Eq. C.3); c) three χ DIBs that might be carried by a carbon chain or ring, λλ5419, 6128 & 6412 (knchr, Tables C.1–C.2, Eq. C.1). |
| In the text | |
|
Fig. C.7 Correlation diagram for 79 χa DIBs (Table C.1) and 43 χb DIBs (Table C.2), compared with C2 reference and candidate DIBs and C2-related DIBs (Tables B.3–B.4), and reference main ζ, ζσ and σ DIBs from Fan et al. (2022). The vertical axis displays the ratio R21 of the DIB equivalent widths in the sight line of HD 204827 to HD 183143 (actual values or equivalent values, see Appendix B.3). In the top (resp. bottom) panel, the horizontal axis displays the anticorrelation factor, kn6010, equivalent to kn6009 (resp. q6010, equivalent to q6009) (excluding the sight lines of HD 175156 and HD 148579). The comparison of the top and bottom panels visualises the difference between kn6010 and q6010. |
| In the text | |
|
Fig. C.8 Regular correlation coefficients q with λ5797 versus λ5849 (excluding the sight lines of HD 175156 and HD 148579) for: i) χa and χb DIBs (Tables C.1–C.2); ii) the same comparison samples as Fig. C.7; and iii) the additional sample of 106 DIBs of Table D.1 that are strongly correlated with the main DIBs (Appendix D.1, pink small dots). |
| In the text | |
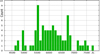 |
Fig. C.9 Same as Fig. 7, for the wavelength distribution of the 79 χa DIBs of Table C.1. |
| In the text | |
 |
Fig. C.10 Same as Figs. 7 & C.9, for the wavelength distribution of the 43 χb DIBs of Table C.2 |
| In the text | |
Current usage metrics show cumulative count of Article Views (full-text article views including HTML views, PDF and ePub downloads, according to the available data) and Abstracts Views on Vision4Press platform.
Data correspond to usage on the plateform after 2015. The current usage metrics is available 48-96 hours after online publication and is updated daily on week days.
Initial download of the metrics may take a while.