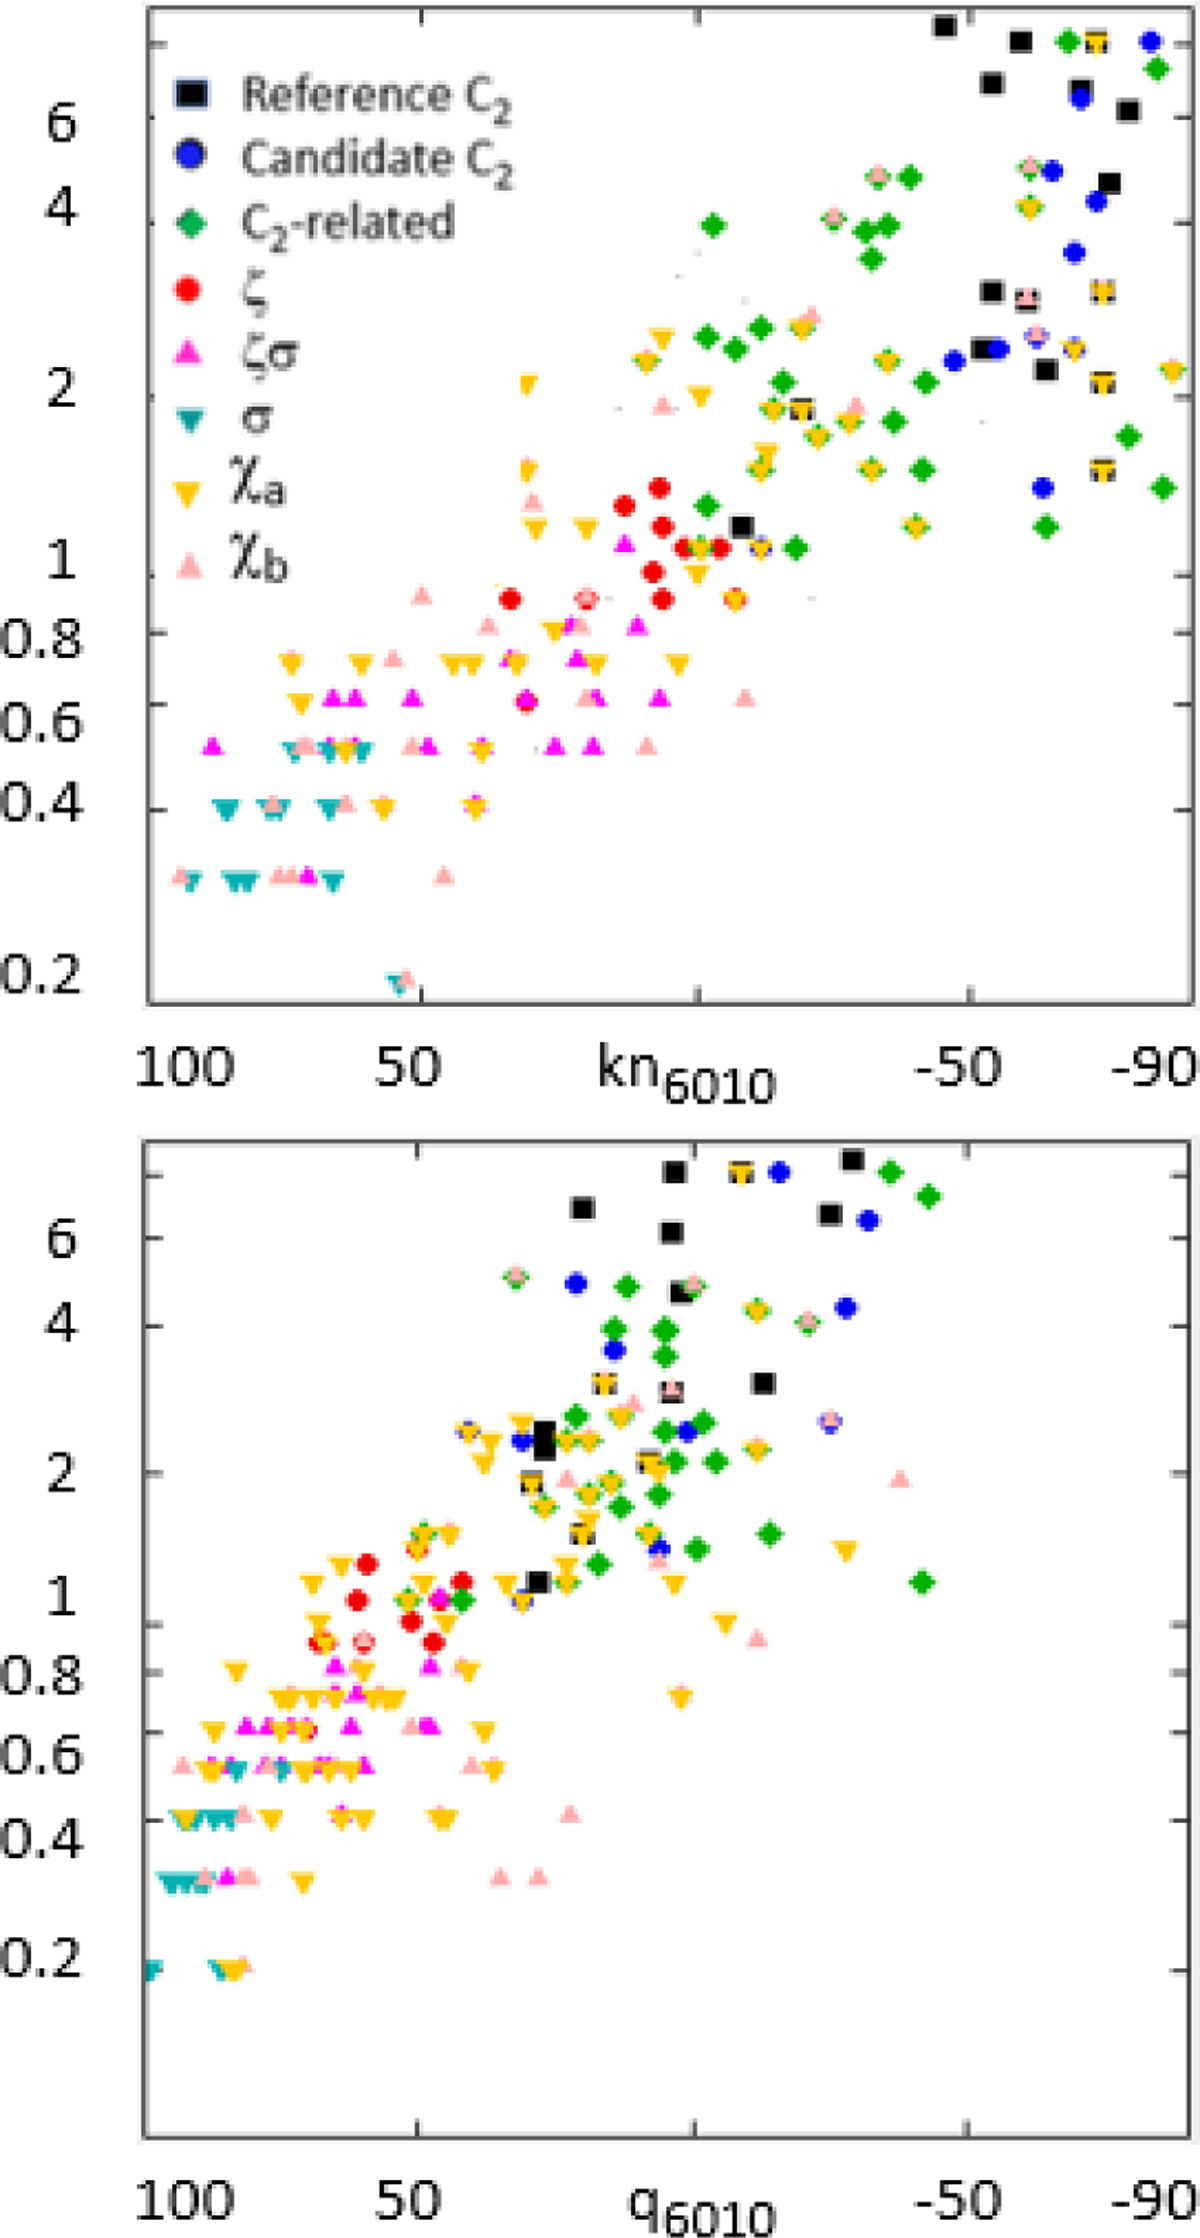
Fig. C.7
Download original image
Correlation diagram for 79 χa DIBs (Table C.1) and 43 χb DIBs (Table C.2), compared with C2 reference and candidate DIBs and C2-related DIBs (Tables B.3–B.4), and reference main ζ, ζσ and σ DIBs from Fan et al. (2022). The vertical axis displays the ratio R21 of the DIB equivalent widths in the sight line of HD 204827 to HD 183143 (actual values or equivalent values, see Appendix B.3). In the top (resp. bottom) panel, the horizontal axis displays the anticorrelation factor, kn6010, equivalent to kn6009 (resp. q6010, equivalent to q6009) (excluding the sight lines of HD 175156 and HD 148579). The comparison of the top and bottom panels visualises the difference between kn6010 and q6010.
Current usage metrics show cumulative count of Article Views (full-text article views including HTML views, PDF and ePub downloads, according to the available data) and Abstracts Views on Vision4Press platform.
Data correspond to usage on the plateform after 2015. The current usage metrics is available 48-96 hours after online publication and is updated daily on week days.
Initial download of the metrics may take a while.