Fig. 7
Download original image
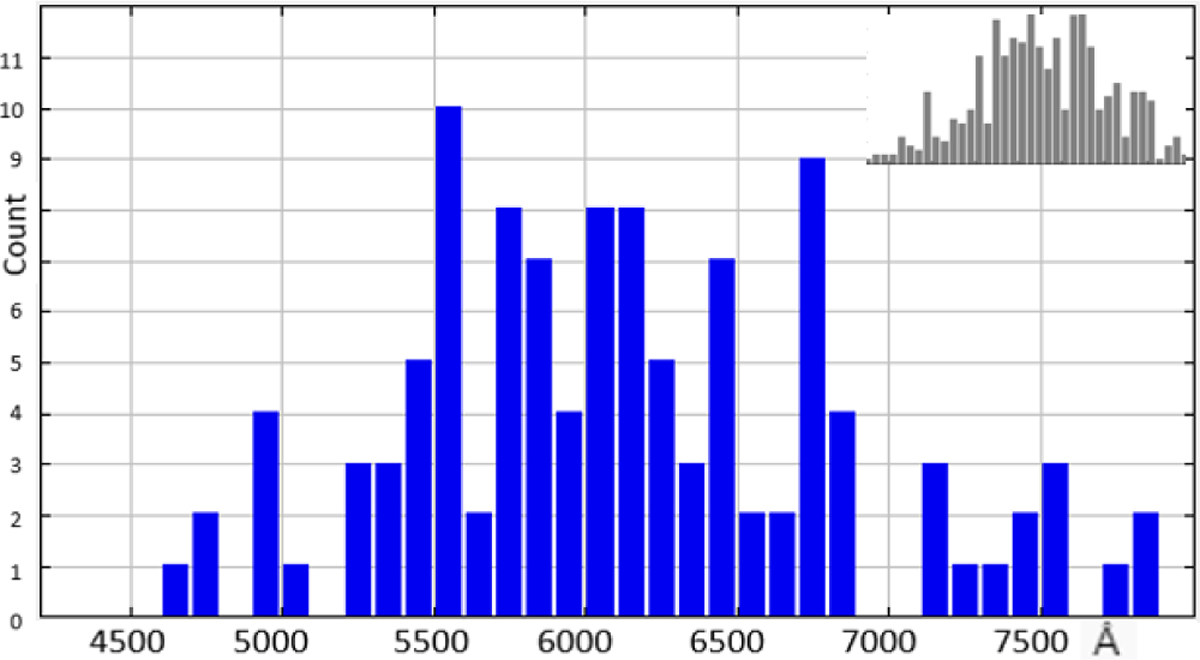
Wavelength distribution in bins of 100 Å of the 111 χ DIBs of Tables C.1–C.2, selected based on their enhanced intensity in the sight lines of HD 175156 or HD 148579. For comparison, the inset shows the wavelength distribution for all 559 APO DIBs (see Figs. C.9 and C.10 for the wavelength distribution of χa and χb DIBs, respectively).
Current usage metrics show cumulative count of Article Views (full-text article views including HTML views, PDF and ePub downloads, according to the available data) and Abstracts Views on Vision4Press platform.
Data correspond to usage on the plateform after 2015. The current usage metrics is available 48-96 hours after online publication and is updated daily on week days.
Initial download of the metrics may take a while.