Fig. 1

Download original image
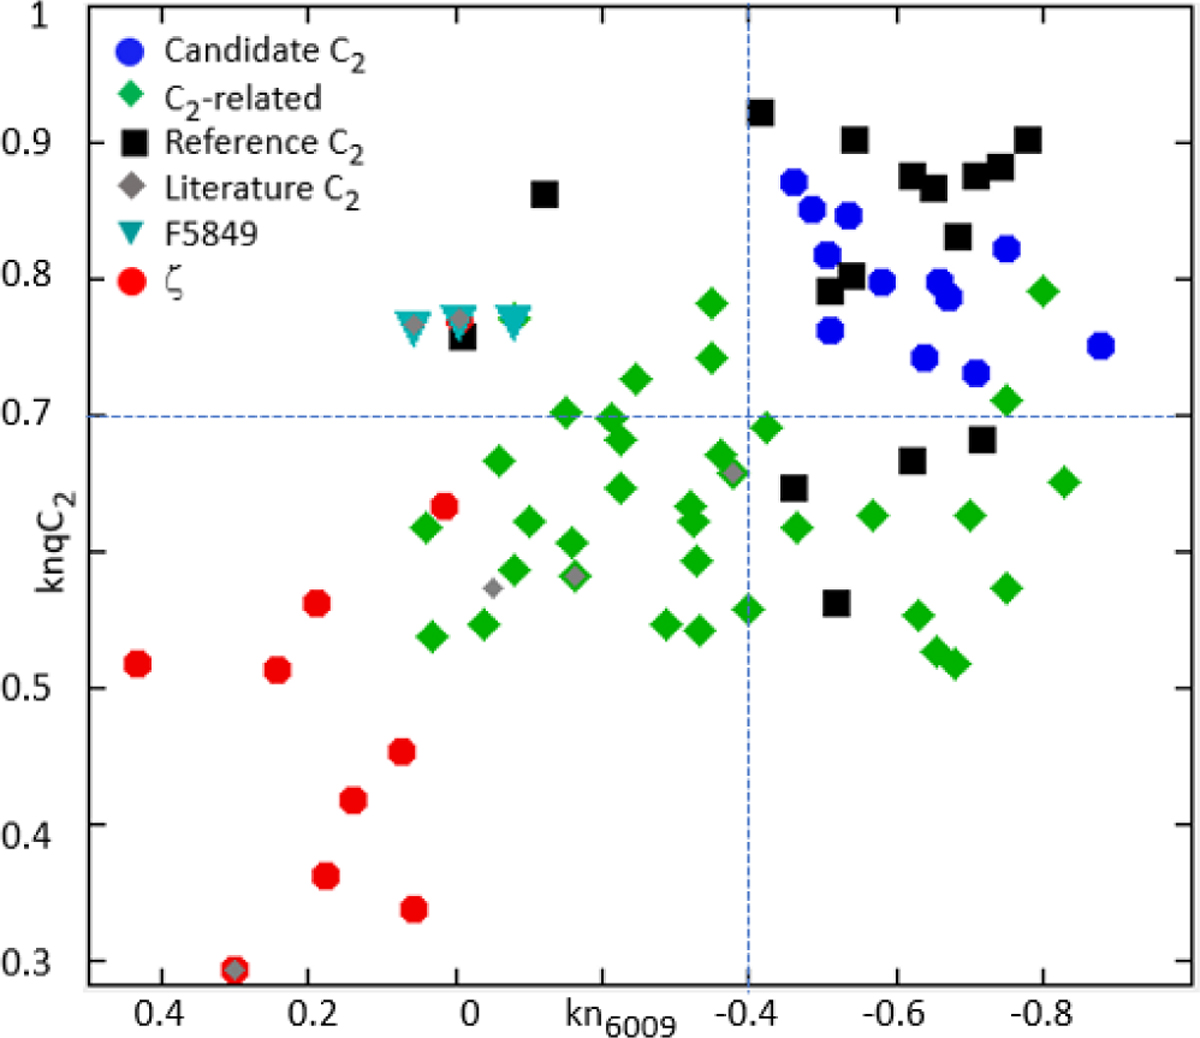
Correlation diagram for candidate C2 DIBs (blue dots, Table B.3) and possible C2-related DIBs (green diamonds, Table B.4) compared to reference C2 DIBs (black squares, Table B.1), candidate C2 DIBs from the literature (grey diamonds, Table B.2), possible DIBs similar to λ5849 (F5849, cyan triangles), and to a comparison sample of ζ DIBs (Fan et al. 2022, red dots). The horizontal axis displays the normalised anticorrelation Pearson coefficient, kn6009, with the σ DIB λ6009 (excluding the sight lines of HD 175156 and HD 148579). The vertical axis displays the average correlation coefficient, knqC2 (Eq. (3)), with a subsample of six reference C2 DIBs (λλ4726, 4963, 4984, 5418, 5512, and 5546). The selection criteria (Eqs. (4,5); dotted blue lines) distinguish C2 DIBs well from ζ DIBs. Most C2 DIBs and related DIBs are significantly anticorrelated with σ DIBs (kn6009 < 0). See Fig. B.1 for an extended version of this figure, including the DIB labels.
Current usage metrics show cumulative count of Article Views (full-text article views including HTML views, PDF and ePub downloads, according to the available data) and Abstracts Views on Vision4Press platform.
Data correspond to usage on the plateform after 2015. The current usage metrics is available 48-96 hours after online publication and is updated daily on week days.
Initial download of the metrics may take a while.


