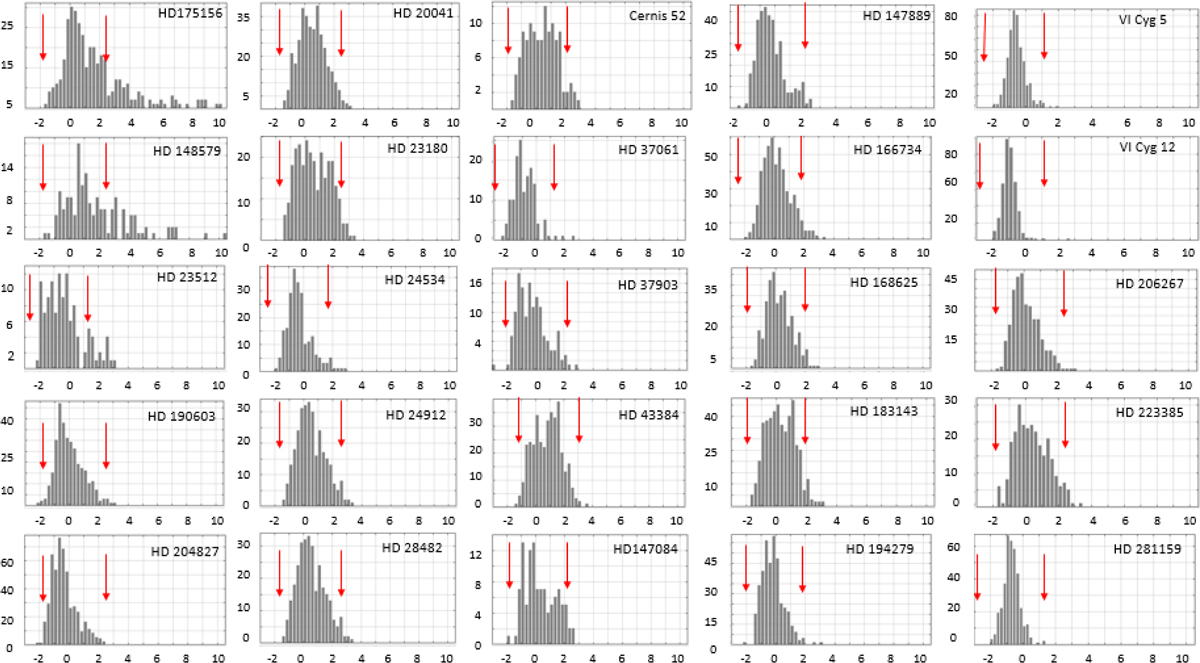
Fig. A.1
Download original image
Distribution of the reduced enhancement η (Eq. 8) of the DIB normalised equivalent width, EN, in all 25 APO sight lines. In each histogram, red arrows mark the position of η-δ = ±2, where δ is the shift of the central roughly Gaussian distribution from ENav (Table A.1). The line of sight of HD 175156 has four DIBs with formal values of η175 − 14, 15, 17 and 35 (Table C.1) − outside of the range displayed here (−3 < η <10.5). The line of sight of HD 148579 has four DIBs with formal values of η148 − 11, 13, 16 and 32 (Table C.2) − outside of this range.
Current usage metrics show cumulative count of Article Views (full-text article views including HTML views, PDF and ePub downloads, according to the available data) and Abstracts Views on Vision4Press platform.
Data correspond to usage on the plateform after 2015. The current usage metrics is available 48-96 hours after online publication and is updated daily on week days.
Initial download of the metrics may take a while.