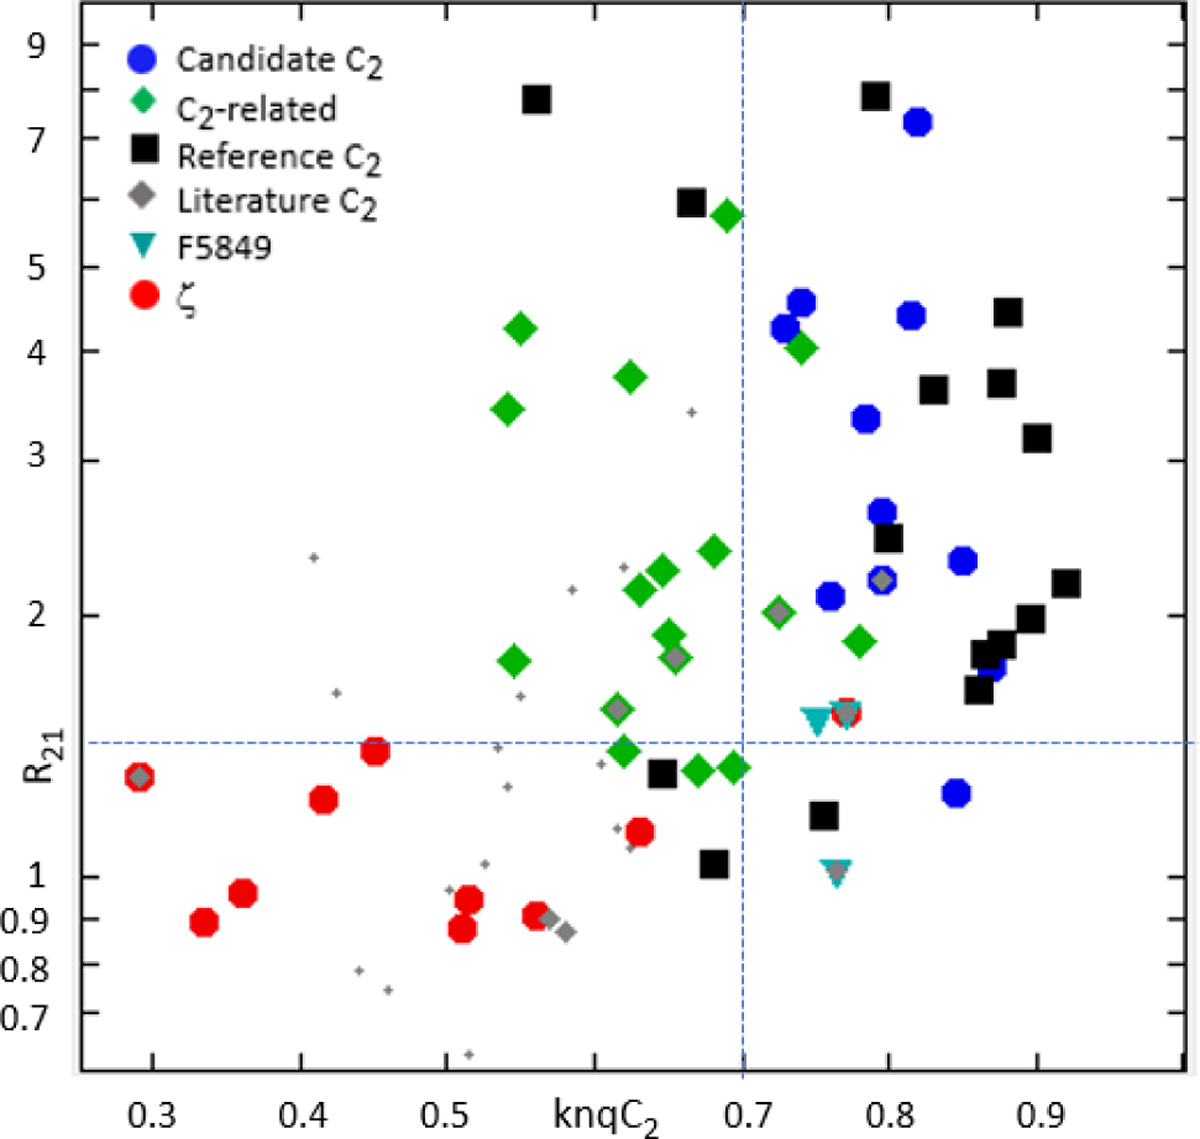
Fig. 2
Download original image
Same definitions as for the symbols in Fig. 1 for the correlation diagram of candidate C2 DIBs and possible C2-related DIBs. The horizontal axis displays the average Pearson correlation factor, knqC2 (Eq. (3) and Fig. 1). The vertical axis displays the ratio of the DIB equivalent widths in the sight line of HD 204827 to HD 183143 (Eq. (1); actual values or equivalent values, see Appendix B.3). The selection criteria (Eqs. (4,6); dotted blue lines) distinguish C2 DIBs well from ζ DIBs. Most C2 DIBs and related DIBs have R21 ≥ 1.5. See Fig. B.2 for an extended version of this figure, including DIB labels.
Current usage metrics show cumulative count of Article Views (full-text article views including HTML views, PDF and ePub downloads, according to the available data) and Abstracts Views on Vision4Press platform.
Data correspond to usage on the plateform after 2015. The current usage metrics is available 48-96 hours after online publication and is updated daily on week days.
Initial download of the metrics may take a while.