| Issue |
A&A
Volume 689, September 2024
|
|
|---|---|---|
| Article Number | A339 | |
| Number of page(s) | 17 | |
| Section | Interstellar and circumstellar matter | |
| DOI | https://doi.org/10.1051/0004-6361/202449874 | |
| Published online | 23 September 2024 | |
Confirming the explosive dispersal outflow in DR21 with ALMA
1
Instituto Argentino de Radioastronomía (CCT- La Plata, CONICET, CICPBA, UNLP),
C.C. No. 5, 1894 Villa Elisa,
Buenos Aires,
Argentina
2
Instituto de Radioastronomía y Astrofísica. Universidad Nacional Autónoma de México,
58090
Morelia,
Michoacán,
Mexico
3
Center for Astrophysics and Space Astronomy, Department of Astrophysical and Planetary Sciences University of Colorado,
Boulder,
CO
80389,
USA
Received:
6
March
2024
Accepted:
18
June
2024
Abstract
We present Atacama Large Millimeter/submillimeter Array (ALMA) 1.3 mm continuum and CO (2–1) line emission observations toward the high-mass star formation region DR21. Five new continuum sources are found. We identify 18 outflow streamers detected in CO emission that radially arises from a common origin. The velocity spread of the outflow streamers ranges between −100 and +70 km s−1. The radial velocities of each outflow roughly follow linear gradients (Hubble–Lemaître–like expansion motions). Using the CO emission of the whole ensemble of streamers, we estimate a total outflow mass of 120−210 M⊙. Additionally, we derived the dynamical age (8600 yr), momentum (~103 M⊙ km s−1), and kinetic energy (~1048 erg) of the outflow. The morphology and kinematics presented by the CO outflow streamers confirm an explosive dispersal outflow at the heart of DR21. Five dispersal explosive outflows associated with massive star-forming regions have been confirmed in our Galaxy (Orion BN/KL, G5.89-0.39, S106-IR, IRAS 16076-5134, and IRAS 12326-6245). However, their occurrence frequency in the Galaxy and their origin are still uncertain.
Key words: stars: formation / ISM: jets and outflows / ISM: individual objects: DR 21
Corresponding author; This email address is being protected from spambots. You need JavaScript enabled to view it.
© The Authors 2024
 Open Access article, published by EDP Sciences, under the terms of the Creative Commons Attribution License (https://creativecommons.org/licenses/by/4.0), which permits unrestricted use, distribution, and reproduction in any medium, provided the original work is properly cited.
This article is published in open access under the Subscribe to Open model. This email address is being protected from spambots. You need JavaScript enabled to view it. to support open access publication.
1 Introduction
Explosive dispersal outflows have become a new phenomenon that is observed in the star-forming regions of massive stars (Bally et al. 2017; Zapata et al. 2020; Guzmán Ccolque et al. 2022). Their morphological and kinematic features distinguish them from classical bipolar outflows (Zapata et al. 2017). The explosive dispersal outflows seem to be impulsive and may be created by an energetic single and brief event (Zapata et al. 2009). These outflows consist of dozens of collimated CO outflow streamers1, [FeII] fingertips, and H2 wakes pointing back approximately to a central position (see the case of Orion BN/KL, Zapata et al. 2009; Bally et al. 2017; McCaughrean & Pearson 2023). The CO streamers are quasi-radially distributed and appear nearly isotropic in the sky. They present well-defined linear velocity gradients, resembling Hubble–Lemaître velocity laws. In the case of Orion BN/KL, the dynamic ages of most CO streamers are close to 550 yr, coincident with the age of the probable disruption of a nonhierarchical massive and young stellar system (Gómez et al. 2005, 2008; Bally et al. 2020). The location of the disruption of this stellar system could be traced down from the positions and proper motions of the main young stellar objects, which are found to recede from each other (Rodríguez et al. 2005; Gómez et al. 2005; Bally et al. 2020). The probable cause that leads to the ejection of these stars is a dynamic interaction between the members of the original compact stellar system (Bally et al. 2011).
The nature of dispersal explosive outflows is still debated, but a few ideas have been proposed, such as a protostellar merger or the disintegration of a disk in a close encounter (Raga et al. 2021; Rivera-Ortiz et al. 2021). Henceforth, the origin of the explosive event and its causes can only be revealed by meticulously analyzing the stellar remnants and the streamers, including their positions, velocities, masses, disks, jets, and other pertinent factors (Rivera-Ortiz et al. 2019) that can be reproduced by numerical models (Rodríguez-González et al. 2023). Atacama Large Millimeter/submillimeter Array (ALMA) observations showed several well-defined collimated molecular streamers in Orion BN/KL (Bally et al. 2017), G5.89-0.39 (Zapata et al. 2020), IRAS 16076-5134 (Guzmán Ccolque et al. 2022), and IRAS 12326-6245 (Zapata et al. 2023). Zapata et al. (2013b) reported another explosive dispersal outflow in DR21, and more recently, Bally et al. (2022) found another outflow in Sh106-IR. The explosion centers in G5.89-0.39, DR21, and Sh106 are dominated by the ionizing emission of ultracompact and more evolved HII regions, which hide the sources and hamper the interpretation of the cause of the explosion at millimeter wavelengths. The estimated rate of explosive dispersal outflows (based on the few identified cases) is comparable to that of supernovae (one event every ~100 years, Guzmán Ccolque et al. 2022), which suggests that dispersal outflows may have a large impact in several respects on the way in which some massive stars form or evolve at their early times.
DR21 is a region of massive star formation that is part of the Cygnus X region (Chandler et al. 1993). According to measurements made with the Very Long Baseline Array using trigonometric parallaxes and proper motions of methanol and water masers, the distance to DR21 is 1.5±0.07 kpc (Rygl et al. 2012). Dickel et al. (1978) proposed that at large scales, the W75 cloud and the DR21 cloud interact. The target region of DR21 comprises several compact HII regions (Harris 1973) and a well-studied classical outflow that is associated with them (e.g. Garden et al. 1991a; Russell et al. 1992). Two cometary HII regions are observed in DR21, one compact in the north (D) and the other, more extended, in the south, which has been resolved into three compact condensations (A, B, and C, Harris 1973; Roelfsema et al. 1989; Cyganowski et al. 2003). DR21 produces a powerful and very prominent infrared molecular bipolar outflow (Garden et al. 1991b; Garden & Carlstrom 1992; Cruz-González et al. 2007). It exhibits shocked molecular hydrogen emission, which is extended in an east-west direction with the redshifted material being found to the east (Garden et al. 1991a; Davis & Smith 1996; Smith et al. 1998). The outflow shocks are thought to produce methanol abundance enhancements that cause the detection of maser emission (Liechti & Walmsley 1997). Recent observations with NOEMA showed the spatial distribution of several molecular tracers, including HCO+, HCN, HNC, N2H+, H2CO, and CCH. The HCO+ emission shows overlapping blue- and redshifted lobes (Skretas et al. 2023). This outflow is one of the most massive and energetic outflows observed in the Galaxy (Garden et al. 1991b). Zapata et al. (2013b) suggested that an additional explosive outflow is emitted from the same compact HII regions that drive the classical bipolar outflow. This explosive outflow took place about 10 000 years ago. CO (2−1) Submillimeter Array observations revealed about 25 molecular blue- and redshifted collimated streamers. All streamers appear to point toward a common center. The radial velocity along each streamer roughly follows Hubble–Lemaître laws.
Using high angular resolution and sensitive band 6 ALMA observations, we studied the CO molecular emission of the DR21 outflows. We detected emission from the bipolar outflow and confirm the explosive nature of 19 outflow streamers. The paper is organized as follows. In Section 2, we present the ALMA observations. The identification of the 1.3 mm continuum sources, the CO (2−1) outflow streamers, and the new location of the origin of these streamers are presented in Section 3. A brief discussion of the nature of the explosive dispersal outflow and the classical bipolar outflow in DR21 can be found in Section 4. The conclusions of this study are presented in Section 5.
Summary of the band 6 ALMA observations of DR21 (project 2019.1.00263.S).
2 ALMA observations
The observations obtained with ALMA consist of a mosaic with the 12m antenna array in band 6 on DR21. The mosaic was constructed with 41 pointings that were distributed in a Nyquist-sampled grid, and it carried out under program 2019.1.00263.S (PI: John Bally). DR21 was observed in two sessions (see Table 1) on 29 April 2021 (with 42 antennas) and 6 May 2021 (with 44 antennas), totaling approximately 100 min on-source. The maximum baselines for the two observing sessions were 1.3 and 2.5 km, respectively. The average precipitable water vapor was 0.2mm and 1.1 mm, and the average system temperature was 83 and 113 K for both dates, respectively. The coordinates of the mosaic center were (α, δ)J2000.0 = 20h39m01.256s, +42°19′30.7″.
For all observations, the spectral windows were centered at 231.121, 217.704, and 220.012 GHz so that they covered the transitions CO (2−1), SiO(5−4) and 13CO(2−1) at 231.121, 217.704 and 220.012 GHz, respectively. The fourth spectral window was centered at 233.013 GHz for continuum purposes. In this work, we focus on the 1.3 mm continuum and on the CO (2−1) line emission (see Figure 1). J2007+4029 was used as the phase calibrator, and J2253+1608 and J1924-2914 was used both as the bandpass and flux calibrator.
The data were calibrated following standard procedures using the pipeline provided by the ALMA staff. The continuum image was constructed using the tclean task of CAS A version 6.4.3.27, and the CO (2−1) cube was downloaded directly from the ALMA Science Archive Products. The cleaning process of the continuum image was performed manually by applying the Högbom algorithm with a Briggs weighting and by setting the robust parameter to 0.5. The rms noise level in the continuum image is 0.06 mJy beam−1 and the angular resolution is 0″.74 × 0″.29 (PA= 1.6°). The original angular resolution of the CO velocity cube from the ALMA archive is 1.26 km s−1. We measured an rms noise level of 5 mJy beam−1 per channel, and the angular resolution is 0″.66 × 0″.24 (PA= 3.3°). We further prepared a five-channel binned version of the CO cube with 6.3 km s−1 channels, which we used to estimate the outflow mass and energetics (Section 3.2).
3 Results
3.1 Millimeter-continuum sources
Figure 2 shows the positions of ten 1.3 mm continuum sources detected with ALMA in DR21. We considered structures with sizes equal to or larger than the beam size and flux densities greater than 5σ ~0.3 mJy beam−1 as criteria for identifying continuum sources (here, σ was estimated by analyzing the empty background emission). The continuum map mainly shows two extended emission sources (of cometary appearance) and several compact sources. The extended sources correspond to the two well-known compact HII regions. The southernmost source comprises fragments labeled A, B, and C, and the northern source is labeled D. All of these components have been identified previously, and their emission at 1.3 mm is most likely associated with free-free emission (Harris 1973; Cyganowski et al. 2003). Five new compact sources with effective radii greater than 0.7″ (beam major axis) are identified in this work. These new sources are labeled with numbers sorted by their right ascension. Table 2 presents the position, source size, peak intensity, and integrated flux of these compact continuum sources. These parameters and their uncertainties were estimated by fitting 2D Gaussians using the CAS A task imfit.
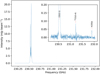 |
Fig. 1 ALMA spectrum of the spectral window centered at 231.121 GHz. The CO line at 230.54 GHz can be identified with a peak intensity of ~20 mJy beam−1. The line absorption is deep because the cloud harbors DR21. In addition, two lines of lower intensity (lower by ~10 orders of magnitude) are identified: 13CS (5−4) at 231.222 GHz and H(30)α at 231.908 GHz. |
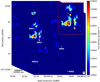 |
Fig. 2 1.3 mm continuum emission toward DR21 in color-scale and white contours (at 5, 10, 15, and 20 times the rms noise level of 0.06 mJy beam−1). The synthesized beam in the bottom right corner is 0″.74 × 0″.29 (PA= 1.6°). The new millimeter compact continuum sources reported here are labeled MM1-MM5, and the cometary sources follow the notation used in Harris (1973). The central squared region is zoomed in in the top right inset, which includes the position of the possible explosion center, which is marked with a yellow square (see Section 3.3). |
3.2 Outflow identification, kinematics, and energetics
Our high angular resolution CO (2−1) observations revealed new molecular filaments or streamers with different orientations in the inner region of DR21 (see Figures 3–6, and also Appendix B). Some of these streamers agree very well with those found by Zapata et al. (2013b) using the SMA. These authors analyzed a field of view that was three times larger than the data presented here, which were taken with ALMA. All of these molecular streamers appear to emerge from a common center (yellow square in Figures 3 and 4; also see Section 4) and are contained within a circle of radius ~30″ (~0.2 pc, assuming the distance to DR21 to be 1.5 kpc). The position of the center does not coincide with any of the continuum sources. In Figure 3, we show the CO (2−1) molecular emission detected in the ALMA mosaic toward DR21 overplotted on the 1.3 mm continuum emission (grayscale and green contours) as red and blue circles. As criteria for identifying the circles, hereafter called condensations, we used structures with a CO emission above 20 mJy beam−1 (emission over 4σ threshold), and sizes similar to the beam minor axis. The condensations were identified after careful manual inspection of the velocity cube on a channel-by-channel basis. We avoided the cloud velocity channels (between −26 and +21 km s−1), which were heavily contaminated by strong extended emission and also presented artifacts and blanked channels that are caused by missing interferometric flux. The position and radial velocity of each condensation were obtained using the Miriad task cgcurs (Sault et al. 1995) and were added to a list of CO condensations. The CO (2−1) blueshifted emission ranges in radial velocity from −25 down to −101 km s−1, and the redshifted emission reaches from +20 up to + 69 km s−1 . After this process of identifying condensations in the entire CO cube, we were able to visually identify some conspicuous linear condensation chains. These chains are coherent spatially and in radial velocity. We call these filament-like structures streamers. In Figure 4 we label eight redshifted (RF1 to RF8) and ten blueshifted streamers (BF1 to BF10). Some of the streamers, both red- and blueshifted, are intertwined in the plane of the sky. They appear to be distributed more or less radially with respect to a common center, and, assuming this center as their origin, none of them seems to have a bipolar counterpart. It is worth noting that there is little or almost no CO emission in the NE-SW direction (see Section 4.3). Moreover, except for the low-velocity central channels of the cube, no CO (2−1) condensations are observed toward the central part of the map. This is because the central channels of the velocity cube, where the parent cloud emission predominates, have been omitted.
The moment-8, moment-9, and moment-2 maps2 of the CO(2−1) line emission for the BF8 streamer are shown in Figure 5 from leftto right. We chose these moment maps overthe more classical moment-0 (integrated intensity) and moment-1 (intensity-weighted velocity) because they highlight the filament morphology and velocity gradients of these structures better. In particular, the BF8 filament morphology is one of the clearest examples in DR21, and we used it to exemplify the main properties of these structures. BF8 runs southeast for about 16″ (24 000 au at the assumed distance to DR21), following a straight path, and comprises more than 50 condensations. Its width varies between 0″.75 and 2″.25 (that is, 1000–3500 au). Its moment-9 map (Figure 5) shows a trend of increasing velocity from the center (yellow square in Figure 3; see also the yellow arrow in the moment-8 image) along the streamer. The moment-2 map describes the dispersion of the CO line, revealing a very wide line width (~30 km s−1) at the tip end of the filament that might be linked to a zone with a strong shock. Figure 6 shows some channels of the CO (2−1) velocity cube of the region where we identified BF8. This velocity cube (between −31.8 and −101.1 km s−1) was constructed by applying a five-channel binning in the spectral axis of the original cube. Hence, the final spectral resolution was 6.3 km s−1. A visual inspection of the velocity cube shows a clear velocity gradient, with CO condensations moving away (to south-east) from the proposed center with increasing velocity. For each of the red- and blueshifted streamers we identified (see Fig. 4), we provide figures analogous to Figure 5 in the Appendix B.
We present a position-velocity diagram of all DR21 filaments in Figure 7, where we plot the projected distance from the center and radial velocity (expressed relative to the parental cloud velocity) of each condensation identified in Figure 3. Each filament is distinguished with a different color and marker. The origin of the diagram (yellow square) corresponds to the new center measured in this paper (see Section 3.3 below). The gray lines represent linear trends between the projected distance and radial velocity. In general, the streamers seem to qualitatively follow these trends, indicating that the velocity of the condensations increases with distance from the common center. It is worth noting that this kinematic behavior (a linear increase in velocity with distance from the center) is one of the most distinct signatures of explosive outflows (Zapata et al. 2017). For some other filaments, however, the trend is not that clear, which may be caused by condensations that do not describe the crest of the filamentary structures, the presence of wide arches due to shocks, the CO tracing the sides or walls of the streamers instead of their crest, the overlapping of patches of two or more filaments, or also to the interaction with the surrounding material. Moreover, within a radius of 5″ (75 000 au) from the common origin, we do not detect significant compact CO emission, except in the velocity range close to the cloud velocity. In this specific velocity range (i.e., from −26 to +21 km s−1), the cloud contamination hampers the identification of filaments. On the other hand, at the highest velocities, the projection effects may not be favorable for a clear detection of the filament structures (e.g., if the structures point directly toward the observer, as expected in an isotropic ejection of finger-like outflows).
Because the streamers identified here in DR21 morphologically and kinematically resemble those in other explosive outflows (e.g., those in the Orion BN-KL outflow), we can confirm that the ensemble of 18 streamers most likely constitutes part of a single outflow entity with a common origin, which we can assume was ejected instantaneously. Considering local thermodynamic equilibrium and an optically thin CO emission, we estimated the mass, momentum, and energy of the explosive outflow. We calculated the total mass of the outflow as the sum of the masses of all the filaments in each channel of the CO velocity cube (see Appendix A). Again, we avoided the central channels with cloud contamination and/or missing extended emission. The derived total mass ranges between 120 and 210 M⊙ for 70 and 140 K, respectively. We used this range of temperatures following the advice of F. Navarete (priv. comm., and Navarete 2018; Navarete et al. 2019) based on observations of the CO (7-6) and CO (6-5) lines in a sample of 100 massive clumps. The derived temperatures can be used for outflows from the most luminous protostellar regions, such as DR21 (105–106 L⊙ Garden et al. 1991a; Garden & Carlstrom 1992). Using the same procedures for obtaining the total mass, we calculated the momentum (~103 M⊙ km s−1), and kinetic energy (~1048 erg) of the whole outflow, with values that are accurate within a factor of 2–3. This implies that the outflow emission in DR21 is associated with a very energetic event (Wu et al. 2004). Furthermore, taking ~120″ as the most distant CO emission, that of the tip end of the DF1 filament reported by Zapata et al. (2013b), we estimate a dynamical age of ~8600 yr for the outflow. This value agrees with the kinematic age presented in Zapata et al. (2013b).
Submillimeter continuum sources in DR21.
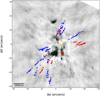 |
Fig. 3 The positions of CO (2−1) condensations in DR21. The background grayscale image and the green contours (at 5, 10, 15, and 20 times the rms noise level of 0.06 mJy beam−1) are the ALMA 1.3 mm continuum image from Figure 2. The red and blue circles correspond to the position of red-and blueshifted CO(2−1) gas condensation that is identified in the velocity cube. The yellow square denotes the position of the explosion center. The synthesized beam is depicted within a box in the bottom right corner. The central position is located at (0″, 0″), corresponding to RA=20h39m01s.1 and Dec=+42°19′ 37″.9. |
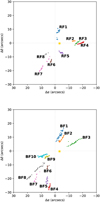 |
Fig. 4 Red- (left panel) and blueshifted (right panel) CO (2−1) gas condensations detected in DR21. The velocities of the blueshifted emission range from −25 to −101 km s−1, and those of the redshifted emission range from +20 to +69 km s−1. The velocities are expressed with respect to the molecular cloud velocity. We identified nine redshifted and ten blueshifted filaments, labeled RF and BF, respectively. The possible origin of all the CO streamers is marked with a yellow square. |
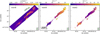 |
Fig. 5 Moment-8, moment-9, and moment-2 maps of CO (2−1) line emission for the streamer BF8 (left, medium, and right, respectively). The black contours represents the CO (2−1) emission at 3, 5, 8, and 10 times therms noise level of 0.2 Jy beam−1 in the moment-8 map. The synthesized beam is shown within a box in the bottom right corner. |
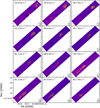 |
Fig. 6 CO (2−1) emission velocity channels of the streamer BF8. The original channels were binned to produce a five-channel binned cube with channel widths of 6.34 km s−1 in width. The black contours represent the emission at 4, 6, 8, and 10 times the rms noise level of 20 mJy beam−1. The green dots represent the condensations identified in the streamer BF8 (see Section 3.2). |
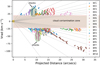 |
Fig. 7 PV diagram of the CO (2−1) emission associated with the set of filaments in DR21. Each filament is represented by a different color and marker. The zeropoint in the diagram (yellow square) corresponds to the new center measured in this paper. The gray lines depict linear trends between the projected distance and radial velocity, starting from a projected distance of 0″ and a radial velocity of 0 km s−1. These lines were constructed by increasing the slope every 5°, within two ranges from 40° to 90° and −40° to −90°. Some streamers appear to follow linear trends, while others exhibits areas of large velocity dispersion, which can be attributed to shock zones (green ellipses) between the streamer and its surrounding material. The pink rectangle indicates the region in which no streamer emission could be distinguished due to contamination from the parent cloud. |
3.3 Estimating the center of the explosive outflow
Figure 8 shows the center of the explosive outflow (green triangle) found by Zapata et al. (2013b) and the new center (yellow square) determined in this work. By connecting the tip ends of the 18 CO streamers to their common center, the drawn lines align well with the orientation and path of each streamer condensation. To find the new center, we used the 6 streamers with the clearest, straightest, and best-defined trajectories: RF2, RF6, RF7, BF2, BF3, and BF8. For each of these streamers, a line was constructed by linear fitting of all their identified CO condensations (see Section 3.2). We then created a pool of intersection points from all the different pairs of streamers, excluding the intersections more than 5″ away from the center that were estimated by Zapata et al. (2013b). The center of the explosive outflow was derived by computing the median of the intersection points (see Figure 9). The new center is at (α, δ)J2000.0 = (20h39m00s.8 ± 00s.2, +42°19′37″.62 ± 0″.97). This position lies within the expanding cometary HII region containing the continuum sources A, B, and C, approximately 1″ north of the edge of source C. Zapata et al. (2013b) suggested that both the explosive outflow and the large cometary HII region in DR21 were likely produced by the same mechanism. A similar scenario is observed in the explosive outflow in G5.89-0.39 (and possibly in IRAS 12326-6245 Zapata et al. 2023), where an expanding shell is centered at the origin of a similar ensemble of explosive outflow streamers (Zapata et al. 2020; Fernández-López et al. 2021). The center estimated by Zapata et al. (2013b) and the new center coincide well within the errors.
4 Discussion
4.1 Confirmation of DR21 as an explosive dispersal outflow
The high angular resolution (~0.7″) ALMA CO (2−1) line emission observations toward DR21 show 18 collimated, high-velocity outflow streamers (with velocities in the range from −100 to +70 km s−1). These streamers appear to emerge quasiradially from a common center, which is probably embedded within a cometary HII region. Red- and blueshifted streamers are observed to overlap spatially in the plane of the sky. Moreover, there seems to be a linear trend between the radial velocity along the streamers and their projected distance in the plane of the sky. A kinematic energy of 1048 erg is estimated for the whole outflow. This is in the range of the energies derived from previously observed explosive outflow events. Furthermore, there is no evidence of infrared sources at the location of the origin of these filaments, and we did not find any millimeter cores coincident with this position. If the DR21 event were similar to the Orion OMC1 event, the stars involved might be expected to be dynamically ejected and are now high-velocity runaway stars. All of these features agree with those found as characteristic signatures in other explosive outflows, which confirms that the outflow found in DR21 is an explosive dispersal outflow, as suggested by Zapata et al. (2013b) from coarser CO(2−1) line observations made with the SMA.
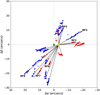 |
Fig. 8 Ensemble of CO streamer condensations identified in DR21. The red circles represent redshifted emission, and the blue circles represent blueshifted emission. The green triangle shows the location of the center as determined by Zapata et al. (2013b), and the yellow square reflects the new position described in this paper. The new position of the center is (α, δ)J2000.0 = 20h39m00s.8 ± 00s.2, +42°19′37″.62 ± 0″.97. The lines were obtained by connecting the tips of the filaments to the center (yellow square). |
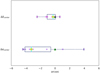 |
Fig. 9 Statistical analysis of the center of the explosive outflow in DR21. Pink circles represent the offsets in RA and Dec with respect to the center reported by Zapata et al. (2013b) of the intersections between pairs of different streamers trajectories (extracted as explained in the text). The position of the origin (0″, 0″) is set at 20h39m01.1s in RA and +42°19′ 37.9″ in Dec. In this paper, the median (yellow square) is considered as the new position of the center of the outflow. The vertical colored line represents the median value, the box represents the interquartile range between the 25th and 75th percentiles, and the vertical lines (the whiskers) show the full range of the data without outliers. |
4.2 Dynamical time of the explosive outflow and event rate in the Milky Way
DR21 has been thought to be the oldest explosive dispersal outflow found in the Milky Way so far. Zapata et al. (2013b) estimated its age to be ~10 000 years. They assumed that the debris from the explosive event would have velocities of about 40 km s−1 and the that streamers are localized at an average distance of 80″ (1.2 × 10⁵ au). In this work, we estimate a similar dynamical time in a slightly different way. We considered that all the ejected streamers move essentially at the same velocity, which translates into a range of maximum radial velocities for differently inclined streamers. We took 100 km s−1 as the outflow, derived from the maximum velocity at which CO emission is observed. We assumed that this would be produced in a streamer ejected in a direction closer to the line of sight. However, this should be taken as a lower limit of the true velocity of the ejection. For this estimate, we assumed that all streamers moved at the same constant speed since their ejection. Assuming the plasmon hypothesis from Rivera-Ortiz et al. (2019), the material at the tip of the streamer decelerates as some mass is detached; however, if the density contrast between the ambient and the bullet is high enough (ρambient/ρbullet ≤ 10−2) and/or if the mass detached from the plasmon is not reduced by a high percentage, the plasmon preserves almost the same velocity since the ejection. Instead, the wake comprises detached and dragged material that progressively decelerates, which explains the observed linear velocity gradients. For the outflow size, we used 120″, the value obtained by Zapata et al. (2017). In this way, we obtained a dynamical age for the outflow of approximately 8600 years. This should be treated as an upper limit because of the velocity derivation mentioned above. Hence, following the same procedure as in the case of the IRAS 16076-5134 outflow (see Guzmán Ccolque et al. 2022), the rate of explosive outflows in the Milky Way is still similar. It should be noted, however, that this is a very crude estimate in which the main uncertainties are the size of the Galaxy, the distance determination to the explosive outflows, and the rough derivation of the outflow dynamical times. Therefore, our conclusion should be that the rate of explosive is on the same order as the supernova rate and the formation rate of massive stars in the Milky Way.
4.3 About the main bipolar outflow in the region
Figure 10 shows the CO (2−1) emission detected with ALMA from the northeast-southwest classical bipolar outflow (contours) in DR21. The colored contours overlie the 1.3 mm continuum emission map (grayscale) and show different structures at different velocities: blue for high-velocity blueshifted emission ([−79:−52] km s−1), green for low-velocity blueshifted emission ([−51:−24] km s−1), and red for redshifted emission ([+31:+69] km s−1). In comparison with the HCO+ observations of Skretas et al. (2023), the ALMA observations do not show much extended emission, but just occasional ribbons and patches. The northeast lobe is hardly recovered, and we do not comment on it here. However, despite the preference for compact- and narrow-only features, the ALMA images show some distinct structures toward the southwest lobe that can help us shed some light on the nature of this classical bipolar outflow.
First, two clear quasi-parallel narrow 45″ structures encompass the body of the outflow. The southernmost edge is traced by green contours (mildly blueshifted velocities), and the northern edge is less delineated and traced by red contours. The two quasi-parabolic edges of the outflow close at a more chaotic tip (called the interaction region in Skretas et al. 2023), about one arcminute from the center of the outflow. This region shows a mixture of blue, green, and red contours (see also Plambeck & Menten 1990, reporting methanol maser emission at this place too). Skretas et al. (2023) discussed based on their molecular and kinematical analysis the possibility that the interaction region, with a mix of high and low red- and blueshifted velocities, could be explained by the sideways motions of the gas produced in strong shocks from an outflow lying close to the plane of the sky.
We propose an alternative scenario, in which several outflowing ejections converge on the so-called interaction region. As we show below, these ejections may originate in the same protostar plus disk system, as occurs in sources such as Cepheus A HW2 or IRAS 15398-3359 (Cunningham et al. 2009; Vazzano et al. 2021). Molecular outflows comprising multiple outflowing ejections in different directions from the same proto-star have been detected in massive stars such as Cepheus A HW2 and G5.90-0.39 (Cunningham et al. 2009; Zapata et al. 2013a; Fernández-López et al. 2021) and low-mass protostars such as IRAS 15398-3359 (Vazzano et al. 2021; Guzmán Ccolque et al. 2024). A multiple system with close passages in highly eccentric orbits, or episodes of strong asymmetric accretion toward part of a disk, have been proposed as causing the periodic tilt of the ejection axis in these systems, producing a collection of outflowing bipolar ejections.
This scenario may reconcile several facts: (i) The very different radial velocities from the cavity walls (a difference of at least 40 km s−1 following Figure 10) may be explained if the outflowing ejections from the same source have slightly different inclinations with respect to the plane of the sky. (ii) The extremely wide opening angle of the outflow measured by Skretas et al. (2023) would in this way be due to the action of several outflowing ejections with different position angles. (iii) The mixture of radial velocities in the interaction zone (Figure 10), with differences of more than 50 km s−1, could be better explained if various outflowing ejections with different orientations were to hit the dense pocket of gas seen previously in N2H+ (Skretas et al. 2023). (iv) Last but not least, the classical infrared H2 images of the DR21 outflow from Cruz-González et al. (2007), for instance, and also the APO3.5 m image (see Figure 11), show that a chaotic complex of arches and bow shocks points in slightly different directions. These different arches are also faintly visible in some of the blueshifted channels of the HCO+ cube presented in Skretas et al. (2023).
4.4 Coexistence of the main bipolar outflow and the explosive outflow
The ALMA data show that toward the DR21 region lie, on the one hand, at least 18 outflow streamers with a common origin that was probably driven by an explosive event (the so-called explosive outflow). On the other hand, various bipolar outflowing ejections were probably launched with slightly different orientations, which form the main northwest-southeast bipolar outflow (the so-called bipolar outflow). The explosive and bipolar outflows are apparently driven by the same region in which the cometary HII regions lie.
The outflowing bipolar ejections have a larger extent than the explosive streamers detected by ALMA. The ejections are also not clearly collimated and do not show linear velocity gradients. Although they show very fast radial velocities, they do not reach the 100 km s−1 shown at the tips of the fastest explosive filaments. These characteristics suggest a different nature and ejection mechanism of the two types of outflows. In addition, we have shown indications that the bipolar outflow may comprise ejections in different directions, as was shown in Cepheus A HW2 (e.g., Cunningham et al. 2009). In the case of Cepheus, the close interactions of a very eccentric noncoplanar companion are thought to tilt the ejection axis and hence drive the outflow in different directions. A similar interpretation has been claimed to explain the arches and loop structures displaying a daisy-like pattern in G5.89-0.39 (Fernández-López et al. 2021). If a multiple system comprising massive protostars were at the center of the DR21 complex, we suggest that a stage characterized by gravitational interactions between its members could produce the periodic tilt of the main bipolar outflow that was present before the explosion. The resulting outflowing ejections may display bow shocks in different directions, a wide range of radial velocities, and a bipolar appearance with a wide opening angle when seen at lower angular resolution. Moreover, the bipolar outflow prior to the explosive event could also explain the lack of explosive streamers in the east-west direction in DR21 because most of the material from the original envelope and parental cloud may have been swept up beforehand.
One current explanation for the production of the explosive outflow is the disintegration of a multiple system with massive protostars or the coalescence of two of its members. It is easy to link the previous scenario with close passages between the members of a closely packed system with a more chaotic outcome, such as the one originating an explosive outflow. In this scenario, the main bipolar outflow in DR21 may be launched by one of the protostars involved in the event, leading to the explosive outflow, and the remnants of its last stages are visible now. This outflow could stop at the same time as the explosive outflow was triggered. The protostars that lie at the center of the HII region, including the region that launched the bipolar outflow, are no longer there. They may have been ejected (as they were in Orion BN/KL) in the chaotic process that triggered the explosive outflow.
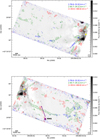 |
Fig. 10 CO (2−1) emission (contours) northeast (upper panel) and southwest (bottom panel) of the explosive outflow at DR21, overlaid with the continuum map at 1.3 mm (grayscale). The colored contours indicate different velocity ranges: blue for velocities between −79 and −52 km s−1, green for velocities between −51 and −24 km s−1, and red for velocities between −31 and +69 km s−1. The contours represent the CO (2−1) emission at 5, 10, 20, and 30 times the rms noise level of 70 mJy beam−1 km s−1. The possible origin of the CO streamers is marked with the yellow square. A redshifted collimated outflow is observed toward the southern edge of the image. The direction of this outflow (violet arrow) seems to indicate that it is associated with the continuum source MM5 (violet star). The synthesized beam of the continuum map is shown within a box in the bottom right corner. |
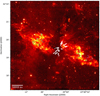 |
Fig. 11 2.12 µm molecular hydrogen emission at DR21 overlaid with CO (2−1) emission (white dots) of the explosive outflow. The H2 emission was obtained using the Apache Point Observatory 3.5 meter telescope and NICFPS near-infrared camera using a 0.5 bandpass filter (PI: John Bally). The yellow square is the center of the outflow. The dashed blue lines trace arc-shaped structures detected in H2. |
4.5 Outflow from MM5
In addition to the main northeast-southwest bipolar outflow or outflows that were ejected by a massive protostar, the several explosive streamers with a common origin associated with the ALMA data reveal a redshifted collimated outflow lobe that crosses part of the southwestern lobe of the main outflow (Figure 10). This newly found outflow runs with a positions angle of 23 deg and is associated with the compact continuum source MM5. Because MM5 is close to the edge of the field of view, its blueshifted counterpart is faint. This counterlobe probably extends beyond the mosaic coverage and may have already been imaged in HCO+ at low blueshifted velocities (see channel at −5 to −10 km s−1 in Figure 3, and integrated emission in Figure 4 of Skretas et al. 2023). This object, comprising a 0.1–1 M⊙ dusty disk or envelope and a classical unperturbed bipolar outflow, is possibly in the foreground or background and does not physically interact with the more powerful outflows in the DR21 region (the dust mass estimate is a very rough estimate following the same assumptions as in Guzmán Ccolque et al. 2022).
5 Conclusions
From sensitive and high angular resolution ALMA CO (2−1) line observations of the DR21 massive star-forming region, we found 18 quasi-radial collimated streamers that seem to emerge from a common center. The radial velocities along each streamer roughly follow linear gradients. Blue- and redshifted streamers are interspersed in similar directions and lack bipolar counterparts. Currently, no known protostars are located at the origin of the streamers. In addition, we estimated a kinetic energy of 1048 erg from the ensemble of outflow streamers. All these features confirm that this outflow is likely an explosive dispersal outflow, as was suggested by Zapata et al. (2013b). We set a new dynamical timescale for the explosive outflow of 8600 years using an expansion velocity of 100 km s−1 and an outflow diameter of 120″.
Regarding the well-known infrared bipolar outflow, the high-angular resolution ALMA observations show a few indications (cavity edges at very dissimilar radial velocities, extremely high blue- and redshifted emission in the so-called interaction region, and arcs and bow shocks with different orientations) that suggest an outflow with multiple ejections in slightly different directions. These bipolar ejections may explain its wide opening angle and the lack of explosive streamers with northeast-southwest orientations. We tried to reconcile these findings with the explosive outflow that apparently emanates from the same source. We speculate that the bipolar and explosive outflow were both possibly driven by the same source. We associate the bipolar outflow with the last stages of a disintegrating multiple system, whose periodic gravitational encounters produced successive tilts in the system until it ceased to be with an explosive event.
Finally, the CO ALMA emission revealed a new outflow associated with one of the five newly detected millimeter cores, MM5. These five compact cores are probably associated with disks and envelopes of young stars.
Acknowledgements
We are very grateful to the anonymous referee for all of the comments and suggestions that helped a lot to improve the text and contents of this work. E.G.C. and M.F.L. are truly grateful for all the support from UNAM’s Instituto de Radioastronomía y Astrofísica of Morelia. M.F.L. has received funding from the European Union’s Horizon 2020 Research and Innovation Programme under the Marie Sklodowska-Curie grant agreement No 734374 (LACEGAL). This paper makes use of the following ALMA data: ADS/JAO.ALMA#019.1.00263.S. ALMA is a partnership of ESO (representing it meMRr states), NSF (USA), and NINS (Japan), together with NRC (Canada), NSC and ASIAA (Taiwan), and KASI (Republic of Korea), in cooperation with the Republic of Chile. The Joint ALMA Observatory is operated by ESO, AUI/NRAO, and NAOJ. Facilities: ALMA, HST. Software: CASA (v6.4.3.27 McMullin et al. 2007), Astropy (Astropy Collaboration et al. 2013), and CARTA 2.0.0 (https://doi.org/18.5281/zenodo.4985459).
Appendix A Outflow mass estimate using the emission of CO
We estimate the mass in each velocity channel as:
 (A.1)
(A.1)
where µ is the mean molecular weight, which is assumed to be equal 2.76 (Yamaguchi et al. 1999), mh is the hydrogen atom mass (~ 1.67 × 10⁻²⁴ɡ), d is the distance to source, Ω is the solid angle of the emitting region, and a CO abundance of XCO=10−4. For to derive the column density of the CO (2−1) transition we use the equation:
![Mathematical equation: $\matrix{ {{N_{tot{\rm{}}}}(CO) = {{3h} \over {8{\pi ^3}\mu _B^2J}}{{{Q_{{\rm{rot}}}}{e^{{E_u}/k{T_{ex}}}}} \over {{e^{hv/k{T_{ex}}}} - 1}}{{\mathop \smallint \nolimits^ {T_B}dv} \over {\left[ {{J_v}\left( {{T_{ex}}} \right) - {J_v}\left( {{T_{bg}}} \right)} \right]}} = } \cr { = {{1.195 \times {{10}^{14}}\left( {{T_{ex}} + 0.922} \right){e^{16.596/{T_{ex}}}}} \over {{e^{11.065/{T_{ex}}}} - 1}}{{{T_B}{\rm{\Delta }}v} \over {{J_v}\left( {{T_{ex}}} \right) - {J_v}\left( {{T_{bg}}} \right)}}} \cr } $](/articles/aa/full_html/2024/09/aa49874-24/aa49874-24-eq2.png) (A.2)
(A.2)
In the expression above we use the Planck’s constant h = 6.6261 × 10⁻²⁷ erg s, the dipole moment µB = 1.1011 × 10⁻¹⁹ StatCcm, the quantum number of the upper level J = 2, the partition function Qrot = kTex/(hB0) + 1/3 with a rigid rotor rotation constant B0 = 57.635968 GHz, the Boltzmann’s constant k = 1.3806−16 er ɡ k−1, the Rayleight-Jeans equivalent temperature Jv(T) = (hv/k)/(ehv/kT − 1), the brightness temperature Texc and TB in K and the channel width Δv in km s−1.
Appendix B Moment maps of CO streamers
Figures B.1–B.4 show the moment-8, moment-9 and moment-2 maps (from left to right) of CO (2−1) line emission for each red-shifted and blue-shifted streamers of DR21 identified in this paper.
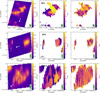 |
Fig. B.1 Moment-8,moment-9 and moment-2 maps (from left to right) of the CO (2−1) redshifted streamers of DR21: RF1, RF2, RF3 and RF4. The black contours represents the CO (2−1) emission at 5, 10, 15 and 20 times the rms noise level for each moment-8 map. The synthesized beam of the CO (2−1) map is shown within a box at the bottom right corner. The white arrow indicates the direction of the center of the explosive outflow. |
References
- Astropy Collaboration (Robitaille, T. P., et al.) 2013, A&A, 558, A33 [NASA ADS] [CrossRef] [EDP Sciences] [Google Scholar]
- Bally, J., Cunningham, N. J., Moeckel, N., et al. 2011, ApJ, 727, 113 [NASA ADS] [CrossRef] [Google Scholar]
- Bally, J., Ginsburg, A., Arce, H., et al. 2017, ApJ, 837, 60 [Google Scholar]
- Bally, J., Ginsburg, A., Forbrich, J., & Vargas-González, J. 2020, ApJ, 889, 178 [NASA ADS] [CrossRef] [Google Scholar]
- Bally, J., Chia, Z., Ginsburg, A., et al. 2022, ApJ, 924, 50 [NASA ADS] [CrossRef] [Google Scholar]
- Chandler, C. J., Gear, W. K., & Chini, R. 1993, MNRAS, 260, 337 [NASA ADS] [Google Scholar]
- Cruz-González, I., Salas, L., & Hiriart, D. 2007, Rev. Mexicana Astron. Astrofis., 43, 337 [Google Scholar]
- Cunningham, N. J., Moeckel, N., & Bally, J. 2009, ApJ, 692, 943 [NASA ADS] [CrossRef] [Google Scholar]
- Cyganowski, C. J., Reid, M. J., Fish, V. L., & Ho, P. T. P. 2003, ApJ, 596, 344 [Google Scholar]
- Davis, C. J., & Smith, M. D. 1996, A&A, 310, 961 [NASA ADS] [Google Scholar]
- Dickel, J. R., Dickel, H. R., & Wilson, W. J. 1978, ApJ, 223, 840 [Google Scholar]
- Fernández-López, M., Arce, H. G., Looney, L., et al. 2014, ApJ, 790, L19 [Google Scholar]
- Fernández-López, M., Sanhueza, P., Zapata, L. A., et al. 2021, ApJ, 913, 29 [CrossRef] [Google Scholar]
- Fernández-López, M., Girart, J. M., López-Vázquez, J. A., et al. 2023, ApJ, 956, 82 [CrossRef] [Google Scholar]
- Garden, R. P., & Carlstrom, J. E. 1992, ApJ, 392, 602 [CrossRef] [Google Scholar]
- Garden, R. P., Geballe, T. R., Gatley, I., & Nadeau, D. 1991a, ApJ, 366, 474 [CrossRef] [Google Scholar]
- Garden, R. P., Hayashi, M., Gatley, I., Hasegawa, T., & Kaifu, N. 1991b, ApJ, 374, 540 [NASA ADS] [CrossRef] [Google Scholar]
- Gómez, L., RodrÍguez, L. F., Loinard, L., et al. 2005, ApJ, 635, 1166 [CrossRef] [Google Scholar]
- Gómez, L., Rodríguez, L. F., Loinard, L., et al. 2008, ApJ, 685, 333 [CrossRef] [Google Scholar]
- Guzmán Ccolque, E., Fernández-López, M., Zapata, L. A., & Baug, T. 2022, ApJ, 937, 51 [CrossRef] [Google Scholar]
- Guzmán Ccolque, E., Fernández López, M., Vazzano, M. M., et al. 2024, A&A, 686, A143 [NASA ADS] [CrossRef] [EDP Sciences] [Google Scholar]
- Harris, S. 1973, MNRAS, 162, 5P [NASA ADS] [Google Scholar]
- Liechti, S., & Walmsley, C. M. 1997, A&A, 321, 625 [NASA ADS] [Google Scholar]
- McCaughrean, M. J., & Pearson, S. G. 2023, A&A, submitted [arXiv:2310.03552] [Google Scholar]
- McMullin, J. P., Waters, B., Schiebel, D., Young, W., & Golap, K. 2007, Astronomical Data Analysis Software and Systems XVI, eds. R. A. Shaw, F. Hill, & D. J. Bell, ASP Conf. Ser., 376, 127 [NASA ADS] [Google Scholar]
- Navarete, F. D. T. 2018, PhD thesis, University of Sao Paulo, Brazil [Google Scholar]
- Navarete, F., Leurini, S., Giannetti, A., et al. 2019, A&A, 622, A135 [NASA ADS] [CrossRef] [EDP Sciences] [Google Scholar]
- Plambeck, R. L., & Menten, K. M. 1990, ApJ, 364, 555 [Google Scholar]
- Raga, A. C., Rivera-Ortiz, P. R., Cantó, J., Rodríguez-González, A., & Castellanos-Ramírez, A. 2021, MNRAS, 508, L74 [CrossRef] [Google Scholar]
- Rivera-Ortiz, P. R., Rodríguez-González, A., Hernández-Martínez, L., Cantó, J., & Zapata, L. A. 2019, ApJ, 885, 104 [NASA ADS] [CrossRef] [Google Scholar]
- Rivera-Ortiz, P. R., Rodríguez-González, A., Cantó, J., & Zapata, L. A. 2021, ApJ, 916, 56 [NASA ADS] [CrossRef] [Google Scholar]
- Rodríguez, L. F., Poveda, A., Lizano, S., & Allen, C. 2005, ApJ, 627, L65 [CrossRef] [Google Scholar]
- Rodríguez-González, A., Rivera-Ortiz, P. R., Castellanos-Ramírez, A., et al. 2023, MNRAS, 519, 4818 [CrossRef] [Google Scholar]
- Roelfsema, P. R., Goss, W. M., & Geballe, T. R. 1989, A&A, 222, 247 [NASA ADS] [Google Scholar]
- Russell, A. P. G., Bally, J., Padman, R., & Hills, R. E. 1992, ApJ, 387, 219 [NASA ADS] [CrossRef] [Google Scholar]
- Rygl, K. L. J., Brunthaler, A., Sanna, A., et al. 2012, A&A, 539, A79 [NASA ADS] [CrossRef] [EDP Sciences] [Google Scholar]
- Sault, R. J., Teuben, P. J., & Wright, M. C. H. 1995, ASP Conf. Ser., 77, 433 [NASA ADS] [Google Scholar]
- Skretas, I. M., Karska, A., Wyrowski, F., et al. 2023, A&A, 679, A66 [NASA ADS] [CrossRef] [EDP Sciences] [Google Scholar]
- Smith, M. D., Eisloffel, J., & Davis, C. J. 1998, MNRAS, 297, 687 [CrossRef] [Google Scholar]
- Vazzano, M. M., Fernández-López, M., Plunkett, A., et al. 2021, A&A, 648, A41 [NASA ADS] [CrossRef] [EDP Sciences] [Google Scholar]
- Wu, Y., Wei, Y., Zhao, M., et al. 2004, A&A, 426, 503 [NASA ADS] [CrossRef] [EDP Sciences] [Google Scholar]
- Yamaguchi, R., Akira, M., & Yasuo, F. 1999, in Star Formation 1999, ed. T. Nakamoto (Nobeyama: Nobeyama Radio Observatory), 383 [Google Scholar]
- Zapata, L. A., Schmid-Burgk, J., Ho, P. T. P., Rodríguez, L. F., & Menten, K. M. 2009, ApJ, 704, L45 [Google Scholar]
- Zapata, L. A., Fernandez-Lopez, M., Curiel, S., Patel, N., & Rodriguez, L. F. 2013a, arXiv e-prints [arXiv:1305.4084] [Google Scholar]
- Zapata, L. A., Schmid-Burgk, J., Pérez-Goytia, N., et al. 2013b, ApJ, 765, L29 [NASA ADS] [CrossRef] [Google Scholar]
- Zapata, L. A., Schmid-Burgk, J., Rodríguez, L. F., Palau, A., & Loinard, L. 2017, ApJ, 836, 133 [NASA ADS] [CrossRef] [Google Scholar]
- Zapata, L. A., Ho, P. T. P., Fernández-López, M., et al. 2020, ApJ, 902, L47 [Google Scholar]
- Zapata, L. A., Fernández-López, M., Leurini, S., et al. 2023, ApJ, 956, L35 [CrossRef] [Google Scholar]
We use the words streamers or filaments to refer to narrow straight molecular collimated ejections. This is not to be confused with filamentary molecular clouds (Fernández-López et al. 2014) or accretion streamers (Fernández-López et al. 2023).
In general, the word ‘moment’ refers to collapsing an axis of a 3D dataset in a definite way to form a 2D image. For example, given an RA-Dec velocity cube, we collapse the velocity axis by computing the mean intensity of the spectrum at each RA-Dec pixel. The moment-2 map shows the intensity-weighted dispersion of the radial velocity and is traditionally used to obtain the velocity dispersion, the moment-8 map shows the maximum intensity value of the spectrum (the peak), and the moment-9 map shows the corresponding radial velocity at the peak value of the spectrum. See section 1.1.1 in the CASA Toolkit Reference Manual. In this work, we prepared the moment maps using the CASA task immoments.
All Tables
All Figures
|
Fig. 1 ALMA spectrum of the spectral window centered at 231.121 GHz. The CO line at 230.54 GHz can be identified with a peak intensity of ~20 mJy beam−1. The line absorption is deep because the cloud harbors DR21. In addition, two lines of lower intensity (lower by ~10 orders of magnitude) are identified: 13CS (5−4) at 231.222 GHz and H(30)α at 231.908 GHz. |
| In the text | |
|
Fig. 2 1.3 mm continuum emission toward DR21 in color-scale and white contours (at 5, 10, 15, and 20 times the rms noise level of 0.06 mJy beam−1). The synthesized beam in the bottom right corner is 0″.74 × 0″.29 (PA= 1.6°). The new millimeter compact continuum sources reported here are labeled MM1-MM5, and the cometary sources follow the notation used in Harris (1973). The central squared region is zoomed in in the top right inset, which includes the position of the possible explosion center, which is marked with a yellow square (see Section 3.3). |
| In the text | |
|
Fig. 3 The positions of CO (2−1) condensations in DR21. The background grayscale image and the green contours (at 5, 10, 15, and 20 times the rms noise level of 0.06 mJy beam−1) are the ALMA 1.3 mm continuum image from Figure 2. The red and blue circles correspond to the position of red-and blueshifted CO(2−1) gas condensation that is identified in the velocity cube. The yellow square denotes the position of the explosion center. The synthesized beam is depicted within a box in the bottom right corner. The central position is located at (0″, 0″), corresponding to RA=20h39m01s.1 and Dec=+42°19′ 37″.9. |
| In the text | |
|
Fig. 4 Red- (left panel) and blueshifted (right panel) CO (2−1) gas condensations detected in DR21. The velocities of the blueshifted emission range from −25 to −101 km s−1, and those of the redshifted emission range from +20 to +69 km s−1. The velocities are expressed with respect to the molecular cloud velocity. We identified nine redshifted and ten blueshifted filaments, labeled RF and BF, respectively. The possible origin of all the CO streamers is marked with a yellow square. |
| In the text | |
|
Fig. 5 Moment-8, moment-9, and moment-2 maps of CO (2−1) line emission for the streamer BF8 (left, medium, and right, respectively). The black contours represents the CO (2−1) emission at 3, 5, 8, and 10 times therms noise level of 0.2 Jy beam−1 in the moment-8 map. The synthesized beam is shown within a box in the bottom right corner. |
| In the text | |
|
Fig. 6 CO (2−1) emission velocity channels of the streamer BF8. The original channels were binned to produce a five-channel binned cube with channel widths of 6.34 km s−1 in width. The black contours represent the emission at 4, 6, 8, and 10 times the rms noise level of 20 mJy beam−1. The green dots represent the condensations identified in the streamer BF8 (see Section 3.2). |
| In the text | |
|
Fig. 7 PV diagram of the CO (2−1) emission associated with the set of filaments in DR21. Each filament is represented by a different color and marker. The zeropoint in the diagram (yellow square) corresponds to the new center measured in this paper. The gray lines depict linear trends between the projected distance and radial velocity, starting from a projected distance of 0″ and a radial velocity of 0 km s−1. These lines were constructed by increasing the slope every 5°, within two ranges from 40° to 90° and −40° to −90°. Some streamers appear to follow linear trends, while others exhibits areas of large velocity dispersion, which can be attributed to shock zones (green ellipses) between the streamer and its surrounding material. The pink rectangle indicates the region in which no streamer emission could be distinguished due to contamination from the parent cloud. |
| In the text | |
|
Fig. 8 Ensemble of CO streamer condensations identified in DR21. The red circles represent redshifted emission, and the blue circles represent blueshifted emission. The green triangle shows the location of the center as determined by Zapata et al. (2013b), and the yellow square reflects the new position described in this paper. The new position of the center is (α, δ)J2000.0 = 20h39m00s.8 ± 00s.2, +42°19′37″.62 ± 0″.97. The lines were obtained by connecting the tips of the filaments to the center (yellow square). |
| In the text | |
|
Fig. 9 Statistical analysis of the center of the explosive outflow in DR21. Pink circles represent the offsets in RA and Dec with respect to the center reported by Zapata et al. (2013b) of the intersections between pairs of different streamers trajectories (extracted as explained in the text). The position of the origin (0″, 0″) is set at 20h39m01.1s in RA and +42°19′ 37.9″ in Dec. In this paper, the median (yellow square) is considered as the new position of the center of the outflow. The vertical colored line represents the median value, the box represents the interquartile range between the 25th and 75th percentiles, and the vertical lines (the whiskers) show the full range of the data without outliers. |
| In the text | |
|
Fig. 10 CO (2−1) emission (contours) northeast (upper panel) and southwest (bottom panel) of the explosive outflow at DR21, overlaid with the continuum map at 1.3 mm (grayscale). The colored contours indicate different velocity ranges: blue for velocities between −79 and −52 km s−1, green for velocities between −51 and −24 km s−1, and red for velocities between −31 and +69 km s−1. The contours represent the CO (2−1) emission at 5, 10, 20, and 30 times the rms noise level of 70 mJy beam−1 km s−1. The possible origin of the CO streamers is marked with the yellow square. A redshifted collimated outflow is observed toward the southern edge of the image. The direction of this outflow (violet arrow) seems to indicate that it is associated with the continuum source MM5 (violet star). The synthesized beam of the continuum map is shown within a box in the bottom right corner. |
| In the text | |
|
Fig. 11 2.12 µm molecular hydrogen emission at DR21 overlaid with CO (2−1) emission (white dots) of the explosive outflow. The H2 emission was obtained using the Apache Point Observatory 3.5 meter telescope and NICFPS near-infrared camera using a 0.5 bandpass filter (PI: John Bally). The yellow square is the center of the outflow. The dashed blue lines trace arc-shaped structures detected in H2. |
| In the text | |
|
Fig. B.1 Moment-8,moment-9 and moment-2 maps (from left to right) of the CO (2−1) redshifted streamers of DR21: RF1, RF2, RF3 and RF4. The black contours represents the CO (2−1) emission at 5, 10, 15 and 20 times the rms noise level for each moment-8 map. The synthesized beam of the CO (2−1) map is shown within a box at the bottom right corner. The white arrow indicates the direction of the center of the explosive outflow. |
| In the text | |
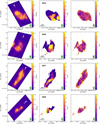 |
Fig. B.2 Same as Fig. B.1 for redshifted streamers RF5, RF6, RF7 and RF8. |
| In the text | |
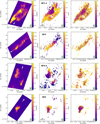 |
Fig. B.3 Same as Fig. B.1 for blueshifted streamers BF1, BF2, BF3, BF4, BF5 and BF6. |
| In the text | |
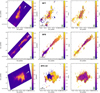 |
Fig. B.4 Same as Fig. B.1 for blueshifted streamers BF7, BF8, BF9 and BF10. |
| In the text | |
Current usage metrics show cumulative count of Article Views (full-text article views including HTML views, PDF and ePub downloads, according to the available data) and Abstracts Views on Vision4Press platform.
Data correspond to usage on the plateform after 2015. The current usage metrics is available 48-96 hours after online publication and is updated daily on week days.
Initial download of the metrics may take a while.