Fig. 9
Download original image
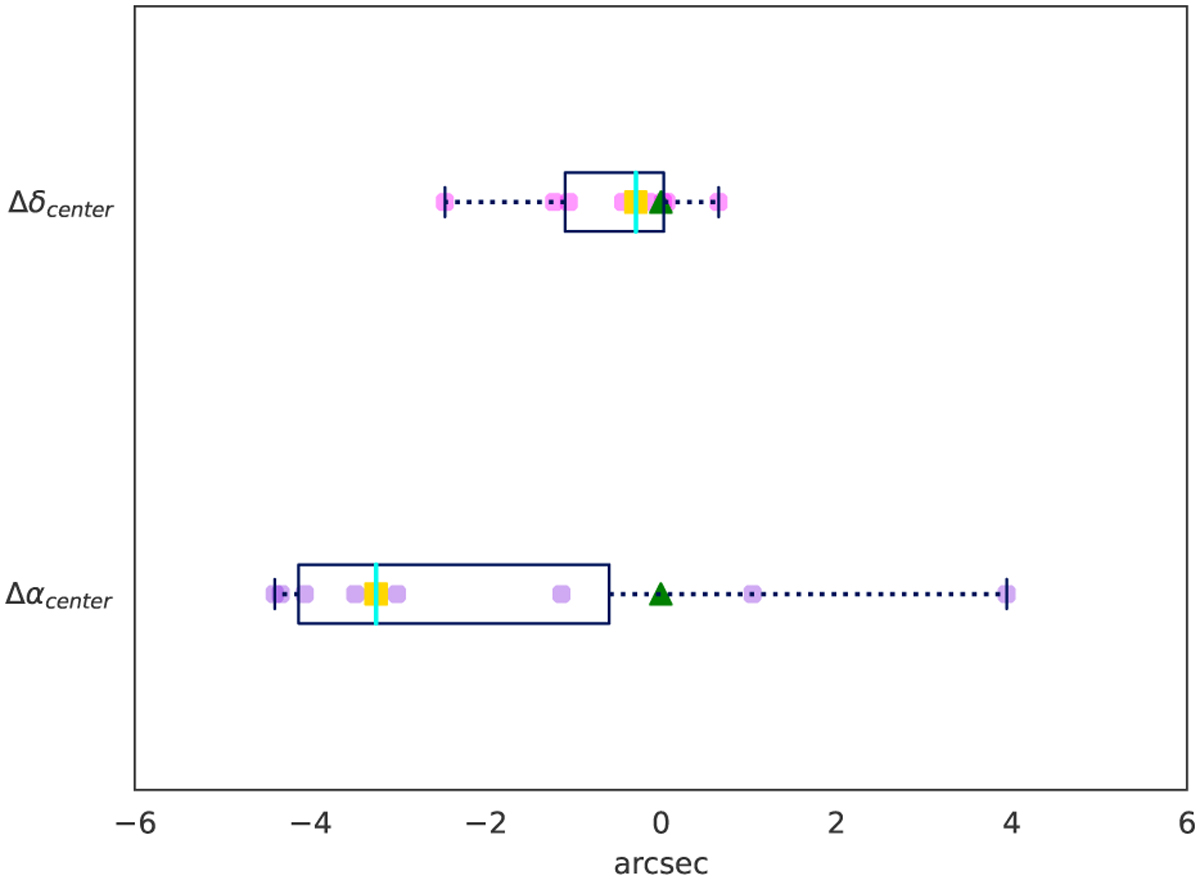
Statistical analysis of the center of the explosive outflow in DR21. Pink circles represent the offsets in RA and Dec with respect to the center reported by Zapata et al. (2013b) of the intersections between pairs of different streamers trajectories (extracted as explained in the text). The position of the origin (0″, 0″) is set at 20h39m01.1s in RA and +42°19′ 37.9″ in Dec. In this paper, the median (yellow square) is considered as the new position of the center of the outflow. The vertical colored line represents the median value, the box represents the interquartile range between the 25th and 75th percentiles, and the vertical lines (the whiskers) show the full range of the data without outliers.
Current usage metrics show cumulative count of Article Views (full-text article views including HTML views, PDF and ePub downloads, according to the available data) and Abstracts Views on Vision4Press platform.
Data correspond to usage on the plateform after 2015. The current usage metrics is available 48-96 hours after online publication and is updated daily on week days.
Initial download of the metrics may take a while.