Fig. 10
Download original image
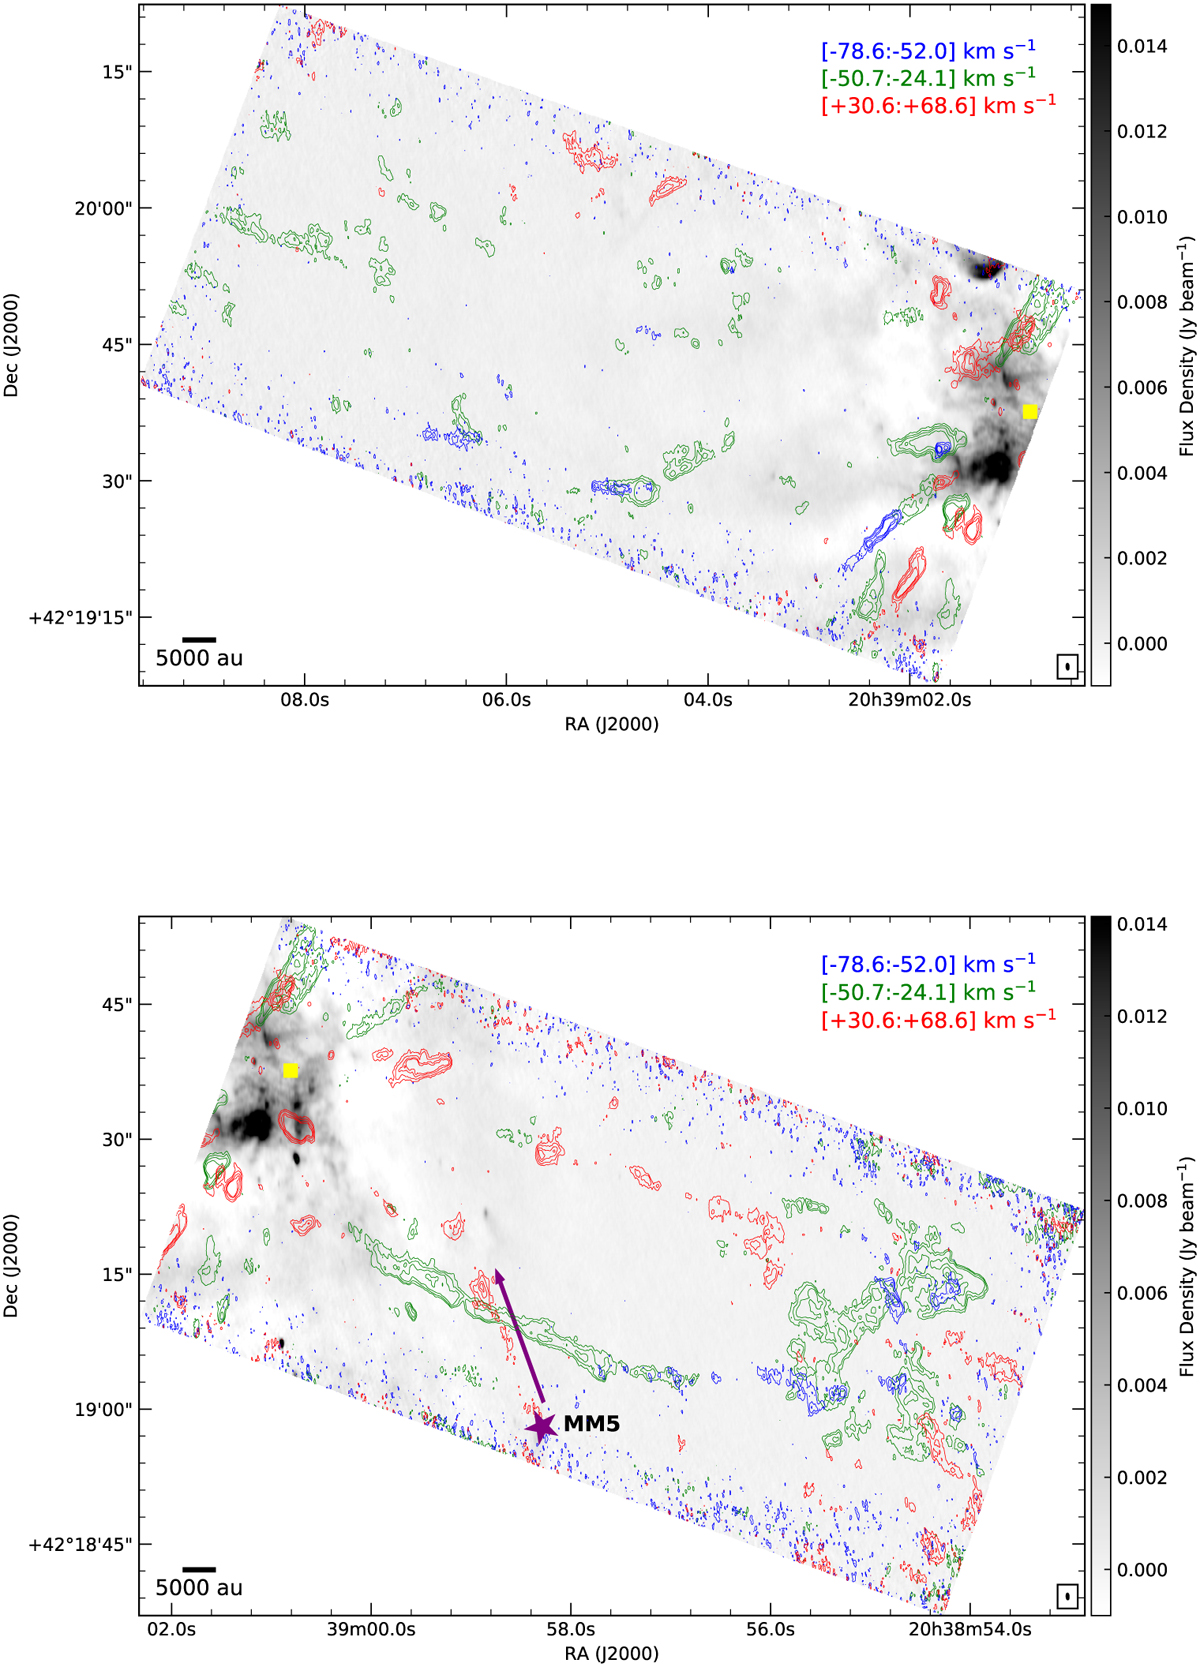
CO (2−1) emission (contours) northeast (upper panel) and southwest (bottom panel) of the explosive outflow at DR21, overlaid with the continuum map at 1.3 mm (grayscale). The colored contours indicate different velocity ranges: blue for velocities between −79 and −52 km s−1, green for velocities between −51 and −24 km s−1, and red for velocities between −31 and +69 km s−1. The contours represent the CO (2−1) emission at 5, 10, 20, and 30 times the rms noise level of 70 mJy beam−1 km s−1. The possible origin of the CO streamers is marked with the yellow square. A redshifted collimated outflow is observed toward the southern edge of the image. The direction of this outflow (violet arrow) seems to indicate that it is associated with the continuum source MM5 (violet star). The synthesized beam of the continuum map is shown within a box in the bottom right corner.
Current usage metrics show cumulative count of Article Views (full-text article views including HTML views, PDF and ePub downloads, according to the available data) and Abstracts Views on Vision4Press platform.
Data correspond to usage on the plateform after 2015. The current usage metrics is available 48-96 hours after online publication and is updated daily on week days.
Initial download of the metrics may take a while.