Fig. 7
Download original image
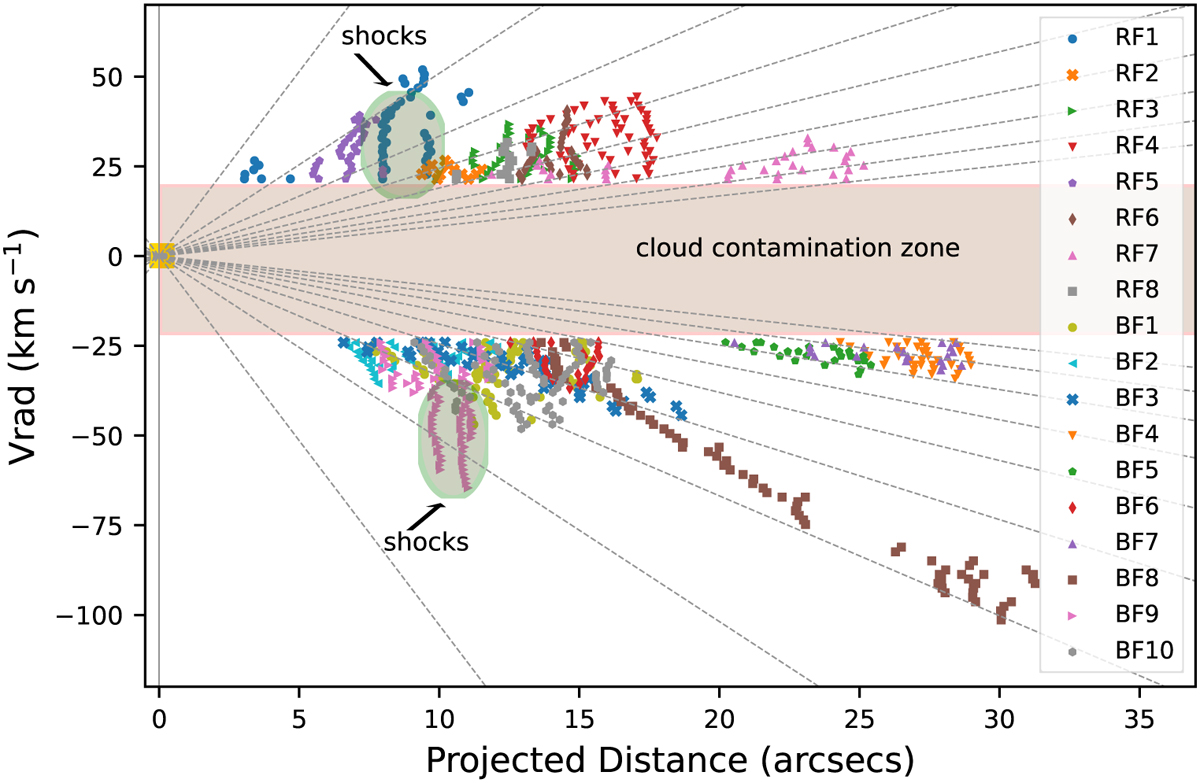
PV diagram of the CO (2−1) emission associated with the set of filaments in DR21. Each filament is represented by a different color and marker. The zeropoint in the diagram (yellow square) corresponds to the new center measured in this paper. The gray lines depict linear trends between the projected distance and radial velocity, starting from a projected distance of 0″ and a radial velocity of 0 km s−1. These lines were constructed by increasing the slope every 5°, within two ranges from 40° to 90° and −40° to −90°. Some streamers appear to follow linear trends, while others exhibits areas of large velocity dispersion, which can be attributed to shock zones (green ellipses) between the streamer and its surrounding material. The pink rectangle indicates the region in which no streamer emission could be distinguished due to contamination from the parent cloud.
Current usage metrics show cumulative count of Article Views (full-text article views including HTML views, PDF and ePub downloads, according to the available data) and Abstracts Views on Vision4Press platform.
Data correspond to usage on the plateform after 2015. The current usage metrics is available 48-96 hours after online publication and is updated daily on week days.
Initial download of the metrics may take a while.