| Issue |
A&A
Volume 685, May 2024
|
|
|---|---|---|
| Article Number | A162 | |
| Number of page(s) | 22 | |
| Section | Catalogs and data | |
| DOI | https://doi.org/10.1051/0004-6361/202348430 | |
| Published online | 22 May 2024 | |
Hypervelocity star candidates from Gaia DR2 and DR3 proper motions and parallaxes
Leibniz-Institut für Astrophysik Potsdam,
An der Sternwarte 16,
14482
Potsdam, Germany
e-mail: rdscholz@aip.de
Received:
30
October
2023
Accepted:
12
February
2024
Context. Hypervelocity stars (HVSs) unbound to the Galaxy can be formed with extreme stellar interactions, for example close encounters with supermassive black holes or in massive star clusters, supernova explosions in binary systems, or the stripping of dwarf galaxies. Observational evidence comes from measurements of radial velocities (RVs) of objects crossing the outer Galactic halo and of tangential velocities based on high proper motions (HPMs) and distances of relatively nearby stars.
Aims. I searched for new nearby HVS candidates and reviewed known objects using their Gaia astrometric measurements.
Methods. Candidates were selected with significant Gaia parallaxes of >0.1mas, proper motions of >20 mas yr−1, and computed galactocentric tangential velocities vtan_g>500 km s−1. The DR2 and DR3 samples of several thousand HVS candidates were studied with respect to their proper motions, sky distribution, number of observations, location in crowded fields, colour-magnitude diagrams, selection effects with magnitude, and RVs in DR3. The 72 most extreme (vtan_g>700 km s−1) and nearest (within 4kpc) DR3 HVS candidates were investigated with respect to detected close neighbours, flags, and astrometric quality parameters of objects of similar magnitudes in DR3. The quality checks involved HPM objects in a global comparison and all objects in the vicinity of each target.
Results. Spurious HPMs in the Galactic centre region led to false HVS interpretations in Gaia DR2 and are still present in DR3, although to a lesser extent. Otherwise there is good agreement between the HPMs of HVS candidates in DR2 and DR3. However, HVS candidates selected from DR2 tend to have larger parallaxes, and hence lower tangential velocities in DR3. Most DR3 RVs are much lower than the tangential velocities, indicating that the DR3 HVS candidates are still affected by underestimated parallaxes. None of the 72 extreme nearby DR3 HVS candidates, including three D6 stars, passed all the quality checks. Their tangential velocities may turn out to be lower, but at least some of them still appear unbound to the Galaxy.
Key words: parallaxes / proper motions / stars: distances / Hertzsprung–Russell and C–M diagrams / stars: kinematics and dynamics / Galaxy: halo
© The Authors 2024
 Open Access article, published by EDP Sciences, under the terms of the Creative Commons Attribution License (https://creativecommons.org/licenses/by/4.0), which permits unrestricted use, distribution, and reproduction in any medium, provided the original work is properly cited.
This article is published in open access under the Subscribe to Open model. Subscribe to A&A to support open access publication.
1 Introduction
The high-speed stellar objects at issue in this study occur only rarely, and their formation has been explained as exotic astro-physical processes. However, their fascinating discoveries and interpretations can only be described incompletely here due to their abundance. Many individual objects were discussed repeatedly in the light of different scenarios and measured velocities. The underlying data are, on the one hand, extreme stellar radial velocities (RVs) from spectroscopic measurements, and on the other hand, very high tangential velocities of stars computed from astrometric measurements of their high proper motions (HPMs) and distance estimates, which may rely on astrometry or photometry. Whereas extreme RVs are formally much more precisely measured than high tangential velocities, they should in principle also be verified and monitored by repeated spectroscopic measurements with different instruments. However, this could be the topic of another special investigation. The focus of this study is on a critical review of astrometric measurements (of both HPMs and parallaxes) that can lead to very high tangential velocities of stars, indicating that they may escape the Galaxy.
Early investigations on the local Galactic escape velocity (Caldwell & Ostriker 1981) already indicated a range of 550650 km s-1, in agreement with modern values (see Li et al. 2023, and references therein). As illustrated in Li et al. (2023, Fig. 4), the upper limit of five recent studies corresponds to 580+63 km s−1 found by Monari et al. (2018), and this value turns out to be only 50 km s−1 higher or lower at galactocentric distances of about 4 kpc or 12 kpc, respectively. In the outer Galactic halo, the escape velocity is further reduced. Using a slightly modified three-component bulge-disk-halo potential model of Kenyon et al. (2008), Brown et al. (2014) found 367 km s−1 at the galactocentric distance of 50 kpc and 578 km s−1 at 8 kpc. The latter value is in very good agreement with the upper limit of the local Galactic escape velocity given by Monari et al. (2018).
A hypervelocity star (HVS; Brown 2015) is moving so fast through the Galaxy that it is unbound to the Galactic potential. This definition, which is independent of the ejection mechanism and relies only on a very high velocity, is used in this study. A possible HVS formation scenario was first predicted theoretically by Hills (1988), namely the tidal disruption of a tight binary by the supermassive black hole (SMBH) in the Galactic centre (GC). Yu & Tremaine (2003) considered three scenarios of HVS ejection by the (binary) SMBH in the GC, including the possible ejection of single stars. Shortly thereafter, Brown et al. (2005) reported the first HVS observation in the outer Milky Way halo. This and the following HVS discoveries by Brown et al. (2006, 2009, 2012, 2014) were based on RV measurements alone and consisted of late B-type stars on the main sequence (MS) more than 50 kpc from the GC, but all consistent with a GC origin.
Other early HVS discoveries included blue stars of different types, for example a subluminous O star (Hirsch et al. 2005), the B-type giant HD 271791 (Heber et al. 2008), an A-type star (Tillich et al. 2009), and a hot subdwarf (sdB-type) star (Tillich et al. 2011). A growing number of HVSs (e.g. those first observed by Edelmann et al. 2005, Heber et al. 2008, Tillich et al. 2009, 2011) began to throw discredit on their generally accepted interaction with the SMBH in the GC. The B-type HVS HE 0437-5439, located much closer to the Large Magellanic Cloud (LMC) than to the GC (Edelmann et al. 2005), was thought to originate from the LMC (see e.g. Gualandris & Portegies Zwart 2007, Przybilla et al. 2008b, and Bonanos et al. 2008). However, based on Hubble Space Telescope (HST) proper motion measurements, which were not very significant for this outer halo star, Brown et al. (2010) preferred a GC origin. An alternative origin for some of the known HVSs from a recently disrupted dwarf galaxy that passed near the GC was suggested by Abadi et al. (2009). A possible HVS ejection in a supernova explosion was first proposed by Przybilla et al. (2008a) for HD 271791. A massive star that could be ejected as a HVS from an extremely dense young star cluster and later become a pulsar was discussed by Gvaramadze et al. (2008) in connection with PSR B1508+55. This pulsar was previously found to be an unusual HVS because of its high tangential velocity of about 1000 km s−1 from parallax and HPM measurements, and because of its birth site in the Galactic plane (Chatterjee et al. 2005).
The question about the existence of an older population of late-type HVSs was raised by Kollmeier & Gould (2007). Using data from the Sloan Digital Sky Survey (SDSS), Li et al. (2012) and Palladino et al. (2014) found F- and G/K-type HVS candidates, where the latter selected their candidates by proper motion. Tauris (2015) compared the observed velocity distributions of late B-type (Brown et al. 2014) and G/K-type HVS candidates (Palladino et al. 2014) mentioning that the tangential velocity errors of the latter are ten times larger than the RV errors of the former, and that the typically higher tangential velocities of the relatively nearby G/K-type HVS candidates may be affected by distance errors. From his simulations of HVSs ejected from disrupted binaries in asymmetric supernova explosions, Tauris (2015) found maximum possible velocities of 770 km s−1 and 1280 km s−1, respectively, for late B-type and G/K-type stars. He concluded that the binary disruption scenario could explain all observed G/K-type HVS candidates and is, ‘under the most extreme favourable conditions’, even possible for late B-type HVSs. However, the G/K-type HVS candidates of Palladino et al. (2014) were not confirmed by Ziegerer et al. (2015) who measured smaller ground-based proper motions than claimed before. A general revision of pre-Gaia proper motion measurements of late-type HVS candidates towards smaller values and consequently lower tangential velocities using Gaia DR2 (Gaia Collaboration 2018) was presented by Boubert et al. (2018). The latest HVS search based on the combination of astrometric data from Gaia DR3 (Gaia Collaboration 2023) and spectroscopic data from various large-scale Galactic surveys (Li et al. 2023) revealed 52 metal-poor late-type candidates within 5 kpc of the Sun, none of which was definitely ejected from the GC.
Several HVS studies based on Gaia DR2, for example Marchetti et al. (2019) and Hattori et al. (2018), made use of both astrometric and RV measurements, which were available for the relatively small subsample of seven million stars. Searching among the about 34 million stars with 6D information in Gaia DR3, Marchetti et al. (2022) did not identify any HVS candidates with a velocity higher than 700 km s−1 and robustly observed kinematics, whereas Liao et al. (2023) found two HVS candidates with a potential GC origin. Evans et al. (2023) considered only one object, S5-HVS1, for which Koposov et al. (2020) measured a precise and constant RV of 1017±2.7 km s−1 and Gaia DR3 confirmed its DR2 proper motion of about 35 mas yr−1, but also a still non-significant parallax, as an HVS with a clear GC origin. On the other hand, Shen et al. (2018) and Bromley et al. (2018). demonstrated that an effective HVS search could already be carried out with Gaia DR2 HPMs and parallaxes alone.
The 19 HVS candidates found by Bromley et al. (2018) applying relatively strong astrometric and photometric quality criteria, including 5σ parallax measurements (Plx/e_Plx>5), fall in the Gaia colour-magnitude diagram (CMD) near to the MS and in the late-type giants region. Their heliocentric distances determined from the Gaia DR2 parallaxes are about 2-15 kpc, whereas the galactocentric tangential velocities (Sect. 2.1) are in the range 670–920 km s−1. The three extreme HVS candidates discovered by Shen et al. (2018) using less stringent quality criteria have DR2-based vtan_g≈ 1300–2400 km s−1 and distances from the Sun between only 1kpc and 2.5 kpc. Their spectroscopic observations allowed these authors to classify these objects as unusual white dwarfs (WDs), located between the normal WD sequence and the MS in the Gaia CMD, and measure their RVs. Surprisingly, for two of these three unusual WDs the RV was consistent with 0, and only one turned out to have a high RV of about 1200 km s−1, comparable with its tangential velocity. Nevertheless, for the responsible ejection mechanism of all three objects, Shen et al. (2018) suggested a dynamically driven double-degenerate double-detonation type Ia supernova (D6) scenario, in which the D6 objects are the surviving former close companions of their exploded primaries. The position of the three D6 objects in the Gaia CMD appears to be close to the well-measured HVS LP 40-365, which is another unusual WD that may have exploded but was only partially destroyed in a subluminous type Iax supernova (Vennes et al. 2017), and similar objects (called LP 40-365 stars) subsequently found by Raddi et al. (2019). The accurate Gaia DR2 parallax of the prototype LP 40-365 was for the first time crucial to estimating the size, and thus to confirming its nature as a supernova Ia survivor (Raddi et al. 2018). Selecting blue HPM stars with nonsignificant and even negative parallaxes in Gaia DR3, El-Badry et al. (2023) recently confirmed four hot D6 stars with heliocentric tangential velocities of the order of 1000–5000 km s−1 by measuring comparably large but (formally) precise RVs. With these discoveries, more and more alternative HVS ejection scenarios, beyond the classical SMBH interaction in the GC, come into focus, and Igoshev et al. (2023) already discussed eight different possible HVS formation channels.
A first brief critical review of the astrometric reliability of the fastest nearby HVS candidates selected based on Gaia DR2 galactocentric tangential velocities was presented by Scholz (2018). Only six candidates passed the quality checks applied therein using some of the most important astrometric parameters. Among those six candidates were two of the 19 HVS candidates previously presented by Bromley et al. (2018) and only one of the three D6 objects of Shen et al. (2018). However, the latter object, D6-2, was already considered a suspicious HVS because of its zero RV measured by these authors, and it was also mentioned as doubtful by Scholz (2018) because of its DR2 quality parameters just slightly below the allowed limits.
The paper is organized as follows. This extended and more detailed study of HVS candidates with high tangential velocities first involves all objects of moderately HPMs, significant parallaxes, and parallactic distances up to 10 kpc in Gaia DR2 and DR3 (Sect. 2). In Sect. 3, the nearest (within 4 kpc) and most extreme HVS candidates selected from Gaia DR3 are investigated with respect to a large number of astrometric quality parameters available in and derived from DR3. Conclusions on the reliability of the HVS status derived from Gaia astrometric measurements and the location of HVS candidates in the CMD are drawn in Sect. 4.
2 Gaia HVS selection from tangential velocities
The initial selection of relatively nearby HVS candidates in the last two Gaia data releases investigated here was made by a conservative HPM cut PM>20 mas yr−1, with a minimum parallax Plx>0.1 mas, and by only one astrometric quality criterion requiring a 5σ significance of the parallax measurement Plx/e_Plx>5 in DR2 (the ratio Plx/e_Plx is also listed as RPlx (parallax_over_error) in DR2 and DR3). However, in DR3, objects with 3<Plx/e_Plx<5 were included as low-priority candidates. This selection was sensitive to heliocentric tangential velocities of roughly > 1000 km s−1 at 10 kpc distance, >500 km s−1 at 5 kpc, and >200km s−1 at 2kpc, respectively. The final step in the astrometric selection of HVS candidates was carried out after transforming the tangential velocities to the Galactic rest frame.
2.1 Galactocentric tangential velocities
For a comparison with the estimated upper limit of the local Galactic escape velocity of 580±63 km s−1 (Monari et al. 2018) heliocentric tangential velocities have to be corrected for solar motion. Galactocentric tangential velocities vtan_g were computed in the same way as in Scholz (2018) by following Eq. (1) of Hattori et al. (2018) but using a local standard of rest velocity of 235 km s−1 as applied by Bromley et al. (2018).
In the first part of the study described in the following subsections, a conservative minimum of vtan_g>500 km s−1 was used in view of the relatively large tangential velocity errors of the order of ±100 km s−1 (even about ±200 km s−1 for low-priority candidates). These errors will be discussed for Gaia DR3 HVS candidates in Sects. 2.6 and 2.7. We note that the tangential velocity errors are completely dominated by the parallax errors, and the proper motion errors can be neglected. Later, as shown in Sect. 3, the limit was increased to vtan_g>700 km s−1 to select the most promising extreme HVS candidates, and in particular to verify the nearest extreme HVS candidates within 4 kpc by checking additional Gaia DR3 astrometric quality parameters.
2.2 Gaia DR2 candidates
The preceding DR2-based selection of HVS candidates by Scholz (2018) was restricted to the nearest candidates with the highest velocities and yielded only six apparently well-measured stars with PM>60 mas yr−1 and vtan_g>700 km s−1. These six stars are marked in Fig. 1 and in many of the following figures for comparison. The only three of these six candidates, D6-2, Gaia DR2 3841458366321558656, and Gaia DR2 6097052289696317952, which have still vtan_g>700 km s−1, when their new Gaia DR3 data are used (Sect. 2.3), are labelled in the figures with their D6 name or abbreviated DR2 designations, respectively.
Some of the HPMs of 1520 DR2 HVS candidates, selected here with only one astrometric quality criterion (Plx/e_Plx>5) but also by limiting the sample to objects with measured BP and RP photometry in DR2, were not confirmed (4) or not measured (21) by DR3 (Fig. 1). Most of them show an unusual distribution with almost equally large positive components pmRA and pmDE, while a few have similar large pmRA and pmDE values but with different signs. As one can see in Fig. 2, all these doubtful candidates are faint and have obviously not enough epochs of observation, as indicated by small numbers of visibility periods N per (= visibility_periods_used). They are also located at low Galactic latitudes, where the majority is concentrated in the GC region (two are close to the Galactic anti-centre). The three labelled extreme HVS candidates with confirmed vtan_g>700 km s−1 in DR3 had also small Ν per values in DR2 but are generally brighter and at higher Galactic latitudes.
Out of the shown 25 suspicious HPM objects, seven were included in the DR2 tangential velocity-selected sample of 28 apparent late-type HVSs of Du et al. (2019, their Table 2). Another seven of their candidates have no BP and RP measurements in DR2 and are not shown here. Together, these 14 stars, which in a visual inspection of available multi-epoch imaging data1 did also not display any HPM, represent half of their sample. The problem of selecting false Gaia HPM stars in crowded fields, when the significance of the parallaxes is used as the only quality criterion, will be further illuminated in Sect. 2.4.
The bimodal magnitude distribution seen in Fig. 2 can be roughly attributed to distant giants and nearby dwarfs among the HVS candidates. The median parallax of 711 candidates with G<15 mag is 0.176 mas, whereas for the 809 candidates with G>15 mag it is 0.368 mas. The CMD showing the absolute magnitudes Gabs = G + 5 × log (Plx/100) (where the parallax Plx is in units of mas) vs. the G–RP colour, all 1520 high-priority DR2 candidates (Fig. 3) also includes nearly equal numbers of giants and dwarfs, if one simply counts all objects with absolute magnitudes brighter (797) or fainter (723) than the turnoff point at Gabs≈2.5 mag. The 25 candidates with lacking or unconfirmed proper motions in DR3 mostly appear as a diffuse cloud of unusual red and faint stars in this CMD. This is another hint to their overestimated parallaxes, in addition to their strongly overestimated proper motions and likely problematic photometric measurements, in DR2. The bluest (at G-RP≈0.5 mag) of these 25 objects (Gaia DR2 3444106859889780608) is with G = 15.3 mag also the brightest in Fig. 2, has according to other catalogues (e.g. Zacharias et al. 2015) a proper motion below 10 mas yr−1, and was apparently resolved in DR3 as two nearly equally bright stars, each with poor astrometric quality, separated by about 0.2 arcsec.
In addition to three labelled extreme HVS candidates from Scholz (2018; see Fig. 1), the two bluest objects and two luminous WDs are also labelled in the DR2 CMD (Fig. 3). All these four stars, have DR2-based galactocentric tangential velocities just slightly above the chosen limit of 500 km s−1. In order of absolute magnitude, these are Hip 114569, an early-type runaway candidate from an open cluster (Bhat et al. 2022), Gaia DR2 2139774976276141824, a hot subdwarf found in DR2 (Geier et al. 2019), LP 40-365, the already mentioned (in Sect. 1) well-measured HVS whose RV is also of the order of 500 km s−1 (Vennes et al. 2017), and SDSS J 125834.93-005948.4, a WD found in SDSS DR10 (Kepler et al. 2015). The last one lies close to the colour box of nearby WDs (Hollands et al. 2018). Interestingly, all of those four stars have slightly larger parallaxes measured in DR3, following a general trend that will be described in more detail in Sect. 2.5, so that only LP 40-365 remains a HVS in the DR3-based selection (Sect. 2.3).
The measured total proper motions and computed vtan_g of the DR2 HVS candidates are shown in Fig. 4. Due to the 25 spurious HPM stars (red symbols), the fraction of classical HPM stars with PM> 150 mas yr−1 (see e.g. Lépine & Shara 2005) falling above the black solid line appears with about 6% relatively high. Concerning the marked six candidates of Scholz (2018), the magenta dashed lines indicate the more extreme HPM and vtan_g limits used for them in comparison to the moderate 20 mas yr−1 and vtan_g=500 km s−1 (black dashed lines) applied here. It is remarkable that only the three of them with the highest vtan_g (labelled) survived with vtan_g>700 km s−1 in the later DR3-based HVS selection. However, as will be demonstrated later (Sects. 2.3 and 2.5), Gaia DR2 6097052289696317952 appearing as the fastest HVS in Fig. 4 suffered from a dramatic decrease in velocity because of its much larger parallax in DR3.
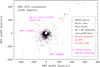 |
Fig. 1 Proper motions of HVS candidates selected from Gaia DR2 with PM>20 mas yr−1 Plx>0.1 mas, available BP, RP photometry, and vtan_g>500 km s−1. All 1520 high-priority candidates with Plx/e_Plx>5 are shown. The red symbols are objects with unconfirmed (crosses) or not measured (plus signs) proper motions in DR3. The magenta circle and symbols indicate the minimum HPM of 60 mas yr−1 and the six extreme (vtan_g>700 km s−1) nearby HVS candidates selected with additional DR2 quality criteria by Scholz (2018), respectively. The three labelled objects have still vtan_g>700 km s−1 when DR3 is used. |
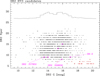 |
Fig. 2 Gaia DR2 G magnitudes and numbers of visibility periods Ν per of 1520 high-priority HVS candidates selected from DR2. The overplotted coloured symbols and labelled objects are as in Fig. 1. The black histogram illustrates the magnitude distribution. |
2.3 Gaia DR3 candidates
Based on DR3, not only 1619 high-priority (Plx/e_Plx>5) but also 4228 low-priority (3<Plx/e_Plx<5) HVS candidates with PM>20 mas yr−1, Plx>0.1 mas, and vtan_g> 500 km s−1 were selected (without further requirements on their available photometry). The proper motion distribution of all candidates (Fig. 5) looks more compact than that of the 1520 high-priority HVS candidates (with measured BP and RP) previously selected in DR2 (Fig. 1). There are less extreme HPM stars among the DR3 HVS candidates and no obviously false HPM stars (cf. red symbols in Fig. 1 and HPM spikes seen in Fig. 9). Except for only one star lacking a proper motion in DR2 (but including five high-priority and 49 low-priority candidates with negative DR2 parallaxes), the differences of the proper motions (DR3-DR2) of the DR3 nearby HVS candidates are much smaller than their total values. For high-priority candidates both proper motion components agree within about ±3 mas yr−1. The agreement is still within about ±5 mas yr−1 for all low-priority candidates, except for one object with a difference in pmDE of about −10 mas yr−1 and a total DR3 proper motion of about 45 mas yr−1 (with the largest negative parallax in DR2). Compared to the DR2 candidates (Fig. 2), the DR3 candidates are expected to have more reliable astrometry according to their shift towards higher numbers of visibility periods Nper (Fig. 6). The sub-sample of low-priority DR3 HVS candidates is dominated by faint objects (see green histogram in Fig. 6). The sky distribution of all DR3 HVS candidates is not shown here. It appears similar to that of the DR2 HVS candidates but without any concentration of candidates near the GC. An overdensity in the first (GLON<90°) and fourth (GLON>270°) Galactic quadrants is observed for both DR2 and DR3 HVS candidates. This concerns mainly distant giants among the HVS candidates (see below).
Only a few of the high-priority (3%) and low-priority (2%) DR3 nearby HVS candidates have proper motions as high as PM>150 mas yr−1 (Fig. 7). Among them are now also the other two of the D6 objects of Shen et al. (2018), D6-1 (= Gaia DR3 5805243926609660032) with high priority and D6-3 (= Gaia DR3 2156908318076164224) with low priority, which appear in Fig. 7 with the most extreme galactocentric tangential velocities among all DR3 candidates. The third D6 object, D6-2 (= Gaia DR3 1798008584396457088), was already included with high priority in the DR2 selection (Sect. 2.2) and listed by Scholz (2018) among six extreme HVS candidates (cf. overplotted magenta open circles in Figs. 4 and 7). Two of them have lower vtan_g<500 km s−1 in DR3 and are therefore not plotted in Fig. 7. Only three of these six have still extreme vtan_g>700 km s−1 in DR3 and are labelled. The velocity of vtan_g≈ 1000 km s−1 of one of these three, Gaia DR2 3841458366321558656, has not changed much between DR2 and DR3. However, for D6-2 vtan_g reduced from ≈ 1250 km s−1 to ≈ 1100 km s−1, and the DR2-based value of ≈ 1600 km s−1 for Gaia DR2 6097052289696317952 became with ≈750 km s−1 much lower in DR3. All large changes in the resulting vtan_g from DR2 to DR3 were caused by large differences in the measured parallaxes of the stars but not in their proper motions. The HPM status of two of the D6 objects was known long before Gaia. One, D6-2, was already listed as NLTT 51732 in the catalogue of Luyten (1995), whereas D6-3 was originally named LSPM J1852+6202 by Lépine & Shara (2005).
The CMD of the DR3 HVS candidates is shown in Fig. 8. Only five out of 1619 high-priority and 13 out of 4228 low-priority DR3 HVS candidates lack BP, RP photometry and are therefore not plotted as symbols in Fig. 8. As can be expected from the different parallax uncertainties and G magnitude distributions (see histograms in Fig. 6), high-priority candidates dominate at the bright end and represent a sharper picture of the MS and giants regions than the low-priority candidates. As for DR2, with simply counting all high-priority DR3 candidates with absolute magnitudes brighter or fainter than the turnoff point at Gabs≈2.5 mag, one gets about equal numbers of giants (841) and dwarfs (778). However, the low-priority sample (see green histogram on the right of Fig. 8) contains more dwarfs just below the turnoff point. For both high- and low-priority samples, 95% of these selected giants are located in the first and fourth Galactic quadrant and about 50% at low Galactic latitudes (|GLAT|<20°). These fractions are considerably smaller for dwarfs, in particular the high-priority ones with 75% and 28%, respectively. These differences can be explained by generally high numbers of distant giants in the Galactic bulge and inner disk regions (the mean parallax and standard deviation of the selected high-priority giants is 0.17±0.05 mas) compared to a more uniform sky distribution of dwarfs in the solar neighbourhood (0.46±0.33 mas for the selected high-priority dwarfs). Both mean parallaxes and standard deviations become smaller for low-priority candidates.
In comparison to the CMD of the DR2 HVS candidates (Fig. 3), there are only a few new blue DR3 HVS candidates left of the MS, whereas from the two bluest DR2 objects and two luminous DR2 WDs discussed in Sect. 2.2 only one (labelled C in Fig. 8, see below) is according to DR3 still counted as HVS candidate. The already mentioned in DR2 high-priority HVS candidate D6-2 is now joined by D6-1 (high priority in DR3) and D6-3 (low priority in DR3) from Shen et al. (2018). When comparing the DR2 and DR3 CMDs, we note that one of the three objects labelled in magenta, Gaia DR2 6097052289696317952, was shifted from the giants region towards the MS, because of its much larger parallax measured in DR3.
The six objects labelled with capital letters A–F in Fig. 8, three of which are located close to the D6 objects and two falling in or at the border of the WD colour box2 defined for WDs in the Solar neighbourhood (Hollands et al. 2018), deserve special attention. Their vtan_g and tangential velocity errors are listed in the figure. Most of their vtan_g are not much higher than the lower limit of 500 km s−1 used in this study and much lower than the extreme velocities of the D6 objects. Only object D, appearing next to the D6 objects in the CMD, belongs to the small subsample of the nearest extreme DR3 HVS candidates with vtan_g>700 km s−1 studied in more detail in Sect. 3 but with a relatively large velocity error. All tangential velocity errors will be shown in Fig. 14. The bright and very blue object A is the hot subdwarf PG 1454+358 of spectral type sdO (Green et al. 1986) also listed in the DR3-based catalogue of hot subluminous stars of Culpan et al. (2022). It was recently confirmed as sdO by El-Badry et al. (2023), who measured an RV of only about −170 km s−1. Objects Β and C are high-priority candidates and have relatively small tangential velocity errors. Object C is LP 40-365 (Vennes et al. 2017), already discussed in Sects. 1 and 2.2, and object Β is Gaia DR2 5822236741381879040, one of a few similar LP 40-365 stars found by Raddi et al. (2019). Both have also well-measured high RV of the order of 500 km s−1 confirming their HVS status. Object D (= Gaia DR3 3507697866498687232) was included in the HVS search of El-Badry et al. (2023) targeting DR3 sources with low-accuracy parallaxes and spectroscopically classified as another LP 40-365 star with an RV of only about +50 km s−1. Objects Ε (= Gaia DR3 5703888058542880896) and F (= Gaia DR3 3534629338669165440) were already included in the DR2-based WD catalogue of Gentile Fusillo et al. (2019). Object Ε was listed as HVS WD by Igoshev et al. (2023). It was spectroscopically classified as DA WD by El-Badry et al. (2023).
The region of hot D6 stars discovered by El-Badry et al. (2023) is also indicated in Fig. 8, using their estimated absolute magnitudes. We note that this region overlaps with the nearby WDs region. However, all four hot D6 stars did not even enter the sample of low-priority DR3 HVS candidates studied here, because of their extremely low Plx/e_Plx<1.5 (including one negative parallax). If their true parallaxes will be larger (following the observed trend in Sect. 2.5), they may move into the WD region of the CMD with updated Gaia data. Also shown in Fig. 8 is the extreme HVS S5-HVS1 (also not among our low-priority candidates) with two different absolute magnitude estimates. The cyan filled lozenge corresponds to its predicted parallax of 0.11 mas (Koposov et al. 2020) and the open lozenge to its still non-significant measured DR3 parallax of 0.035±0.040 mas. This was already a much larger value than its negative DR2 parallax of −0.042±0.092, which was the only known parallax measurement available to Koposov et al. (2020). Their prediction was based on photometry, spectroscopy and the travel of S5-HVS1 from the GC to its current position and may be proved with future Gaia data releases.
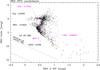 |
Fig. 3 Gaia DR2 colour-magnitude diagram of 1520 high-priority DR2 HVS candidates. The region occupied by nearby WDs (Hollands et al. 2018) is bounded by dashed lines. The over-plotted coloured symbols and labelled objects are as in Fig. 1. For other labelled stars see text. |
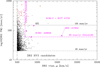 |
Fig. 4 Galactocentric tangential velocities vtan_g and total proper motions PM of 1520 high-priority Gaia DR2 HVS candidates. The overplotted coloured symbols and labelled objects are as in Fig. 1. The magenta dashed lines show the search limits of Scholz (2018). |
 |
Fig. 5 Proper motions of Gaia DR3 high-priority (blue plus signs) and low-priority (green crosses) HVS candidates. |
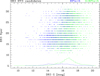 |
Fig. 6 Gaia DR3 G magnitudes and numbers of visibility periods Ν per of 1619 high-priority (blue plus signs) and 4228 low-priority (green crosses) HVS candidates selected from DR3 (Sect. 2.3). The blue and green histograms illustrate their corresponding magnitude distributions. |
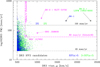 |
Fig. 7 Galactocentric tangential velocities and total proper motions of high-priority (blue plus signs) and low-priority (green crosses) DR3 HVS candidates. For the tangential velocity errors, see Fig. 14. The overplotted magenta open circles and magenta labelled objects are as in Figs. 1–4. The magenta dashed lines show the search limits of Scholz (2018). Also labelled are two other D6 objects (Shen et al. 2018). |
2.4 Spurious HPMs in crowded regions
According to the expected Gaia science performance3, not all stars down to the limiting magnitude of G≈20 mag can be measured in crowded regions, when the maximum transmission rate to the ground is reached. In addition, the minimum separation to resolve a close, equal-brightness double star in the onboard star-mapper detector is 0.23 arcsec in the along-scan and 0.70 arcsec in the across-scan direction (de Bruijne et al. 2015). With the observing periods of 22 months in DR2 and 34 months in DR3, and using the above along-scan resolution, mismatched objects detected at the beginning and end of the observing period could mimic HPM stars with 125 mas yr−1 and 80 mas yr−1, respectively. These false proper motions could be even higher, if the epoch difference between mismatched detections was smaller than the full observing period or if their separation was larger than 0.23 arcsec but not all detections could be transmitted to the ground. For DR3, the angular resolution was investigated in more detail by Lindegren et al. (2021). They found that it depends on many factors including the magnitudes of close neighbours, their orientation on the sky, and the astrometric solution type. In their Fig. 6, they illustrate three problematic ranges of separation. Below 0.18 arcsec always only one DR3 source is kept and flagged as duplicated source. At separation 0.18-0.6 arcsec most neighbours have only two-parameter solutions (parallax and proper motion not measured). Finally, with 0.6-2 arcsec separation, many DR3 sources needed six-parameter solutions, because they had no well-determined colour from the previous DR2, and a pseudocolour had to be estimated as the sixth astrometric parameter. In future Gaia data releases, the angular resolution will be reduced to about 0.1 arcsec. With a longer full observing period and higher numbers of visibility periods Ν per for each detected object it will also be easier to distinguish between mismatched detections of different faint objects and real HPM objects in crowded fields.
Because of the already mentioned 25 false HPM objects among DR2 HVS candidates (Sect. 2.2), the sky distribution of faint (G> 18 mag) HPM stars measured in DR2 and DR3 were investigated. No further selection with respect to their parallax significance or other astrometric quality parameters was made at this point, to find out how well the cross-matching of Gaia detections worked in fields of high stellar density. With a proper motion limit of PM>60 mas yr−1, the DR2 HPM stars are strongly concentrated in some areas towards low Galactic latitude, in particular in the GC region, whereas the DR3 HPM stars are more uniformly distributed on the sky. Therefore, the proper motion diagrams in selected relatively large and equal-size sky areas along the Galactic plane were studied (Fig. 9). In selected smaller sky areas of high stellar density, containing for instance the LMC, the Small Magellanic Cloud (SMC), and some Galactic globular clusters, no obviously spurious HPMs were found.
The strongest effect was uncovered for DR2 proper motions in the GC region (upper middle panel in Fig. 9) in form of unexpected cross-like proper motion spikes. These spikes in the DR2 HPM data are getting sharper and change their angles, when one selects smaller sub-areas just north/south and east/west from the GC (not shown here). A change in the direction of and angle between the spikes can also be observed in the upper right panel, corresponding to a sky area centered on (GLON=60°, GLAT=0°). In the Galactic anti-centre area, only two weak spikes can be seen in the DR2 data (upper left panel). Most of the spiky structure in the DR2 proper motion diagrams is no longer visible in the corresponding DR3 diagrams. Except for these obviously false proper motions, one can also see that small numbers of other HPM stars in the outer parts of the DR2 panels do not appear in the corresponding DR3 panels. The latter can be expected from random pairing of unrelated object detections (mismatching) in crowded fields, whereas the spikes in the proper motion distributions may be the result of enhanced mismatching along certain scan directions.
Out of the three selected fields, the Galactic anti-centre area is probably less affected by crowding. If one considers all ≈5300 DR3 objects in this field without any obvious spiky proper motion structure (lower left panel of Fig. 9) real HPM stars, one can estimate the number of false HPM objects in the other fields by assuming for simplicity a uniform number density of real HPM stars on the sky. In the Galactic plane at GLON=60° (lower right panel), where crowding effects are stronger, slightly more (≈6400 ↔ 120%) HPM objects were measured in DR3, although no proper motion spikes are seen. The DR3 number of HPM objects continues to rise up to ≈ 8300 ↔ 156% in the GC region (lower middle panel), where many HPMs concentrate along spikes and additional false HPM objects may have been measured due to the strongest crowding. The corresponding DR2 numbers rise to ≈9900 ↔ 186% at GLON=60° (upper right panel) and even ≈23 700 ↔ 445% (upper middle panel), mainly because of many more false HPM objects along the spikes. Interestingly, in the direction of the Galactic anti-centre, the number of HPM objects in DR2 (upper left panel) is with ≈4800 ↔ 91% slightly lower than in DR3, although some spiky DR2 proper motions are visible. This indicates that DR3 contains fewer false HPMs, but may also be more complete with respect to real faint HPMs.
How does the picture shown in Fig. 9 change with brighter HPM objects? This was investigated by selecting corresponding HPM objects with PM>60 mas yr−1 in the same sky areas but in the three magnitude bins 17<G<18, 16<G<17, and 15<G<16 [mag]. Traces of the spike-like structure in the proper motion distribution, containing dozens of false HPM objects, can then be found in the DR2 data around the GC (cf. upper middle panel) down to the magnitude interval 16<G<17 [mag]. A few individual false HPM objects measured only in DR2 but not DR3 and located along the previously mentioned spikes appear down to 15<G<16 [mag] in the GC and also in the Galactic anti-centre field. The numbers of measured HPM objects become more and more equal in DR2 and DR3 in each of the three fields, whereas the differences between the fields are reduced with brighter magnitudes down to about 120% at GLON=60° and 135% in the GC region, in comparison to the Galactic anti-centre field. These differences show that the assumption of a completely uniform distribution of HPM stars on the sky is of course not true. The non-uniform sky distributions of HVSs and slightly slower runaway stars were discussed by Kenyon et al. (2014) and Neunteufel et al. (2021).
If the main astrometric quality criterion (Plx/e_Plx>5) applied to HVS candidates (Sect. 2.2) is used for the faint HPM objects shown in Fig. 9, strong proper motion spikes are still visible in the GC region for both DR2 and DR3 data, comparable to what is seen in the two middle panels. However, a different criterion can be used to exclude most of the false HPM objects, namely an increased minimum number of visibility periods Nper (cf. Figs. 2 and 6). The allowed numbers for objects with measured parallax and proper motion in DR2 and DR3 are Nper≥6 and Nper≥10, respectively. This is clearly not yet sufficient in crowded fields, where faint objects appear in such high numbers and with such small separations that a mismatching of downloaded detections cannot be avoided. For the faint HPM objects in the less problematic DR3 data, the false proper motions along the spikes still seen in the lower middle panel of Fig. 9 disappear only with relatively high numbers of visibility periods (Nper≥16).
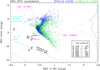 |
Fig. 8 Gaia DR3 colour-magnitude diagram of high-priority (blue plus signs) and low-priority (green crosses) DR3 HVS candidates. The blue and green histograms on the right illustrate the respective absolute magnitude distributions. The region occupied by nearby WDs (Hollands et al. 2018) is bounded by dashed lines, that of hot D6 stars (El-Badry et al. 2023) by cyan dotted lines. The cyan lozenges show S5-HVS1 (Koposov et al. 2020), not included in this study, with its predicted and measured absolute magnitudes (see text). The magenta symbols and labelled objects are as in Figs. 1–4. Two more D6 stars from Shen et al. (2018), D6-1 and D6-3, and six other relatively blue stars (A–F) are also labelled. The vtan_g of the latter six stars are listed in the inset (see also text). |
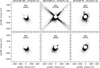 |
Fig. 9 Proper motions of all faint (G > 18 mag) HPM objects (PM > 60 mas yr−1) in Gaia DR2 (upper row) and DR3 (lower row) in three selected 20°×20° fields in the Galactic plane: at the Galactic anticentre (left column), at the Galactic centre (middle), and at GLON=60° (right). The numbers of measured HPM stars in each field are given in round brackets. A few extreme HPM objects (in the upper middle panel more than 700) fall outside the frame. |
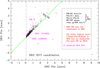 |
Fig. 10 Comparison of measured Gaia DR2 and DR3 parallaxes of high-priority HVS candidates selected from DR2. Out of 1520 candidates 21 are not shown because of lacking DR3 parallaxes. The overplotted coloured symbols and labelled objects are as in Figs. 1–4. The green line indicates equality. |
2.5 Trends from Gaia DR2 to DR3
Individual objects were already mentioned in the previous subsections for their changes towards larger DR3 parallax values with respect to DR2 data. In Fig. 10, the DR2 and DR3 parallax measurements of all DR2-selected HVS candidates (Sect. 2.2) are compared. The DR3 parallaxes of four objects with unconfirmed DR2 proper motions turned out to be much smaller than in DR2, in three cases even negative DR3 parallaxes were measured. For all other objects a general trend towards larger parallaxes in DR3 is observed. About 92% of the DR2 HVS candidates lie above the green line indicating equal parallaxes between DR2 and DR3. These changes lead also to a general decrease in the computed vtan_g values (Fig. 11). Again, for a large majority of 93% of the DR2-based HVS candidates the galactocentric tangential velocities became lower with DR3. The ratio RPlx=Plx/e_Plx>5, used as the only quality criterion in the DR2 HVS selection, increased for 99% of all candidates, where an improvement by a factor 2 or more was achieved for 18% (see inset in Fig. 11), as one could expect from the extended Gaia observations and data reductions resulting in DR3. Out of all 1520 high-priority DR2 HVS candidates with utan_g>500 km s−1, only 348 (23%) show up again among the 1619 high-priority DR3 HVS candidates. Concerning higher velocities, there were 66 DR2 HVS candidates with utan_g> 700 km s−1, from which only seven (11%) still appear among 64 high-priority DR3 HVS candidates with vtan_g>700 km s−1. So, the numbers of HVS candidates in DR2 and DR3 are similar, but the overlap of the samples reduces with higher velocities.
Excluding stars with spurious DR2 HPMs, which were still used by Du et al. (2019), Li et al. (2023), by applying their own different quality criteria, mentioned systematically larger distances of the remaining common stars in the previous study of Du et al. (2019). Li et al. (2023) argued that the official DR2 parallax zero-point correction of 0.029 mas, found from using quasars (Lindegren et al. 2018) and taken into account by Du et al. (2019), was not sufficient. Since the HVSs from Du et al. (2019) were relatively bright, Li et al. (2023) recommended using a larger correction of about 0.05 mas found by Schönnen et al. (2019) and Zinn et al. (2019), for bright stars. In Fig. 12, the parallax differences (DR3-DR2) of all DR2 HVS candidates, except for 21 objects without DR3 parallaxes and four objects with unconfirmed proper motions, are shown as a function of G magnitude. The median parallax difference of 0.049 mas agrees very well with the above suggested correction. However, individual parallax differences are much larger (up to almost 3 mas), and the mean values are larger than the overall median for both bright and faint stars. Only in the magnitude interval 13<G<14 (mag) the mean parallax difference falls below 0.05 mas.
 |
Fig. 11 Comparison of computed galactocentric tangential velocities based on Gaia DR2 and DR3 data for high-priority HVS candidates selected from DR2. The overplotted coloured symbols and labelled objects are as in Figs. 1–4. The magenta dashed line marks the velocity limit set by Scholz (2018). The green line indicates equality. The ratios RPlx=Plx/e_Plx are compared in the inset, where the green line again indicates equality, and the yellow line a 2:1 relation. |
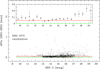 |
Fig. 12 Parallax differences dPlx (DR3-DR2) vs. DR3 G magnitudes for 1495 high-priority DR2 HVS candidates with confirmed proper motions in DR3. The red line indicates their median parallax difference, the green line equal parallaxes. The inset shows mean parallax differences and standard deviations in 0.5 mag bins. |
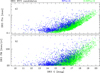 |
Fig. 13 Parallaxes (top) and total proper motions (bottom) of DR3 HVS candidates of high priority (blue plus signs) and low priority (green crosses) as a function of G magnitude. |
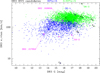 |
Fig. 14 Tangential velocity errors e_vtan of high-priority (blue plus signs) and low-priority (green crosses) DR3 HVS candidates as a function of G magnitude. For the overplotted open circles and labelled objects, compare with Fig. 8 and see text. |
2.6 DR3 HVS selection effects with magnitude
The strongly magnitude-dependent parallax errors in DR3 Lindegren et al. (2021, see their Fig. 7) and our HVS selection criteria, mainly the required significance of parallaxes and minimum proper motion, lead to some selection effects with G magnitude. Figure 13 demonstrates that the parallaxes (panel a) of the HVS candidates begin to rise with faint magnitudes, at G≳ 14.5 mag for high-priority and at G≳ 16.5 mag for low-priority candidates. There are also very few candidates at the lower parallax limit of 0.1 mas. Only small numbers of additional more distant HVS candidates were excluded by the condition Plx>0.1 mas, namely five (compared to 1619 selected) high-priority and 49 (compared to 4228 selected) low-priority candidates. Already after applying only two selection criteria, a proper motion limit of PM>25 mas yr−1 slightly above the limit used in the HVS selection and RPlx>3 as used for low-priority HVS candidates, to the whole DR3, there are no objects with parallaxes below 0.1 mas left. Only about 1500 out of 14.2 million selected objects have small parallaxes in the range of 0.1–0.2 mas. With RPlx>5 the corresponding numbers reduce to about 400 out of 12.2 million. In both cases, the parallaxes of all these HPM objects with PM>25 mas yr–1 do also increase with fainter magnitudes in a similar way as seen in Fig. 13 (panel a). Panel b of Fig. 13 shows that the proper motions of our HVS candidates also become higher with very faint magnitudes, at G≳17 mag for high-priority and at G≳18 mag for low-priority ones. The faintest objects of each category have PM> 100 mas yr−1. Here, the reason is the HVS selection by high galactocentric tangential velocity and the trend towards nearer objects with fainter magnitudes (panel a).
Figure 14 shows that the tangential velocity errors of the DR3 HVS candidates do not change much with G magnitude. The errors of 4228 low-priority candidates lie in the range of 80–560 km s−1 (with a mean of 198 km s−1). Among high-priority candidates, the ten most significant parallaxes reach ratios of about 20<RPlx<65. Therefore, the minimum error of 7 km s−1, computed for the labelled object C (= LP 40-365) already discussed in Sects. 1, 2.2, and 2.3, is 36 times smaller than the maximum error of 250 km s−1. The mean error of all 1619 high-priority candidates is with 104 km s−1 about two times smaller than that of low-priority candidates. It is remarkable (and logical) that the maximum errors in both groups belong to the objects with the most extreme vtan_g (see Fig. 7), D6-1 and D6-3 (labelled). From three other extreme HVS candidates previously selected in DR2 by Scholz (2018) and still appearing with high priority in DR3, Gaia DR2 3841458366321558656 exhibits arelatively large error of the tangential velocity, whereas the errors of D6-2 and Gaia DR2 6097052289696317952 are smaller. These and some other candidates, including object D that appeared next to the D6 objects in the CMD (Fig. 8) but was found by El-Badry et al. (2023) to be spectroscopically similar to object C (LP 40-365), are also labelled in Fig. 14.
2.7 Comparison with DR3 radial velocities
With Gaia DR3, RV measurements of many of the brighter (G< 15.5 mag) HVS candidates became available. Out of 1619 high-priority DR3 HVS candidates 532 (33%) have measured RVs, whereas among the mostly faint 4228 low-priority candidates, which show a peak in their magnitude distribution at G≈17 mag (see Fig. 6), only 155 (4%) have RVs in DR3. Comparing these RVs with the vtan_g values (Fig. 15) one can see that all RVs are within ±500 km s−1, that is lower than the minimum vtan_g used in the selection of the HVS candidates. There is also no trend towards a higher RV dispersion with more extreme vtan_g values, as one could expect for a sample of real HVSs. The RV standard deviation of high-priority candidates remains the same (±145 km s−1) for objects with vtan_g below and above 700 km s−1 . For low-priority candidates it is even smaller and slightly decreases with higher vtan_g.
In any comparison of Gaia tangential velocities and RVs for objects with only moderately significant parallaxes like our HVS candidates, one should keep in mind the very different velocity errors. The mean error bars of high-priority and low-priority HVS candidates with available RVs in DR3 are shown in Fig. 16. The mean RV errors only slightly change from about ±5 km s−1 to ±7 km s−1, respectively. On the other hand, the tangential velocity errors are dominated by relatively large parallax errors, whereas the proper motion errors of these HPM stars can be neglected. Therefore, in this comparison with RVs, the already very large mean tangential velocity errors of the DR3 high-priority HVS candidates of about 102 km s−1 are about twice as large (208 km s−1) for the low-priority candidates. Very similar mean tangential velocity errors were found for the complete HVS samples (see Sect. 2.6).
The two most extreme (vtan_g> 900 km s−1) candidates with available DR3 RVs are of low priority only (labelled in Fig. 15). Their tangential velocity errors are large (270–285 km s−1). Both are at parallactic distances of 9–10 kpc. One, Gaia DR3 6116771824584329856, has a relatively high RV of +389.0±7.7 km s−1 measured in DR3 and is listed in SIM-BAD as the known RR Lyrae variable V513 Cen. However, its RV is not yet mentioned in SIMBAD. The other, Gaia DR3 6752707497293165952, has an RV of +106.7±11.8 km s−1 and no SIMBAD entry. For V513 Cen, the All-Sky Automated Survey for Supernovae (ASAS-SN; Jayasinghe et al. 2018) catalogue of variable stars provides a period of about 0.5 days4. Its variability was also mentioned and classified in DR2, according to which it belongs to the class of fundamental-mode RR Lyrae stars, but not in DR3.
The heliocentric tangential velocity vtan can be expected to be only  times higher than the RV, if one assumes for simplicity an isotropic stellar distribution. When Palladino et al. (2014) compared vtan and RV of their HVS candidates, they mentioned much higher transverse-to-radial velocity ratios and concluded that their HVS sample was strongly affected by large proper-motion errors (see their Fig. 1). This conclusion was later confirmed by Ziegerer et al. (2015, see their Fig. 2), who measured smaller proper motions for most of the HVS candidates of Palladino et al. (2014). In Fig. 16 one can see that the majority of our DR3-selected HVS candidates with available DR3 RVs, 376 of 532 high-priority candidates (71%) and 119 of 155 low-priority candidates (77%), have vtan values more than 5 times higher than their absolute RVs. However, in this case the sample is likely not affected by proper motion errors but underestimated parallaxes. The Gaia proper motion measurements of the DR3-selected HVS candidates will probably not change much, whereas the trend towards larger parallaxes noted from DR2 to DR3 (Sect. 2.5) may continue with the next Gaia data release.
Among the HVS candidates, only small numbers have extremely high velocities vtan_g>700 km s−1, 64 out of 1619 (4%) high-priority and 305 out of 4228 (7%) low-priority candidates. Two of the low-priority extreme HVS candidates lack BP, RP photometry and are therefore not shown in the corresponding CMD (Fig. 17). Interestingly, for candidates with available DR3 RVs (Fig. 15) including only relatively bright stars (G< 15.5 mag), almost equal numbers of high- and low-priority objects, 41 out of 532 (8%) and 39 out of 155 (25%) appear as such extreme HVS candidates, respectively. However, these 39 low-priority candidates are on average 0.7 mag fainter and 1.15 times more distant than the 41 high-priority candidates. Both groups mainly consist of distant giants, as can be seen in the Gaia DR3 CMD of extreme (vtan_g>700 km s−1) HVS candidates (Fig. 17). Except for the bluest, the majority of high-priority candidates at the bright end of this CMD have DR3 RVs measured.
The brightest (G≈ 12.2 mag) of the blue stars lacking DR3 RV measurements is TYC 1621-272-1 (labelled in Fig. 17). With its highly significant DR3 parallax of 0.181±0.018 mas it has a relatively well-measured heliocentric tangential velocity of 842±84km s−1 but no references in SIMBAD5 and, according to VizieR6, also no non-Gaia RV measurements until now. Also labelled are the blue high-priority HVS candidates Gaia DR3 6862302246501671168 and Gaia DR3 4445879669255704320. Both are included in the catalogue of blue horizontal-branch stars by Culpan et al. (2021), where their high heliocentric tangential velocities (>900 km s−1 ) are listed, although without mentioning their large errors of the order of ±175 km s−1 . The bluest low-priority candidate, Gaia DR3 6885820662780563328, is labelled as well in Fig. 17.
The brightest giants (Gabs<−3 mag) among the extreme DR3 HVS candidates, also labelled in Fig. 17, have both parallaxes and proper motions just above the lower limits (0.1 mas and 20 mas yr−1) chosen for this study and vtan_g≲760 km s−1, but tangential velocity errors in the range 120–260 km s−1. Their RVs are much lower and precisely measured in DR3. For the two high-priority HVS candidates of them, Gaia measured only moderately high RVs of −85.6±0.3 km s−1 (Gaia DR3 1375165725506487424) and −123.4±0.3 km s−1 (Gaia DR3 1591615309672292224), for the low-priority object Gaia DR3 6666207818021916416 a low RV of +22.9±0.7 km s−1. The latter two have according to SIMBAD external RV measurements confirming the Gaia results, whereas the first of these three bright stars (all three have G≈11 mag) had only a similar RV measured before in DR2 and no SIMBAD references. According to DR3, Gaia DR3 1591615309672292224 is a long-period variable candidate. It was also found to be a high-velocity star by Quispe-Huaynasi et al. (2022). A spectroscopic binary classification is given in DR3 for Gaia DR3 6666207818021916416, which is also included in DR6 of the Radial Velocity Experiment (RAVE; Steinmetz et al. 2020) and the Catalina Surveys Southern periodic variable star catalogue (Drake et al. 2017).
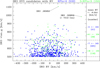 |
Fig. 15 Computed DR3 vtan_g vs. measured DR3 RVs of high-priority (blue filled squares) and low-priority (green dots) DR3 HVS candidates. Two objects with the highest vtan_g are labelled (see text). The mean RVs and standard deviations in the velocity intervals 500<vtan_g<700 (km s−1) and vtan_g>700 km s−1 are listed on the right. |
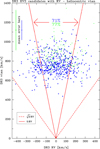 |
Fig. 16 Heliocentric tangential velocity vtan vs. RV of high-priority (blue filled squares) and low-priority (green dots) DR3 HVS candidates. Their mean error bars are shown at the top left. The red dashed line indicates a vtan |

3 Verification of nearest extreme HVS candidates
So far, in Sect. 2, HVS candidates with parallactic distances up to 10 kpc and moderately high vtan_g>500 km s−1 were considered using only one astrometric quality criterion of Plx/e_Plx>5 (high priority) or 3<Plx/e_Plx<5 (low priority, in DR3). In a more detailed validation of the HVS status, the 72 most extreme (vtan_g>700 km s−1) DR3 HVS candidates with parallactic distances <4kpc were analysed. Most promising among those 72 are only 11 candidates of high priority, but the majority of low-priority candidates were included for completeness. Their basic DR3 photometric and astrometric data, including astrometric quality parameters (see Sect. 3.2 and Table 1), and their computed absolute magnitudes and tangential velocities are listed in Table A.1. They have 32<PM<260 (mas yr−1). Most of the 72 objects are dwarfs according to their location in the CMD (Fig. 17), for which the RV is not available (… in the tables). Only three do have a measured RV in DR3. Among those three are Gaia DR2 6097052289696317952 (labelled and already mentioned earlier) with a relatively low RV of +53.5±4.5 km s−1 and another high-priority candidate (Gaia DR3 1180569514761870720, labelled), also with a low RV of −76.9±1.4 km s−1 . The third is a low-priority HVS candidate (Gaia DR3 716216621590241024, labelled) with a moderately high RV of +311.5±9.2 km s−1 and about three-times higher but uncertain heliocentric tangential velocity of 1032±263 km s−1 (cf. Fig. 16). The DR3 RVs of these three candidates do not strongly support their HVS status.
A possible problem leading to unreliable parallax measurements are close companions, which can occur everywhere on the sky, or overlapping background/foreground stars in crowded fields, in particular in the Galactic plane and GC regions (see Sect. 2.4). After checking DR3 flags and image parameters hinting at possibly disturbed stellar images, each individual target was queried with a radial search for its closest next neighbours in DR3 (Sect. 3.1). In addition, the most important astrometric quality parameters (Sect. 3.2) of objects with similar magnitudes in the wider vicinity of each target (Sect. 3.3) and on the whole sky (Sect. 3.4) were investigated in a local and global comparison, respectively.
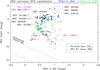 |
Fig. 17 Gaia DR3 colour-magnitude diagram of extreme (vtan_g>700 km s−1) HVS candidates of high priority (blue filled squares) and low priority (green dots). The 80 objects with available DR3 RVs are overplotted by open triangles, the 72 nearest candidates (Plx>0.25 mas) by open hexagons. For labelled objects and the WD region (dashed lines), compare with Figs. 3 and 8 and see text. |
3.1 Close next neighbours
3.1.1 DR3 flags
The DR3 catalogue provides a number of flags and parameters, which can be used to classify potential close binaries or overlapping stars. The flag Dup (= duplicated_source) is set to 1, if multiple sources separated by less than 0.18 arcsec were found. In such cases only one source was kept (Lindegren et al. 2021). This flag as well as the parameter Solved (= astro-metric_params_solved), indicating the type of the astrometric solution (two-, five-, or six-parameter solution), were already briefly discussed in Sect. 2.4. Six-parameter solutions had to derive a pseudocolour in addition to the usual five astrometric parameters, because of lacking colour information in DR2. According to Lindegren et al. (2021), the six-parameter solution is normally only used for sources that are problematic in some respect, for example in very crowded areas. At faint magnitudes (G≳19 mag), the six-parameter solutions begin to be more frequent than five-parameter solutions (Lindegren et al. 2021, their Fig. 5).
Other useful information obtained in the process of the DR3 image parameter determination (IPD) include the parameters IPD fmp (= ipd_frac_multi_peak) and IPD fow (= ipd_frac_odd_win. The first reports on the fraction of observations of a given object where IPD detected more than one peak and may be a hint to resolved binaries that in some scan directions produce more than one peak in the window. As noted by Lindegren et al. (2021), towards the faint magnitudes the ipd_frac_multi_peak is always decreasing, because the diminishing signal-to-noise ratio (S/N) makes the detection of secondary peaks increasingly difficult. The second gives the fraction of field-of-view transits with odd windows and is sensitive to an overlap with another (usually brighter) source in the window (Lindegren et al. 2021). Finally, there is a non-single star flag (= non_single_star) for objects with additional information in the various non-single star tables of DR3.
For none of the 72 nearest extreme HVS candidates a nonsingle star flag was found in DR3. The occurrence of the four other flags and parameters mentioned above is indicated in the CMD (Fig. 18) by overplotted arrows in four different directions. A relatively large number of candidates (18) have IPD fmp>0 (arrows left), followed by ten candidates with six-parameter solutions (arrows up), a relatively small number (5) with IPDfow>0 (arrows right), and only one with Dup>0 (red arrow down). Altogether, 25 candidates are marked by arrows, some with more than one of these four criteria. These 25 objects are located at the bright and faint end of the CMD or to the red side from the MS, but not in the region above the nearby WDs occupied by the most extreme (with respect to their vtan_g) D6 objects (Shen et al. 2018).
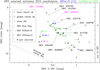 |
Fig. 18 Zoomed-in image of the CMD of the 72 nearest extreme DR3 HVS candidates of high priority (blue filled squares) and low priority (green dots). Only objects with overplotted open symbols passed the local (lozenges) and global (hexagons) checks of astrometric parameters (see Sects. 3.3 and 3.4). One object lacking G-RP colour is shown on the right. The overplotted crosses are objects with a close next neighbour (NN) in DR3, arrows with different directions indicate conspicuous DR3 flags and parameters (see Sect. 3.1). In addition to objects already labelled in Fig. 17, all other high-priority candidates are also labelled (see text). The upper boarder of the nearby WD region is indicated by the dashed line. |
3.1.2 Next neighbour search in DR3
To get even more information on possibly affected astrometric measurements, an own close next neighbour (NN) search within DR3 was carried out around each of the 72 nearest extreme HVS candidates using VizieR. All candidates with at least one other DR3 object with a separation of less than 1.5 arcsec from the target (eight candidates) or with at least one relatively bright (G<17 mag) neighbour separated by less than 4 arcsec (three candidates) were considered as having a close NN that potentially had an influence on the astrometric measurements. Around five other candidates, only fainter neighbours were found at separations of 2–5 arcsec, which were not considered to be problematic.
The G magnitudes of the 16 nearby extreme HVS candidates and the number of detected objects (including the target) within a search radius of 5 arcsec n5as, the magnitude of the nearest neighbour Gnn, and the distance to their nearest neighbour dnn are shown in Fig. 19 and listed in Table A.2. Among the 11 candidates defined to have a close NN and marked by overplotted crosses in Figs. 18 and 19, five have two or more (up to six) DR3 neighbours within 5 arcsec. All 11 appear as red objects in the CMD (Fig. 18), and nine of 11 do also have suspicious DR3 parameters or flags, as marked by the overplotted arrows in different directions. Thus the close NN search partly confirmed and slightly extended the list of 25 previously found problematic HVS candidates based on their DR3 flags and parameters.
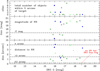 |
Fig. 19 Results of next neighbour (NN) search around 72 nearest extreme HVS candidates of high priority (blue filled squares) and low priority (green dots). Neighbours separated by less than 5 arcsec were found for only 16 objects. Plotted over their G magnitudes are the total number of objects within 5 arcsec (top), the magnitude of the NN (middle), and the distance to the NN (bottom). The overplotted crosses are the 11 objects with a close NN expected to have affected the astrometry. One candidate without a NN but with a DR3 Dup flag is shown for comparison (red arrow down). |
3.2 DR3 astrometric quality parameters
The Gaia DR3 provides a very large number of parameters and flags, which can be used for a quality assessment of each individual source. The Gaia Catalogue of Nearby Stars (GCNS; Gaia Collaboration 2021) served as a good example for a careful DR3 quality check. More than 40 catalogue columns were involved in the classification of good astrometric solutions, when the GCNS was constructed. From about 500 000 stars with measured G magnitudes and G–RP colours, and with parallaxes Plx> 10 mas, only about 296 000 (59%) entered after their random forest classification the reliable 100 pc sample. The rejected about 204 000 (41%) objects are strongly concentrated in a wide region towards the GC (|GLAT|<15°, GLON<90° or GLON>270°) and two small regions towards the LMC and SMC but do also show patterns corresponding to the scanning law of the satellite with presumably low numbers of visibility periods Nper (Gaia Collaboration 2021, see their Fig. 1). All 15 astrometric parameters found as the most important ones by Gaia Collaboration (2021, their Table A.1), except for the proper motion components pmRA (= pmra) and pmDE (= pmdec), were also used in our evaluation of the 72 nearest extreme HVS candidates. Table 1 summarises the used parameters and flags with fixed limits applied throughout the paper (RPlx) and in the analysis of possibly disturbed images caused by an unresolved binary or close NN (Sect. 3.1) in the upper part. In the lower part of Table 1 those parameters are listed, for which the target’s values were compared to the 0.75 quantile q75 and (in case of Nper) median (0.5 quantile) values med of large samples of objects with similar magnitudes selected for local (Sect. 3.3) and global (Sect. 3.4) comparison.
One can consider the ratio of parallax to parallax error RPlx (= parallax_over_error) as the principal quality parameter of HVS candidates, because it has a direct influence on the significance of the computed high tangential velocity. The important role of one of the other parameters included in Table 1, Nper (= visibility_periods_used), was already discussed in Sects. 2.2–2.4. Its improvements from DR2 to DR3 were demonstrated in Figs. 2 and 6. The standard uncertainties in the measured parallax and proper motion components of DR3, e_Plx (= parallax_error), e_pmRA (= pmra_error), and e_pmDE (= pmdec_error), are known to increase with fainter magnitudes. As shown in Lindegren et al. (2021, their Tables 4 and 5), respectively for five- and six-parameter astrometric solutions, the corresponding median errors in a given magnitude interval are very similar to each other, with those of e_pmDE (in mas yr−1) being always, except for the faintest magnitude bin at G=21 mag, slightly smaller than of e_pmRA (in mas yr−1 ) and e_Plx (in mas). Six-parameter solutions, which are marked with a value of 95 for the parameter Solved (= astro-metric_params_solved), generally exhibit larger uncertainties.
According to Lindegren et al. (2021), the most relevant goodness-of-fit statistics describing how well the observations correspond to a single-star model come on one hand from the IPD. These are IPDgofha (= ipd_gof_harmonic_amplitude), which could become large for sources that have elongated images, such as partially resolved binaries, and the already mentioned (in Sect. 3.1) parameters IPDfmp and IPDfow. In comparison to five-parameter solutions, the latter are much larger for six-parameter solutions (Lindegren et al. 2021, their Tables 4 and 5), On the other hand, the quality of the astro-metric solution should be mainly described by the re-normalised unit weight error RUWE (= ruwe) and the excess source noise epsi (= astrometric_excess_noise) and its significance sepsi (= astrometric_excess_noise_sig). The excess source noise epsi (in units of mas) is usually considered to be significant, if sepsi>2.
Also given in units of mas is amax (= astromet-ric_sigma5d_max), which was already described in DR2 as the five-dimensional equivalent to the semi-major axis of the position error ellipse that is useful for filtering out cases where one of the five parameters, or some linear combination of several parameters, is particularly bad (Lindegren et al. 2018). A parameter that was not given special attention by Lindegren et al. (2021) is the goodness-of-fit statistic of model with respect to along-scan observations go fAL (= astrometric_gof_al). However, this parameter was listed among the 15 relevant features for the construction of the GCNS (Gaia Collaboration 2021). An upper limit of go fAL<3 was formerly used in the selection of HVS candidates in DR2 by Bromley et al. (2018), Scholz (2018), and Marchetti et al. (2019).
3.3 Local comparison of astrometric parameters
The stellar density and probability of overlapping objects may change over small sky areas, and a local comparison of astrometric parameters may be useful. To find out how typical in a given sky region the quality of the Gaia DR3 measurements was for each of the 72 nearest extreme HVS candidates, all its wider NNs were extracted using VizieR with a maximum search radius of 3600 arcsec and a maximum number of 9999. Among these NNs only those with roughly similar (±0.5 mag) G magnitudes to that of the target and with measured parallaxes and proper motions (which means five- or six-parameter solutions) were selected for the comparison of ten DR3 quality parameters listed in the lower part of Table 1. The effective search radius was smaller (down to 216 arcsec) in crowded regions, and the number of comparison objects within the effective search radius varied between about 50 for the brightest and 2800 for the faintest targets.
All comparison objects, including the target, were sorted by a given parameter. In case of the integer parameter Nper, where small values indicate problematic measurements, the median med corresponding to the 0.5 quantile was considered as an allowed lower limit for the target. The more negative the local difference lΔ (Nper value of the target minus the median Nper of local comparison objects) is, the less reliable astrometric measurements can be expected. These differences lΔ are listed in Table A.2, where lΔ<0 can be considered critical. The reason for locally small N per values may be a combination of image crowding, telemetry limits and object-matching problems. In case of the nine other parameters, where large values report on problems, the 0.75 quantile q75, that is the limit below which 75% of all comparison objects were falling, was considered as critical for the target. Since some of the parameters (epsi, sepsi) can have zero values, the corresponding q75 could be zero, too. However, this was not the case for the comparison samples of 72 targets. Therefore, for nine parameters the local ratio lR (given in Table A.2) of the value of the target to the 0.75 quantile of local comparison objects describes quantitatively, how unusual the target’s value is in its sky region. All lR>1 indicate critical parameter values.
3.4 Global comparison of astrometric parameters
For a global comparison of the same ten DR3 quality parameters (lower part of Table 1) as used in the local comparison (Sect. 3.3), from all about two million DR3 HPM stars with PM > 60 mas yr−1 only those with exactly the same magnitude (±0.005 mag) as that of the target were selected. In this case, the numbers of comparison objects varied between about 600 for the brightest and 3300 for the faintest targets. As HPM objects represent a special class of objects with highly significant proper motions, their properties may be different in comparison to the hundreds of millions of slow-moving objects dominating the typical parameter quality as a function of magnitude described by Lindegren et al. (2021, their Tables 4 and 5). Again, all our comparison objects including the target were sorted by a given parameter. Negative global differences gΔ (Nper value of the target minus median N per of all global comparison objects) given in Table A.2 mainly indicated a still insufficient coverage of that sky region according to the scanning law of Gaia. For the other nine parameters, the global ratio gR (Table A.2) of the value of the target to the 0.75 quantile of global comparison objects was computed. Again, gΔ<0 and gR>1 are critical values.
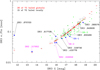 |
Fig. 20 DR3 e_Plx of 72 nearest extreme HVS candidates (high priority = blue filled hexagons; low priority = green dots) as a function of G magnitude. The thin black and thick red horizontal bars show q75 values of local and global comparison objects, respectively. |
3.5 No good candidates fulfilling all criteria
Taking into account RPlx as the most important quality parameter of HVS candidates joined by the exposure of close NN (marked in Fig. 18 with crosses), available IPD and other flags (marked with arrows), and the analysis of ten astrometric parameters in the local and global comparison, no convincing candidates are left. In particular, none of the 11 high-priority and only seven out of 61 low-priority candidates (all seven are faint, with G> 17.5 mag, and six of seven have RPlx<4) passed both the local and global check of all ten parameters (Fig. 18). The three faintest of these seven low-priority candidates (with Gabs>7.5 mag and G≳19 mag) have flags (overplotted different arrows in Fig. 18) indicating crowding and IPD problems and very small RPlx≈3.
Original DR3 parameters (rounded) of all 72 HVS candidates are listed in Table A.1. In the lower part of Table 1 the relatively large numbers of objects among the 72 candidates with astrometric parameters exceeding the allowed q75 upper limits (or falling below the median of N per) in the local and global comparison are summarised. Only for epsi and sepsi, the local comparison revealed higher numbers of such outliers than the global one. In case of gofAL and RUWE, the numbers of problematic candidates are equally high, whereas for the other six parameters, the global comparison turned out to be more problematic, with up to almost twice as many failed candidates than in the local comparison in case of N per. The individual results, including the differences lΔ and gΔ for N per and ratios lR and gR for nine other astrometric parameters, are listed in Table A.2.
3.5.1 e_Plx, e_pmRA, and e_pmDE
The DR3 parallax errors e_Plx of the 72 candidates are shown in Fig. 20 together with the corresponding q75 values found in the local and global comparison. The proper motion errors e_pmRA and e_pmDE and their local and global comparison look very similar and are not presented here. All high-priority candidates, as well as the low-priority candidate D6-3, are labelled in this and the following figures. The brightest six candidates (G< 15.85 mag), including the two high-priority candidates Gaia DR3 1180569514761870720 and Gaia DR2 6097052289696317952, the latter of which appeared in DR2 as a much more extreme HVS (Scholz 2018), exhibit unusually large errors in both local and global comparisons. As outlined at the beginning of Sect. 3, the HVS status of these two candidates was also not supported by their DR3 RVs. At the faint end (G > 18.9 mag), there are four low-priority objects with errors well below the allowed local and global comparison limits. At intermediate magnitudes, the errors of the targets (in particular of low-priority ones) are scattered around these limits. Except for two bright objects already mentioned above, only one more high-priority candidate (Gaia DR3 1820931585123817728) shows an unusually large e_Plx. These three high-priority HVS candidates appear clearly questionable with respect to other parameters, too (see next figures and Table A.2).
3.5.2 RUWE
For one of the most important astrometric quality parameters, RUWE (Lindegren et al. 2021), Fig. 21 demonstrates how close the 0.75 quantiles of our comparison objects come to the ideal value of 1.0 with fainter magnitudes. This can be observed in the local comparison with all objects as well as in the global comparison with HPM stars at G≳ 16 mag. Already with G > 13 mag the DR3 0.75 quantiles of RUWE are much smaller than 1.4, the critical value recommended for DR2 by Lennart Lindegren in the Gaia technical note GAIA-C3-TN-LU-LL-1247 in 2018.
The median RUWE values of all five-parameter solutions, including predominantly slow-moving and non-significant proper motion objects, in DR3 (Lindegren et al. 2021, their Table 4), are in the narrow range of 1.01–1.02 for G= 14–21 mag and rise only to ≈1.04 for brighter objects (G=9–12 mag). In our global comparison, the q75 values of RUWE reach a minimum of 1.045 at G≈18 mag, rise up to about 1.08 both at the faint end at G≈20 mag and towards brighter objects at G≈16 mag, and rapidly increase to about 1.4 at G≈12 mag. These values are better comparable (but not equal) to the DR3 median values of all six-parameter solutions (Lindegren et al. 2021, their Table 5). Except for three bright stars already mentioned in the preceding paragraph, which have very large RUWE> 1.4, almost all other high-priority candidates pass the RUWE quality check both locally and globally. Again, the low-priority candidates show a large spread around the allowed limits.
3.5.3 epsi and sepsi
The results of the local and global comparison of the excess source noise epsi and its significance sepsi, described by Lindegren et al. (2021) as the next most relevant parameters from the astrometric fit, are shown in Figs. 22 and 23. For 29 of 72 objects DR3 provides zero values of these two parameters. Whereas the 0.75 quantiles of epsi are below 0.2 mas for the brighter (G< 17 mag) global comparison HPM objects, they rise up to about 1.5 mas at the faint end (G≈20 mag). The local comparison, which included objects of small (non-significant) proper motions, provided systematically smaller 0.75 quantiles of epsi around most of the targets. Similarly, the local 0.75 quantiles of sepsi are smaller than the global ones. The global 0.75 quantiles of sepsi exceed the level of 2.0, where the excess source noise starts to be statistically significant according to Lindegren et al. (2021), at brighter magnitudes only (G < 15.5 mag). A dip slightly below that level can be seen at G ≈ 17 mag in Fig. 23.
A cut at sepsi=2.0, applied for example by Bromley et al. (2018), provided similar results to the used 0.75 quantiles of sepsi in the global comparison. Among the 43 candidates with non-zero excess source noise, there are six high-priority ones, including three with large significant values. These three were already mentioned as problematic with respect to other parameters. Among 37 low-priority candidates with epsi>0 mas the majority do also show sepsi>2.0, with slightly growing numbers exceeding the 0.75 quantiles of sepsi in the global and local comparison, respectively. If an epsi>0 mas was measured, it was typically much larger than the parallax error e_Plx (Fig. 20). About two times larger values than e_Plx were found for epsi, even when it was formally non-significant (sepsi< 2.0).
3.5.4 IPDgofha
Figure 24 shows that the parameter IPDgofha, generated in the IPD before the astrometric solution, is almost constant over a wide magnitude range with its q75 values at a level of 0.03 in the global comparison. Only at very faint magnitudes (G>19 mag), the q75 values are slightly increased. Smaller and similar (and also almost constant) median values, of 0.02 for five-parameter and 0.03 for six-parameter solutions, were reported for the complete DR3 in Lindegren et al. (2021, their Tables 4 and 5), respectively. The corresponding q75 from the local comparison appear widespread around the global level, except for brighter objects (G< 15.5 mag), where they are almost equal. Interestingly, the formerly mentioned three bright high-priority candidates with problematic astrometric parameters are inconspicuous at least in the global comparison, whereas some other high-priority candidates seem to have problems with IPDgofha. However, with this parameter, the number of failed candidates is relatively small, in particular in the global comparison (Table 1).
3.5.5 gofAL and amax
The distribution of gofAL with G magnitude (not shown) appears very similar to that of RUWE. Almost all q75 values fall clearly below the critical level of gof AL=3, used for instace by Bromley et al. (2018) and Marchetti et al. (2019). The location of individual gofAL above and below the comparison q75 values is nearly identical to that of the corresponding RUWE (Fig. 21).
Also not shown are the amax data. In this case, the general trend with magnitude looks similar to that of e_Plx (Fig. 20). Individual amax, in particular of some high-priority candidates, appear to be more critical with respect to their q75 values than in case of e_Plx. The amplitude of the global comparison q75 of amax (given in mas, as for e_Plx) is over the whole magnitude range about 1.65 times larger than that of the corresponding e_Plx.
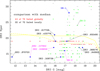 |
Fig. 25 DR3 N per of 72 nearest extreme HVS candidates (high priority, blue filled hexagons; low priority, green dots) as a function of G magnitude. The thin black and thick red horizontal bars show median values of our local and global comparison objects, respectively. The yellow solid and dashed lines show mean N per of all DR3 five- and six-parameter solutions (Lindegren et al. 2021, their Tables 4 and 5) for comparison. |
3.5.6 Nper
Finally, in Fig. 25 the N per of 72 candidates are compared to median values of similarly bright objects in their vicinity and of equally bright HPM stars globally. The global median N per of HPM stars are mostly equal to 19 (42 of 72 = 68%) or 18 (22 of 72 = 31%). Only for the faintest target (G=20.15 mag), it is 17. These integer values are systematically smaller than the mean (non-integer) N per of all five-parameter solutions in DR3 and partly comparable to those of all six-parameter solutions (Lindegren et al. 2021, their Tables 4 and 5). On the other hand, the median N per of local comparison stars vary a lot, from 13 to 31.
The target N per also occupy the whole parameter space between these two extremes. The majority of all candidates, including those of high priority, have N per equal to or above the median found in the local comparison but below the global comparison median values. With this parameter, the number of failed candidates (41 of 72 = 57%) in the global comparison is higher than with any of the other nine parameters considered alone either locally or globally (Table 1). Compared to the mean N per of all five-parameter solutions even more (52 of 72 = 72%) objects fall below this limit. This means that most of the 72 HVS candidates are located in sky regions, which have had relatively few Gaia observations so far (in DR3). As outlined in Sect. 2.4, there may be even spurious HPMs in crowded regions, which could lead to false HVS candidates. Such spurious HPMs could still be detected in DR3 with N per < 16. We note that out of the 72 candidates 22 (31%) have such extremely low N per values.
3.6 Best candidates with relaxed criteria
There are candidates that failed only a few of the tests summarised in Table 1, where they at the same time almost reached the allowed limits. For a new selection with relaxed criteria, one can, on one hand, decrease the limit for RPlx, to include the best of the low-priority candidates. On the other hand, one can allow for smaller N per and larger values of the other nine astrometric parameters in the local and global comparison, to include the majority of the most extreme (vtan_g>1000 km s−1) high-priority candidates. The following set of relaxed criteria
RPlx > 4
lΔ ≧ −2 and gΔ ≧ −2 (for N per)
lR < 1.6 and gR < 1.6 (for nine other parameters)
is fulfilled by 11 out of 72 candidates (see Table A.2). Conveniently, these eleven (seven high-priority and four low-priority) candidates are also clean with respect to close NNs, IPD, and other flags (described in Cols. 3–9 of Table A.2). Based on the data in Tables A.1 and A.2, an alternative set of best HVS candidates can be selected (e.g. by using different weights for RPlx or other parameters). Our shortlist of eleven HVS candidates briefly described below is sorted by decreasing galactocentric tangential velocity vtan_g (given in Table A.1). Previously measured DR2 parallaxes and relatively low Galactic latitudes |GLAT|<25° (not included in Table A.1) of four of the objects will also be mentioned. The seven high-priority and the first listed low-priority object are among the labelled objects in the zoomed CMD (Fig. 18) and in Figs. 20–25, describing the local and global comparison. The first four objects were already mentioned before and shown in previous figures. Only the first five have an entry in the SIMBAD data base. The running number in Tables A.1 and A.2 is given first for each of the eleven objects:
No. 56 = D6-3 = Gala DR3 2156908318076164224. Alias LSPM J1852+6202, this is one of four low-priority (3<RPlx<5) candidates that passed all local and global quality checks (over-plotted open lozenges and hexagons in Fig. 18), were not found to have close NNs (no crosses) and not flagged concerning IPD parameters, duplicity or six-parameter solutions (no arrows). It has a relatively high RPlx≈4.3 in DR3 (3.4 in DR2) and is therefore included in this shortlist. It was observed quite often (N per=24). The uncertain heliocentric and galactocentric tangential velocities are equally high (>2300 km s−1, with an error of >500 km s−1 ). With G≈18.2 mag it belongs to the faint candidates, for which the binary detection in the IPD (using IPDfmp) becomes difficult (Lindegren et al. 2021). The object D6-3 is one of two D6 objects (the other was D6-1), for which a zero RV was measured by Shen et al. (2018). They mentioned the possibility that the DR2 parallaxes used by them could be systematically underestimated and the tangential velocities much lower. Then these two D6 objects could change their location in the CMD (cf. Figs. 8 and 18) and move to the region of faint nearby WDs. However, the DR3 parallax of D6-3 (0.423±0.099 mas) did not change much in comparison to DR2 (0.427±0.126 mas), but just became more significant. With GLAT≈+24° this object is located relatively close to the Galactic plane. According to its phot_variable_flag in DR3 D6-3 seems to be variable and is even listed in DR3 as an eclipsing binary candidate. However, Holl et al. (2023) included it in their list of spurious signals.
No. 40 = D6-1 = Gala DR3 5805243926609660032. This ≈1 mag brighter HPM star (already listed in Monet et al. 2003) has even more observations (N per=28) than D6-3 and a more precise high vtan_g of over 1700 km s−1. The RPlx≈7.6 of D6-1 represents the second largest value among all eleven candidates described in this subsection. However, in the local comparison (with other objects in this frequently observed sky field) this candidate shows 1% larger RuWe, >10% larger IPDgofha, and 35% larger gofAL than the corresponding q75 of comparison objects. Both RUWE and IPDgo fha may be indicative of binaries (Lindegren et al. 2021). It appears puzzling that, together with D6-3, D6-1 has a measured RV consistent with a zero value (Shen et al. 2018). The DR3 parallax of D6-1 (0.531+0.070 mas) is 13% larger than measured in DR2 (0.471+0.102 mas), inagreement with the trend found for DR2-selected high-priority HVS candidates (Sect. 2.5). With GLAT≈−18°, D6-1 lies even closer to the Galactic plane than D6-3.
No. 28 = D6-2 = Gaia DR3 1798008584396457088. This is the highest-priority candidate (RPlx≈18.2) in the shortlist and also in the full list of 72 candidates, with the most precise extreme vtan_g of ≈ 1100 km s−1. But it is not stainless. With a relatively small N per=16, it lies below the median of comparison objects both locally and globally. So, contrary to the previous two candidates in the shortlist, D6-2 (= NLTT 51732) still suffers from too few observations in the Gaia survey. With a parallactic distance of ≈840pc it is the nearest candidate in the shortlist. It is the brightest of the three D6 HVS candidates discovered by Shen et al. (2018) in DR2, and only for this one they measured a high RV confirming its HVS status. Selected DR2 astrometric quality parameters of D6-2 were considered by Scholz (2018), as coming close to critical limits (sepsi=1.8, go fAL=2.7 Nper=9) but, except for Nper, this is no longer valid in DR3. Nevertheless, as in the case of D6-1, the DR3 parallax of D6-2 (1.194+0.065 mas) turned out to be 13% larger than previously measured in DR2 (1.052+0.109 mas), where it already appeared as a clear high-priority candidate (Sect. 2.2). The Galactic latitude (GLAT≈−20°) is similar to that of D6-1. The infrared excess found for D6-2, but not for D6-1 and D6-3, was attributed to circumstellar material by Chandra et al. (2022), who ruled out a red companion.
No. 07 = Gaia DR3 3841458366321558656. The brightest of the eleven best candidates, concerning both apparent and absolute magnitude (see Table A.1 and Fig. 18), is Gaia DR3 3841458366321558656. For this moderately HPM star Zacharias et al. (2013) already measured a proper motion similar to that in DR3. After D6-2 and D6-1, its RPlx≈7.4 represents the third largest value in the shortlist. With Nper=17 it shows a deficit of observations in the global comparison, where it also failed the test of IPDgofha (almost 60% larger than the corresponding q75 value). Regarding all other parameters and flags there are no complaints. The vtan_g of Gaia DR3 3841458366321558656 of −1000 km s−1 is nearly as high as with D6-2, but much more uncertain, mainly because of a more than three times larger parallactic distance. Similar to D6-2, Gaia DR3 3841458366321558656 was already selected as high-priority HVS candidate in DR2 (Sect. 2.2) and listed in Scholz (2018). It was also included in the DR2 HVS candidate list of Du et al. (2019, their Table 2), which otherwise was highly contaminated by spurious HPM objects (Sects. 2.2 and 2.4). The DR3 parallax of Gaia DR3 3841458366321558656 (0.325±0.044 mas) remained stable but became more significant than in DR2 (0.334±0.063 mas). The low RV of ≈−10 km s−1 measured by Li et al. (2018) does not support an HVS status. They classified this star as carbon-enhanced metal-poor (CEMP) candidate, in agreement with Lucey et al. (2023) who used DR3 BP/RP spectra.
No. 62 = Gaia DR3 3730485894679948928. The faint (G≈ 18.4 mag) HPM star Gaia DR3 3730485894679948928 was already known before Gaia as LSPM J1257+0715 (Lépine & Shara 2005). With RPlx≈5.0, it just entered the high-priority class in this study. With Nper=17, it lies slightly below the local and global median values, and in one proper motion component (pmRA) the error exceeds the global comparison value by a few percent only. The heliocentric tangential velocity of this highest Galactic latitude (GLAT≈+70°) star in the shortlist is ≈ 1000 km s−1, whereas the galactocentric star is only above 800 km s−1. Here, the DR3 parallax (0.898±0.179 mas) is more significant but 10% smaller than in DR2 (0.995±0.236 mas), wherein this candidate would have been selected with low priority only.
No. 29 = Gaia DR3 3488721051716722048. This is one more candidate with vtan_g≈800 km s−1 , but with a smaller RPlx≈4.3 corresponding to our low-priority class. The relatively small proper motion of Gaia DR3 3488721051716722048 was known before Gaia, for instance from Zacharias et al. (2013). Except for its N per=18, which is slightly below the global median of 17th magnitude stars, this candidate passed all other local and global parameter tests. The parallax in DR3 (0.316±0.076 mas) decreased by 16% compared to DR2 (0.375±0.114 mas), where its priority would be lower.
No. 32 = Gaia DR3 1451652599056932480. Another HVS candidate with high priority in DR3 (RPlx≈5.6) is Gaia DR3 1451652599056932480, for which a similar proper motion as measured by Gaia was already provided by Monet et al. (2003). For this 17th magnitude star, Nper=19 is smaller than the median in the local comparison, while all other tests did not hint at any problems. Compared to DR2, the parallax and proper motion components are similar, but the DR3 parallax (0.453±0.080 mas) has no higher precision than the DR2 one (0.494±0.083 mas) so that RPlx decreased from DR2 to DR3. This is unusual (!) and may indicate binarity. The vtan_g of this and the remaining candidates in the shortlist is already less extreme (<750 km s−1).
No. 67= Gaia DR3 6884930019709368576. Our faintest (G≈ 18.8 mag) high-priority (RPlx≈5.8) candidate is the HPM star Gaia DR3 6884930019709368576. Although not included in classical HPM catalogues, its HPM was known before Gaia (Monet et al. 2003). Here, Nper=17 falls below the median in the global comparison. Both locally and globally it has upto 20% larger e_pmDE compared to q75 values. In our close NN search (Sect. 3.1.2), an equally faint (G≈ 18.7 mag) object was found at a separation of ≈3 arcsec, which was considered as non-critical. With a parallactic distance of ≈860 pc, similar to that of D6-2, this is the second candidate in our shortlist that is located within 1 kpc. The parallax in DR3 (1.164±0.200 mas) became larger and more significant than in DR2 (1.086±0.280 mas), where this object would be assigned low priority only.
No. 52 = Gaia DR3 4715594303954641920. This candidate (not well measured in Monet et al. 2003) appears similar to D6-3 in several aspects. In particular, one can see this with respect to its low priority (RPlx≈4.5) but excellent local and global test results (except for IPDgo fha, which is just a few percent above the local q75 value). It is also similarly faint (G≈17.9 mag) and was even more frequently observed (N per=29). However, with its colour of G–RP=0.69 mag it does not fall in the CMD region of the D6 objects, and the galactocentric tangential velocity of Gaia DR3 4715594303954641920 is with ≈730 km s−1 only moderately extreme. Its DR3 parallax (0.394±0.088 mas) is 11% smaller than in DR2 (0.442±0.115 mas). In a DR2 HVS selection it would have lower priority.
No. 10 = Gaia DR3 4294774301679435776. The second brightest (G≈ 16.0 mag) of our 11 candidates, Gaia DR3 4294774301679435776, is of high priority (RPlx≈7.0). But in the local comparison, epsi and sepsi turned out to lie 15% and 50%, respectively above the corresponding q75 level. We note that this object is located right in the Galactic plane (GLAT≈−7°), what is causing great concern. Two objects within 5 arcsec found in Sect. 3.1.2 also indicated image crowding but were (with their magnitudes G>17mag) not considered as critical close NNs to Gaia DR3 4294774301679435776. Rather different proper motions were measured before Gaia by Monet et al. (2003) and Zacharias et al. (2013), respectively. Its parallax in DR3 (0.308±0.044 mas) became enormous 29% (!) larger than measured in DR2 (0.239±0.055 mas), where it would have been selected with low priority only.
No. 42 = Gaia DR3 6620452702488805504. The last object in our shortlist is the low-priority (RPlx≈4.3) candidate Gaia DR3 6620452702488805504, for which Monet et al. (2003) already found a proper motion almost equal to that in DR3. Similar to another low-priority candidate (Gaia DR3 3488721051716722048) in the shortlist, it passed all parameter tests, except for the global comparison of N per, where it shows a deficit of observations. The DR3 parallax (0.403±0.093 mas) is 14% larger than the very uncertain value measured in DR2 (0.355±0.162 mas), where it would not have been selected even with low priority.
4 Summary and conclusions
This study draws attention to the still uncertain Gaia parallaxes of HVS candidates selected by high tangential velocities. First, a lower limit of 500 km s−1 was used for computed galactocentric tangential velocities (Sect. 2.1), and candidates with parallactic distances <10 kpc and moderate HPMs >20 mas yr−1 were selected. A similar number of about 1500 high-priority HVS candidates (RPlx>5) were found in Gaia DR2 (Sect. 2.2; Figs. 1–4) and in DR3 (Sect. 2.3; Figs. 5–8), but these two samples of candidates had less than 25% in common, and the overlap was even smaller for higher velocities.
It was shown that in high stellar density regions in the GC and Galactic plane spurious HPMs can lead to false HVS candidates (Fig. 9). This effect, which is stronger for small N per, has been reduced from DR2 to DR3. Interestingly, in a recent comparison of proper motions in crowded fields, Luna et al. (2023) found that DR3 proper motion uncertainties are underestimated by up to a factor of 4 in dense Galactic bulge fields. Their study was also motivated by the search for HVSs among outliers in the proper motion distribution. One recommendation is to considerably increase the lower limits of N per used for all objects in DR2 (6) and DR3 (10; see Figs. 2 and 6) with any astrometric selection of HVS candidates, in particular in crowded regions.
In general, the HPMs of DR3-selected HVS candidates are in good agreement with previous DR2 data and are highly significant. Therefore, their formal tangential velocity errors (Fig. 14) are dominated by the parallax errors. The high-priority HVS candidates (RPlx>5) selected in DR2 showed a trend towards larger parallaxes measured in DR3 (Figs. 10 and 12). Consequently, their tangential velocities became lower (Fig. 11) and absolute magnitudes fainter. We speculate that this trend will continue for DR3-selected high-priority HVS candidates in DR4.
The HVS selection in DR3 was extended to low-priority (3<RPlx<5) candidates. There are selection effects of the parallaxes and proper motions (Fig. 13). Both become larger at the faint end. This effect begins for high-priority HVS candidates already at brighter magnitudes than for low-priority candidates.
With DR3, the RVs of bright stars, including one-third of our DR3 high-priority HVS candidates, but only a few low-priority ones, became available. For high- and low-priority candidates, the mean RV errors are 20 and 30 times smaller than the mean heliocentric tangential velocity errors. All RVs are within ±450 km s−1, which is lower than the used lower limit for vtan_g (Fig. 15). For >70% of all candidates, the precise RVs are more than five times lower than the uncertain heliocentric tangential velocities (Fig. 16). This leads to the conclusion that the DR3 HVS sample is strongly affected by underestimated parallaxes.
In the second part of this study, the 72 nearest (parallactic distance <4 kpc) and most extreme (vtan_g>700 km s−1) HVS candidates in DR3 were studied in detail. In the CMD (cf. Figs. 17 and 18), these 11 high-priority and 61 low-priority candidates mainly occupy the MS, with many objects scattered towards redder G-RP colours. A small group of four candidates is located between the MS and the WD regions. As expected, no blue massive HVS candidates were found within our relatively small distance limit. The majority of apparently too red candidates have close NNs, found in our own search in DR3 (Sect. 3.1.2; Fig. 19), or DR3 flags and IPD parameters hinting at binarity. The ten most important astrometric quality parameters of each target were compared with those of all objects of similar magnitude locally and HPM stars of equal magnitude globally. Median N per and 0.75 quantiles of nine other parameters were determined for the comparison objects and used as lower and upper critical limits, respectively. This is illustrated in Figs. 20–25. The most decisive parameters for which candidates failed the tests were RUWE, gofAL, sepsi, and epsi in the local comparison and Nper, RUWE, and gofAL in the global comparison (Table 1). Combining all test results, and using RPlx as the most important criterion, none of the nearest extreme HVS candidates was fully convincing.
Local and global parameter tests complemented each other. An interesting case was found with D6-1 (Shen et al. 2018), where our global comparison went without any problems, probably because of a very high gΔ=+9, indicating many observing epochs for this object and this sky region. In the local comparison three parameters failed the test (which means D6-1 appears in comparison to other objects with many epochs not so well measured). Deviations become visible the more often an object is observed. Therefore, an alternative global test could involve comparison objects not only of equal magnitude, but also of equal Nper.
Eleven candidates were selected with relaxed criteria. To include the best of the low-priority candidates, a minimum of RPlx>4 was used. The best of the high-priority candidates were selected by allowing Nper values ≧−2 compared to the local and global median and by increasing the allowed upper limits of nine other astrometric parameters to 60% above the 0.75 quantiles of comparison objects The relaxed candidates are discussed individually in Sect. 3.6 with respect to their problematic parameters, previous proper motion measurements (generally in agreement with DR3), partly low Galactic latitudes causing concern, previous DR2 parallaxes, external RVs mostly not supporting their HVS status, and other references.
The shortlist of 11 relaxed candidates, sorted by decreasing vtan_g, is led by three D6 objects, the low-priority candidate D6-3, and the two high-priority candidates D6-1 and D6-2 (all from Shen et al. 2018), followed by the bright high-priority candidate Gaia DR2 3841458366321558656 (from Scholz 2018). Another DR2 candidate in the latter research note, Gaia DR2 6097052289696317952 labelled in most figures, and object D located next to the D6 objects in Figs. 8, 17, and 18 (see also Sects. 2.3 and 2.6) failed in many of the parameter tests. All test results are tabulated so that an alternative selection of best candidates can be independently decided on.
Acknowledgements
This work analyses results from the European Space Agency (ESA) space mission Gaia. Gaia data are being processed by the Gaia Data Processing and Analysis Consortium (DPAC). Funding for the DPAC is provided by national institutions, in particular the institutions participating in the Gaia MultiLateral Agreement (MLA). The Gaia mission website is www.cosmos.esa.int/gaia. The Gaia archive website is https://archives.esac.esa.int/gaia. I have extensively used SIMBAD and VizieR at the CDS/Strasbourg and would like to thank the CDS staff for their valuable work. I also thank the anonymous referee for a helpful report.
Appendix A Data of 72 HVS candidates
Basic DR3 data of the 72 nearest extreme HVS candidates with high (RPlx>5) and low (3<RPlx<5) priority, sorted by G magnitude
DR3 next neighbours, IPD parameters, flags, and results from local±global parameter comparison of the 72 HVS candidates
References
- Abadi, M. G., Navarro, J. F., & Steinmetz, M. 2009, ApJ, 691, L63 [Google Scholar]
- Bhat, A., Irrgang, A., & Heber, U. 2022, A&A, 663, A39 [NASA ADS] [CrossRef] [EDP Sciences] [Google Scholar]
- Bonanos, A. Z., Lopez-Morales, M., Hunter, I., & Ryans, R. S. I. 2008, ApJ, 675, L77 [NASA ADS] [CrossRef] [Google Scholar]
- Boubert, D., Guillochon, J., Hawkins, K., et al. 2018, MNRAS, 479, 2789 [Google Scholar]
- Bromley, B. C., Kenyon, S. J., Brown, W. R., & Geller, M. J. 2018, ApJ, 868, 25 [CrossRef] [Google Scholar]
- Brown, W. R. 2015, ARA&A, 53, 15 [Google Scholar]
- Brown, W. R., Geller, M. J., Kenyon, S. J., & Kurtz, M. J. 2005, ApJ, 622, L33 [Google Scholar]
- Brown, W. R., Geller, M. J., Kenyon, S. J., & Kurtz, M. J. 2006, ApJ, 640, L35 [NASA ADS] [CrossRef] [Google Scholar]
- Brown, W. R., Geller, M. J., & Kenyon, S. J. 2009, ApJ, 690, 1639 [NASA ADS] [CrossRef] [Google Scholar]
- Brown, W. R., Anderson, J., Gnedin, O. Y., et al. 2010, ApJ, 719, L23 [NASA ADS] [CrossRef] [Google Scholar]
- Brown, W. R., Geller, M. J., & Kenyon, S. J. 2012, ApJ, 751, 55 [NASA ADS] [CrossRef] [Google Scholar]
- Brown, W. R., Geller, M. J., & Kenyon, S. J. 2014, ApJ, 787, 89 [Google Scholar]
- Caldwell, J. A. R., & Ostriker, J. P. 1981, ApJ, 251, 61 [NASA ADS] [CrossRef] [Google Scholar]
- Chandra, V., Hwang, H.-C., Zakamska, N. L., et al. 2022, MNRAS, 512, 6122 [CrossRef] [Google Scholar]
- Chatterjee, S., Vlemmings, W. H. T., Brisken, W. F., et al. 2005, ApJ, 630, L61 [NASA ADS] [CrossRef] [Google Scholar]
- Culpan, R., Pelisoli, I., & Geier, S. 2021, A&A, 654, A107 [NASA ADS] [CrossRef] [EDP Sciences] [Google Scholar]
- Culpan, R., Geier, S., Reindl, N., et al. 2022, A&A, 662, A40 [NASA ADS] [CrossRef] [EDP Sciences] [Google Scholar]
- de Bruijne, J. H. J., Allen, M., Azaz, S., et al. 2015, A&A, 576, A74 [NASA ADS] [CrossRef] [EDP Sciences] [Google Scholar]
- Drake, A. J., Djorgovski, S. G., Catelan, M., et al. 2017, MNRAS, 469, 3688 [NASA ADS] [CrossRef] [Google Scholar]
- Du, C., Li, H., Yan, Y., et al. 2019, ApJS, 244, 4 [Google Scholar]
- Edelmann, H., Napiwotzki, R., Heber, U., Christlieb, N., & Reimers, D. 2005, ApJ, 634, L181 [Google Scholar]
- El-Badry, K., Shen, K. J., Chandra, V., et al. 2023, Open J. Astrophys., 6, 28 [CrossRef] [Google Scholar]
- Evans, F. A., Rasskazov, A., Remmelzwaal, A., et al. 2023, MNRAS, 525, 561 [NASA ADS] [CrossRef] [Google Scholar]
- Gaia Collaboration (Brown, A. G. A., et al.) 2018, A&A, 616, A1 [NASA ADS] [CrossRef] [EDP Sciences] [Google Scholar]
- Gaia Collaboration (Smart, R. L., et al.) 2021, A&A, 649, A6 [EDP Sciences] [Google Scholar]
- Gaia Collaboration (Vallenari, A., et al.) 2023, A&A, 674, A1 [NASA ADS] [CrossRef] [EDP Sciences] [Google Scholar]
- Geier, S., Raddi, R., Gentile Fusillo, N. P., & Marsh, T. R. 2019, A&A, 621, A38 [NASA ADS] [CrossRef] [EDP Sciences] [Google Scholar]
- Gentile Fusillo, N. P., Tremblay, P.-E., Gänsicke, B. T., et al. 2019, MNRAS, 482, 4570 [Google Scholar]
- Green, R. F., Schmidt, M., & Liebert, J. 1986, ApJS, 61, 305 [NASA ADS] [CrossRef] [Google Scholar]
- Gualandris, A., & Portegies Zwart, S. 2007, MNRAS, 376, L29 [NASA ADS] [CrossRef] [Google Scholar]
- Gvaramadze, V. V., Gualandris, A., & Portegies Zwart, S. 2008, MNRAS, 385, 929 [NASA ADS] [CrossRef] [Google Scholar]
- Hattori, K., Valluri, M., Bell, E. F., & Roederer, I. U. 2018, ApJ, 866, 121 [CrossRef] [Google Scholar]
- Heber, U., Edelmann, H., Napiwotzki, R., Altmann, M., & Scholz, R. D. 2008, A&A, 483, L21 [NASA ADS] [CrossRef] [EDP Sciences] [Google Scholar]
- Hills, J. G. 1988, Nature, 331, 687 [Google Scholar]
- Hirsch, H. A., Heber, U., O’Toole, S. J., & Bresolin, F. 2005, A&A, 444, L61 [NASA ADS] [CrossRef] [EDP Sciences] [Google Scholar]
- Holl, B., Fabricius, C., Portell, J., et al. 2023, A&A, 674, A25 [NASA ADS] [CrossRef] [EDP Sciences] [Google Scholar]
- Hollands, M. A., Tremblay, P. E., Gänsicke, B. T., Gentile-Fusillo, N. P., & Toonen, S. 2018, MNRAS, 480, 3942 [NASA ADS] [CrossRef] [Google Scholar]
- Igoshev, A. P., Perets, H., & Hallakoun, N. 2023, MNRAS, 518, 6223 [Google Scholar]
- Jayasinghe, T., Kochanek, C. S., Stanek, K. Z., et al. 2018, MNRAS, 477, 3145 [Google Scholar]
- Kenyon, S. J., Bromley, B. C., Geller, M. J., & Brown, W. R. 2008, ApJ, 680, 312 [NASA ADS] [CrossRef] [Google Scholar]
- Kenyon, S. J., Bromley, B. C., Brown, W. R., & Geller, M. J. 2014, ApJ, 793, 122 [Google Scholar]
- Kepler, S. O., Pelisoli, I., Koester, D., et al. 2015, MNRAS, 446, 4078 [Google Scholar]
- Kollmeier, J. A., & Gould, A. 2007, ApJ, 664, 343 [NASA ADS] [CrossRef] [Google Scholar]
- Koposov, S. E., Boubert, D., Li, T. S., et al. 2020, MNRAS, 491, 2465 [Google Scholar]
- Lépine, S., & Shara, M. M. 2005, AJ, 129, 1483 [Google Scholar]
- Li, H., Tan, K., & Zhao, G. 2018, ApJS, 238, 16 [CrossRef] [Google Scholar]
- Li, Y., Luo, A., Zhao, G., et al. 2012, ApJ, 744, L24 [NASA ADS] [CrossRef] [Google Scholar]
- Li, Q.-Z., Huang, Y., Dong, X.-B., et al. 2023, AJ, 166, 12 [NASA ADS] [CrossRef] [Google Scholar]
- Liao, J., Du, C., Li, H., Ma, J., & Shi, J. 2023, ApJ, 944, L39 [NASA ADS] [CrossRef] [Google Scholar]
- Lindegren, L., Hernandez, J., Bombrun, A., et al. 2018, A&A, 616, A2 [NASA ADS] [CrossRef] [EDP Sciences] [Google Scholar]
- Lindegren, L., Klioner, S. A., Hernandez, J., et al. 2021, A&A, 649, A2 [NASA ADS] [CrossRef] [EDP Sciences] [Google Scholar]
- Lucey, M., Al Kharusi, N., Hawkins, K., et al. 2023, MNRAS, 523, 4049 [NASA ADS] [CrossRef] [Google Scholar]
- Luna, A., Marchetti, T., Rejkuba, M., & Minniti, D. 2023, A&A, 677, A185 [NASA ADS] [CrossRef] [EDP Sciences] [Google Scholar]
- Luyten, W. J. 1995, VizieR Online Data Catalog: I/98A [Google Scholar]
- Marchetti, T., Rossi, E. M., & Brown, A. G. A. 2019, MNRAS, 490, 157 [Google Scholar]
- Marchetti, T., Evans, F. A., & Rossi, E. M. 2022, MNRAS, 515, 767 [CrossRef] [Google Scholar]
- Monari, G., Famaey, B., Carrillo, I., et al. 2018, A&A, 616, L9 [NASA ADS] [CrossRef] [EDP Sciences] [Google Scholar]
- Monet, D. G., Levine, S. E., Canzian, B., et al. 2003, AJ, 125, 984 [Google Scholar]
- Neunteufel, P., Kruckow, M., Geier, S., & Hamers, A. S. 2021, A&A, 646, L8 [NASA ADS] [CrossRef] [EDP Sciences] [Google Scholar]
- Palladino, L. E., Schlesinger, K. J., Holley-Bockelmann, K., et al. 2014, ApJ, 780, 7 [Google Scholar]
- Przybilla, N., Fernanda Nieva, M., Heber, U., & Butler, K. 2008a, ApJ, 684, L103 [Google Scholar]
- Przybilla, N., Nieva, M. F., Heber, U., et al. 2008b, A&A, 480, L37 [NASA ADS] [CrossRef] [EDP Sciences] [Google Scholar]
- Quispe-Huaynasi, F., Roig, F., McDonald, D. J., et al. 2022, AJ, 164, 187 [NASA ADS] [CrossRef] [Google Scholar]
- Raddi, R., Hollands, M. A., Gänsicke, B. T., et al. 2018, MNRAS, 479, L96 [NASA ADS] [CrossRef] [Google Scholar]
- Raddi, R., Hollands, M. A., Koester, D., et al. 2019, MNRAS, 489, 1489 [Google Scholar]
- Scholz, R.-D. 2018, RNAAS, 2, 211 [NASA ADS] [Google Scholar]
- Schönnen, R., McMillan, P., & Eyer, L. 2019, MNRAS, 487, 3568 [CrossRef] [Google Scholar]
- Shen, K. J., Boubert, D., Gänsicke, B. T., et al. 2018, ApJ, 865, 15 [Google Scholar]
- Steinmetz, M., Guiglion, G., McMillan, P. J., et al. 2020, AJ, 160, 83 [NASA ADS] [CrossRef] [Google Scholar]
- Tauris, T. M. 2015, MNRAS, 448, L6 [Google Scholar]
- Tillich, A., Przybilla, N., Scholz, R. D., & Heber, U. 2009, A&A, 507, L37 [NASA ADS] [CrossRef] [EDP Sciences] [Google Scholar]
- Tillich, A., Heber, U., Geier, S., et al. 2011, A&A, 527, A137 [NASA ADS] [CrossRef] [EDP Sciences] [Google Scholar]
- Vennes, S., Nemeth, P., Kawka, A., et al. 2017, Science, 357, 680 [Google Scholar]
- Yu, Q., & Tremaine, S. 2003, ApJ, 599, 1129 [Google Scholar]
- Zacharias, N., Finch, C. T., Girard, T. M., et al. 2013, AJ, 145, 44 [Google Scholar]
- Zacharias, N., Finch, C., Subasavage, J., et al. 2015, AJ, 150, 101 [Google Scholar]
- Ziegerer, E., Volkert, M., Heber, U., et al. 2015, A&A, 576, L14 [NASA ADS] [CrossRef] [EDP Sciences] [Google Scholar]
- Zinn, J. C., Pinsonneault, M. H., Huber, D., & Stello, D. 2019, ApJ, 878, 136 [Google Scholar]
All Tables
Basic DR3 data of the 72 nearest extreme HVS candidates with high (RPlx>5) and low (3<RPlx<5) priority, sorted by G magnitude
DR3 next neighbours, IPD parameters, flags, and results from local±global parameter comparison of the 72 HVS candidates
All Figures
|
Fig. 1 Proper motions of HVS candidates selected from Gaia DR2 with PM>20 mas yr−1 Plx>0.1 mas, available BP, RP photometry, and vtan_g>500 km s−1. All 1520 high-priority candidates with Plx/e_Plx>5 are shown. The red symbols are objects with unconfirmed (crosses) or not measured (plus signs) proper motions in DR3. The magenta circle and symbols indicate the minimum HPM of 60 mas yr−1 and the six extreme (vtan_g>700 km s−1) nearby HVS candidates selected with additional DR2 quality criteria by Scholz (2018), respectively. The three labelled objects have still vtan_g>700 km s−1 when DR3 is used. |
| In the text | |
|
Fig. 2 Gaia DR2 G magnitudes and numbers of visibility periods Ν per of 1520 high-priority HVS candidates selected from DR2. The overplotted coloured symbols and labelled objects are as in Fig. 1. The black histogram illustrates the magnitude distribution. |
| In the text | |
|
Fig. 3 Gaia DR2 colour-magnitude diagram of 1520 high-priority DR2 HVS candidates. The region occupied by nearby WDs (Hollands et al. 2018) is bounded by dashed lines. The over-plotted coloured symbols and labelled objects are as in Fig. 1. For other labelled stars see text. |
| In the text | |
|
Fig. 4 Galactocentric tangential velocities vtan_g and total proper motions PM of 1520 high-priority Gaia DR2 HVS candidates. The overplotted coloured symbols and labelled objects are as in Fig. 1. The magenta dashed lines show the search limits of Scholz (2018). |
| In the text | |
|
Fig. 5 Proper motions of Gaia DR3 high-priority (blue plus signs) and low-priority (green crosses) HVS candidates. |
| In the text | |
|
Fig. 6 Gaia DR3 G magnitudes and numbers of visibility periods Ν per of 1619 high-priority (blue plus signs) and 4228 low-priority (green crosses) HVS candidates selected from DR3 (Sect. 2.3). The blue and green histograms illustrate their corresponding magnitude distributions. |
| In the text | |
|
Fig. 7 Galactocentric tangential velocities and total proper motions of high-priority (blue plus signs) and low-priority (green crosses) DR3 HVS candidates. For the tangential velocity errors, see Fig. 14. The overplotted magenta open circles and magenta labelled objects are as in Figs. 1–4. The magenta dashed lines show the search limits of Scholz (2018). Also labelled are two other D6 objects (Shen et al. 2018). |
| In the text | |
|
Fig. 8 Gaia DR3 colour-magnitude diagram of high-priority (blue plus signs) and low-priority (green crosses) DR3 HVS candidates. The blue and green histograms on the right illustrate the respective absolute magnitude distributions. The region occupied by nearby WDs (Hollands et al. 2018) is bounded by dashed lines, that of hot D6 stars (El-Badry et al. 2023) by cyan dotted lines. The cyan lozenges show S5-HVS1 (Koposov et al. 2020), not included in this study, with its predicted and measured absolute magnitudes (see text). The magenta symbols and labelled objects are as in Figs. 1–4. Two more D6 stars from Shen et al. (2018), D6-1 and D6-3, and six other relatively blue stars (A–F) are also labelled. The vtan_g of the latter six stars are listed in the inset (see also text). |
| In the text | |
|
Fig. 9 Proper motions of all faint (G > 18 mag) HPM objects (PM > 60 mas yr−1) in Gaia DR2 (upper row) and DR3 (lower row) in three selected 20°×20° fields in the Galactic plane: at the Galactic anticentre (left column), at the Galactic centre (middle), and at GLON=60° (right). The numbers of measured HPM stars in each field are given in round brackets. A few extreme HPM objects (in the upper middle panel more than 700) fall outside the frame. |
| In the text | |
|
Fig. 10 Comparison of measured Gaia DR2 and DR3 parallaxes of high-priority HVS candidates selected from DR2. Out of 1520 candidates 21 are not shown because of lacking DR3 parallaxes. The overplotted coloured symbols and labelled objects are as in Figs. 1–4. The green line indicates equality. |
| In the text | |
|
Fig. 11 Comparison of computed galactocentric tangential velocities based on Gaia DR2 and DR3 data for high-priority HVS candidates selected from DR2. The overplotted coloured symbols and labelled objects are as in Figs. 1–4. The magenta dashed line marks the velocity limit set by Scholz (2018). The green line indicates equality. The ratios RPlx=Plx/e_Plx are compared in the inset, where the green line again indicates equality, and the yellow line a 2:1 relation. |
| In the text | |
|
Fig. 12 Parallax differences dPlx (DR3-DR2) vs. DR3 G magnitudes for 1495 high-priority DR2 HVS candidates with confirmed proper motions in DR3. The red line indicates their median parallax difference, the green line equal parallaxes. The inset shows mean parallax differences and standard deviations in 0.5 mag bins. |
| In the text | |
|
Fig. 13 Parallaxes (top) and total proper motions (bottom) of DR3 HVS candidates of high priority (blue plus signs) and low priority (green crosses) as a function of G magnitude. |
| In the text | |
|
Fig. 14 Tangential velocity errors e_vtan of high-priority (blue plus signs) and low-priority (green crosses) DR3 HVS candidates as a function of G magnitude. For the overplotted open circles and labelled objects, compare with Fig. 8 and see text. |
| In the text | |
|
Fig. 15 Computed DR3 vtan_g vs. measured DR3 RVs of high-priority (blue filled squares) and low-priority (green dots) DR3 HVS candidates. Two objects with the highest vtan_g are labelled (see text). The mean RVs and standard deviations in the velocity intervals 500<vtan_g<700 (km s−1) and vtan_g>700 km s−1 are listed on the right. |
| In the text | |
|
Fig. 16 Heliocentric tangential velocity vtan vs. RV of high-priority (blue filled squares) and low-priority (green dots) DR3 HVS candidates. Their mean error bars are shown at the top left. The red dashed line indicates a vtan |
| In the text | |
|
Fig. 17 Gaia DR3 colour-magnitude diagram of extreme (vtan_g>700 km s−1) HVS candidates of high priority (blue filled squares) and low priority (green dots). The 80 objects with available DR3 RVs are overplotted by open triangles, the 72 nearest candidates (Plx>0.25 mas) by open hexagons. For labelled objects and the WD region (dashed lines), compare with Figs. 3 and 8 and see text. |
| In the text | |
|
Fig. 18 Zoomed-in image of the CMD of the 72 nearest extreme DR3 HVS candidates of high priority (blue filled squares) and low priority (green dots). Only objects with overplotted open symbols passed the local (lozenges) and global (hexagons) checks of astrometric parameters (see Sects. 3.3 and 3.4). One object lacking G-RP colour is shown on the right. The overplotted crosses are objects with a close next neighbour (NN) in DR3, arrows with different directions indicate conspicuous DR3 flags and parameters (see Sect. 3.1). In addition to objects already labelled in Fig. 17, all other high-priority candidates are also labelled (see text). The upper boarder of the nearby WD region is indicated by the dashed line. |
| In the text | |
|
Fig. 19 Results of next neighbour (NN) search around 72 nearest extreme HVS candidates of high priority (blue filled squares) and low priority (green dots). Neighbours separated by less than 5 arcsec were found for only 16 objects. Plotted over their G magnitudes are the total number of objects within 5 arcsec (top), the magnitude of the NN (middle), and the distance to the NN (bottom). The overplotted crosses are the 11 objects with a close NN expected to have affected the astrometry. One candidate without a NN but with a DR3 Dup flag is shown for comparison (red arrow down). |
| In the text | |
|
Fig. 20 DR3 e_Plx of 72 nearest extreme HVS candidates (high priority = blue filled hexagons; low priority = green dots) as a function of G magnitude. The thin black and thick red horizontal bars show q75 values of local and global comparison objects, respectively. |
| In the text | |
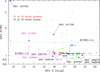 |
Fig. 21 Same as Fig. 20, but for RUWE. |
| In the text | |
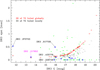 |
Fig. 22 Same as Fig. 20, but for epsi. Objects with epsi=0 mas are not labelled. |
| In the text | |
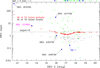 |
Fig. 23 Same as Fig. 20, but for sepsi. Objects with epsi=0 mas are not labelled. |
| In the text | |
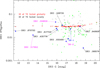 |
Fig. 24 Same as Fig. 20, but for IPDgofha. |
| In the text | |
|
Fig. 25 DR3 N per of 72 nearest extreme HVS candidates (high priority, blue filled hexagons; low priority, green dots) as a function of G magnitude. The thin black and thick red horizontal bars show median values of our local and global comparison objects, respectively. The yellow solid and dashed lines show mean N per of all DR3 five- and six-parameter solutions (Lindegren et al. 2021, their Tables 4 and 5) for comparison. |
| In the text | |
Current usage metrics show cumulative count of Article Views (full-text article views including HTML views, PDF and ePub downloads, according to the available data) and Abstracts Views on Vision4Press platform.
Data correspond to usage on the plateform after 2015. The current usage metrics is available 48-96 hours after online publication and is updated daily on week days.
Initial download of the metrics may take a while.