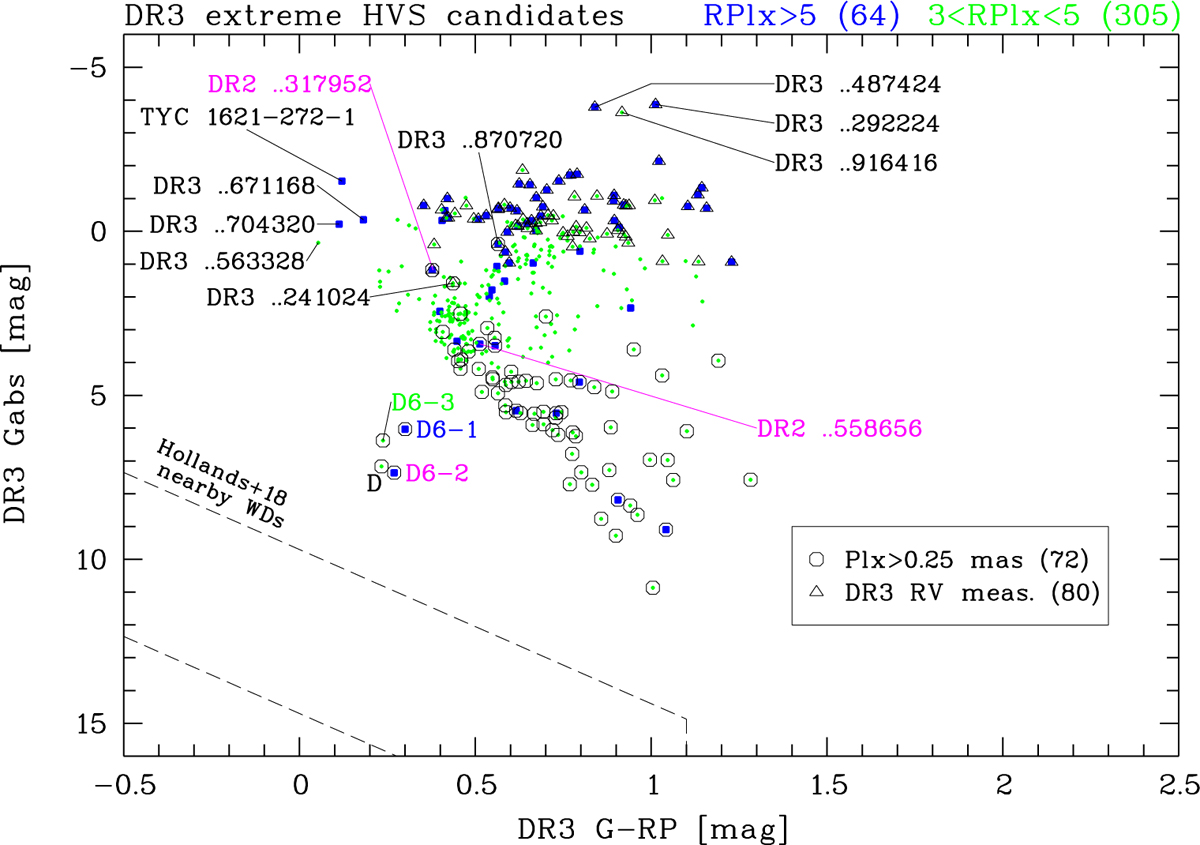
Fig. 17
Download original image
Gaia DR3 colour-magnitude diagram of extreme (vtan_g>700 km s−1) HVS candidates of high priority (blue filled squares) and low priority (green dots). The 80 objects with available DR3 RVs are overplotted by open triangles, the 72 nearest candidates (Plx>0.25 mas) by open hexagons. For labelled objects and the WD region (dashed lines), compare with Figs. 3 and 8 and see text.
Current usage metrics show cumulative count of Article Views (full-text article views including HTML views, PDF and ePub downloads, according to the available data) and Abstracts Views on Vision4Press platform.
Data correspond to usage on the plateform after 2015. The current usage metrics is available 48-96 hours after online publication and is updated daily on week days.
Initial download of the metrics may take a while.