Open Access
Fig. 20
Download original image
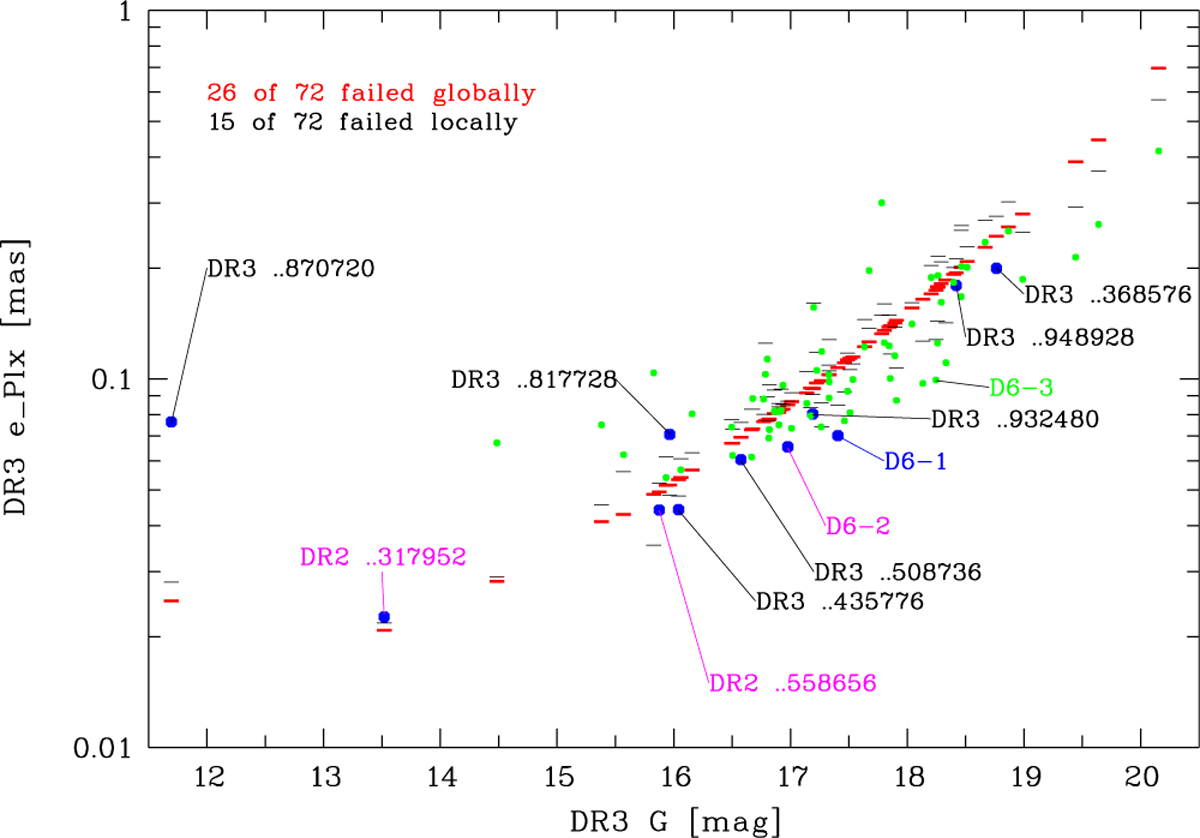
DR3 e_Plx of 72 nearest extreme HVS candidates (high priority = blue filled hexagons; low priority = green dots) as a function of G magnitude. The thin black and thick red horizontal bars show q75 values of local and global comparison objects, respectively.
Current usage metrics show cumulative count of Article Views (full-text article views including HTML views, PDF and ePub downloads, according to the available data) and Abstracts Views on Vision4Press platform.
Data correspond to usage on the plateform after 2015. The current usage metrics is available 48-96 hours after online publication and is updated daily on week days.
Initial download of the metrics may take a while.