Fig. 11
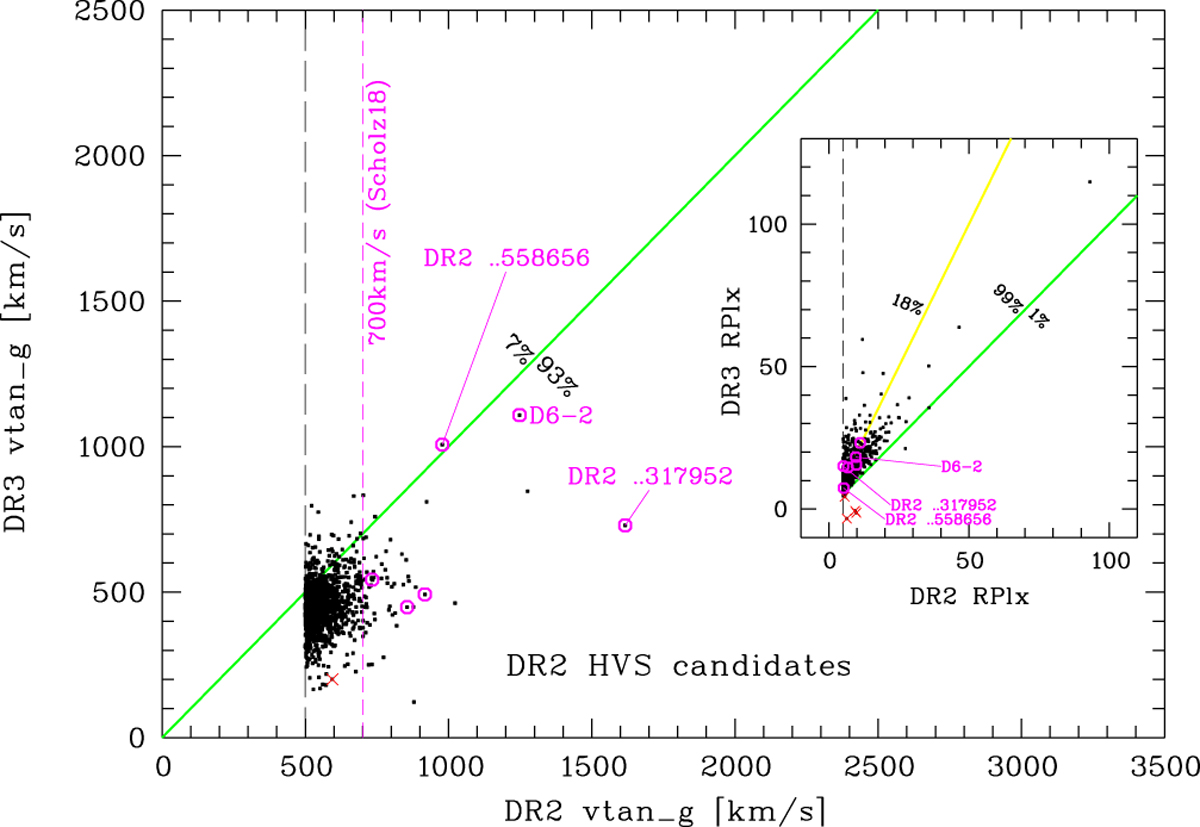
Download original image
Comparison of computed galactocentric tangential velocities based on Gaia DR2 and DR3 data for high-priority HVS candidates selected from DR2. The overplotted coloured symbols and labelled objects are as in Figs. 1–4. The magenta dashed line marks the velocity limit set by Scholz (2018). The green line indicates equality. The ratios RPlx=Plx/e_Plx are compared in the inset, where the green line again indicates equality, and the yellow line a 2:1 relation.
Current usage metrics show cumulative count of Article Views (full-text article views including HTML views, PDF and ePub downloads, according to the available data) and Abstracts Views on Vision4Press platform.
Data correspond to usage on the plateform after 2015. The current usage metrics is available 48-96 hours after online publication and is updated daily on week days.
Initial download of the metrics may take a while.