Open Access
Fig. 6
Download original image
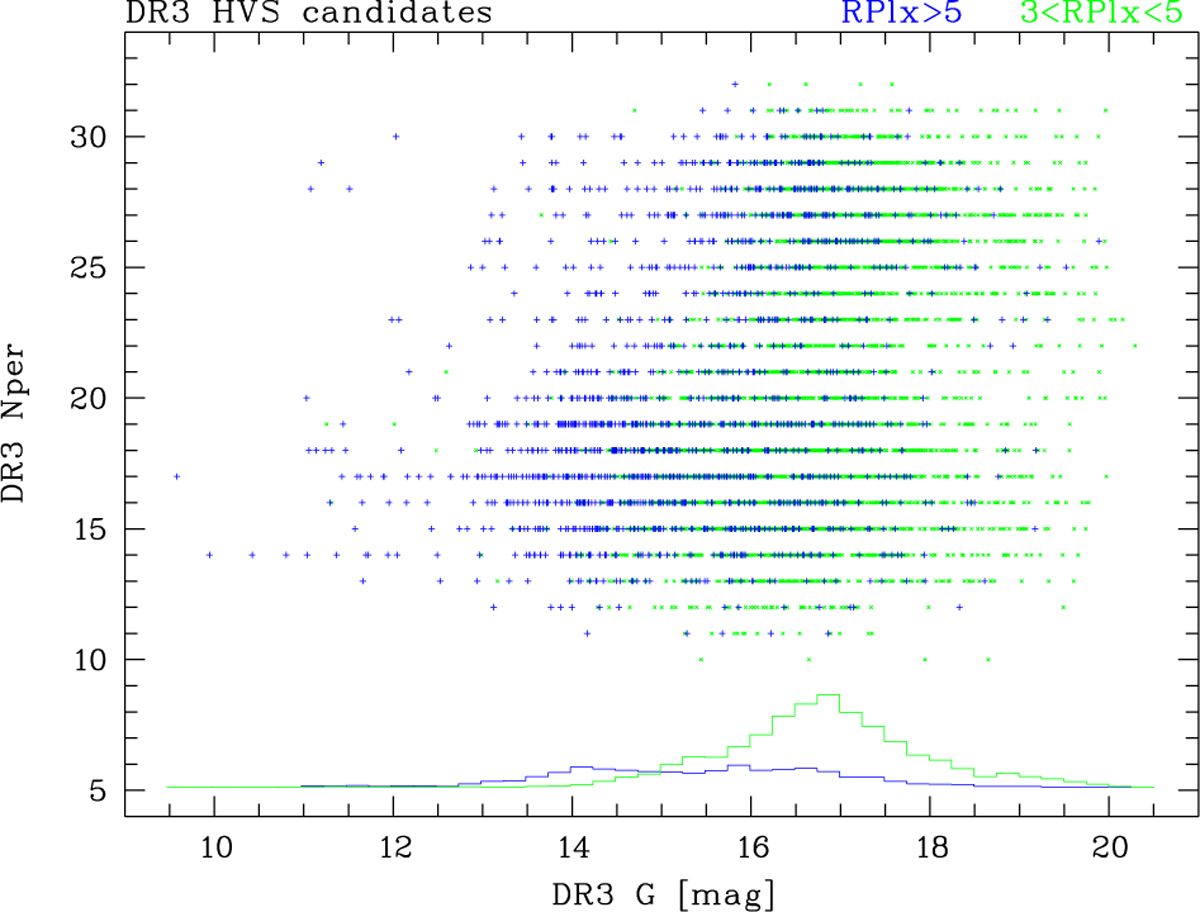
Gaia DR3 G magnitudes and numbers of visibility periods Ν per of 1619 high-priority (blue plus signs) and 4228 low-priority (green crosses) HVS candidates selected from DR3 (Sect. 2.3). The blue and green histograms illustrate their corresponding magnitude distributions.
Current usage metrics show cumulative count of Article Views (full-text article views including HTML views, PDF and ePub downloads, according to the available data) and Abstracts Views on Vision4Press platform.
Data correspond to usage on the plateform after 2015. The current usage metrics is available 48-96 hours after online publication and is updated daily on week days.
Initial download of the metrics may take a while.