Open Access
Fig. 15
Download original image
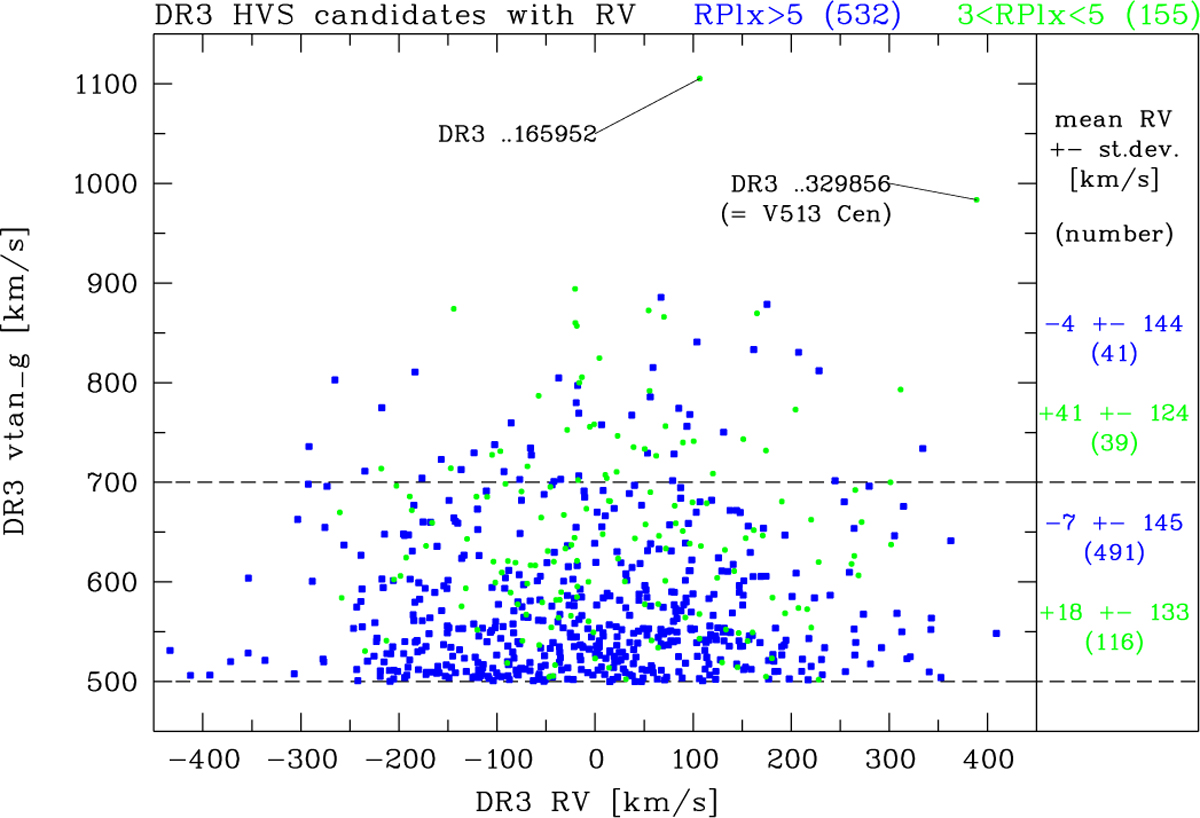
Computed DR3 vtan_g vs. measured DR3 RVs of high-priority (blue filled squares) and low-priority (green dots) DR3 HVS candidates. Two objects with the highest vtan_g are labelled (see text). The mean RVs and standard deviations in the velocity intervals 500<vtan_g<700 (km s−1) and vtan_g>700 km s−1 are listed on the right.
Current usage metrics show cumulative count of Article Views (full-text article views including HTML views, PDF and ePub downloads, according to the available data) and Abstracts Views on Vision4Press platform.
Data correspond to usage on the plateform after 2015. The current usage metrics is available 48-96 hours after online publication and is updated daily on week days.
Initial download of the metrics may take a while.