Fig. 8
Download original image
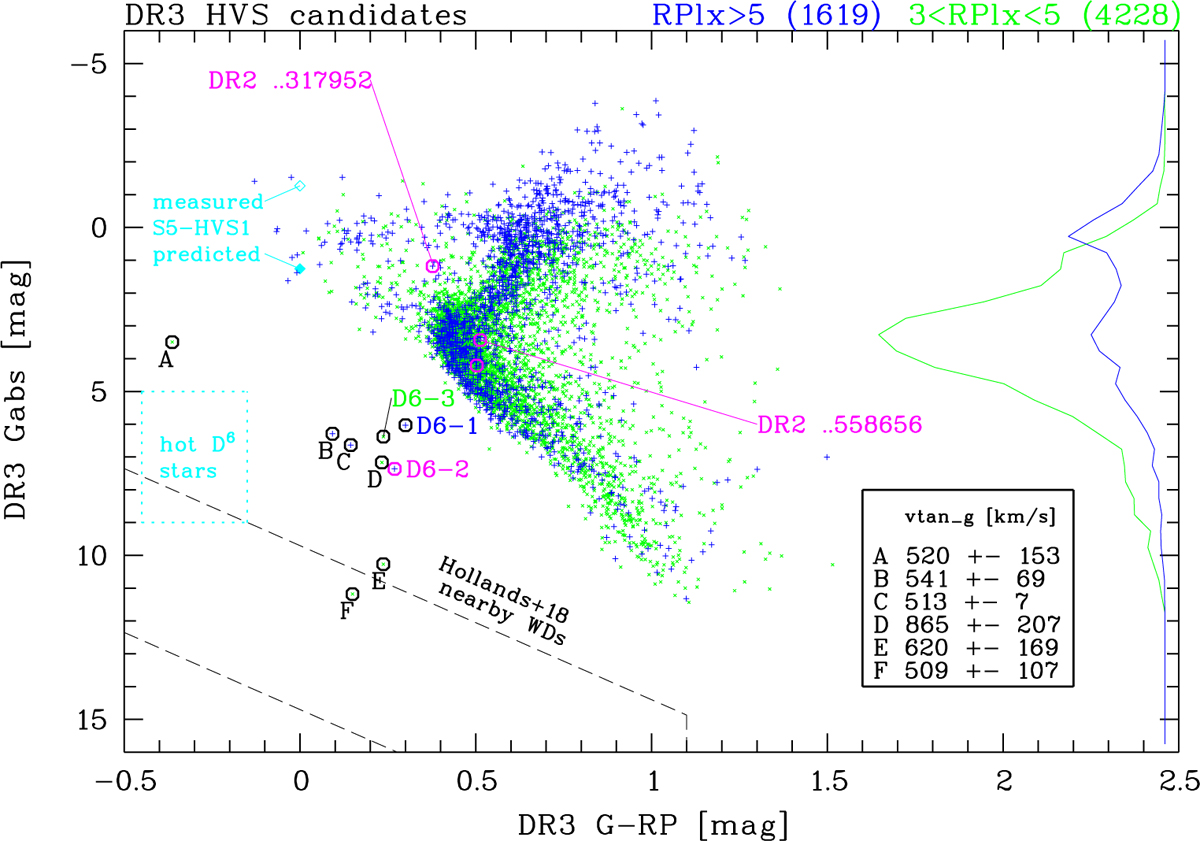
Gaia DR3 colour-magnitude diagram of high-priority (blue plus signs) and low-priority (green crosses) DR3 HVS candidates. The blue and green histograms on the right illustrate the respective absolute magnitude distributions. The region occupied by nearby WDs (Hollands et al. 2018) is bounded by dashed lines, that of hot D6 stars (El-Badry et al. 2023) by cyan dotted lines. The cyan lozenges show S5-HVS1 (Koposov et al. 2020), not included in this study, with its predicted and measured absolute magnitudes (see text). The magenta symbols and labelled objects are as in Figs. 1–4. Two more D6 stars from Shen et al. (2018), D6-1 and D6-3, and six other relatively blue stars (A–F) are also labelled. The vtan_g of the latter six stars are listed in the inset (see also text).
Current usage metrics show cumulative count of Article Views (full-text article views including HTML views, PDF and ePub downloads, according to the available data) and Abstracts Views on Vision4Press platform.
Data correspond to usage on the plateform after 2015. The current usage metrics is available 48-96 hours after online publication and is updated daily on week days.
Initial download of the metrics may take a while.