| Issue |
A&A
Volume 684, April 2024
|
|
|---|---|---|
| Article Number | A202 | |
| Number of page(s) | 12 | |
| Section | Extragalactic astronomy | |
| DOI | https://doi.org/10.1051/0004-6361/202347210 | |
| Published online | 25 April 2024 | |
Identification of the optical emission detected by Gaia with radio structures in parsec-scale active galactic nucleus jets⋆
1
SYRTE, Observatoire de Paris – Université PSL, CNRS, Sorbonne Université, LNE, Paris, France
e-mail: This email address is being protected from spambots. You need JavaScript enabled to view it.
2
LUTH, Observatoire de Paris – Université PSL, CNRS, Université Paris-Cité, Paris, France
3
Université Paris-Cité, Institut de Physique du Globe de Paris (IPGP), Paris, France
Received:
16
June
2023
Accepted:
9
February
2024
Abstract
Aims. We investigated the location of the optical emission with respect to the parsec-scale radio structure and attempted to identify whether the optical centroid is coincident with the radio core or a radio component of the jet.
Methods. We used optical Gaia DR3 and 8 GHz ICRF3 positions and a model fitting of 15 GHz imaging by the MOJAVE VLBA survey for 422 sources, mostly blazars. We searched for possible associations between optical centroids and radio components. We also compared the astrometric and photometric properties of each category, looked for trends between the various source parameters, and discussed possible biases.
Results. Sources can be separated into four categories based on whether their optical centroid (i) falls onto the radio core (category C), (ii) lies close to the base of the jet (category B), (iii) coincides with a radio component downstream in the jet (category J), or (iv) is not found to coincide with a detected radio component (category O). Due to a number of random and systematic errors, the number of sources falling into each category remains approximate but close to 32%, 36%, 22%, and 10%, respectively. The family of quasars, mostly flat spectrum radio quasars (FSRQs), clearly dominates the C and B categories, with their percentage decreasing from categories C to O. Conversely, the family of BL Lacs is spread over the four classes and dominates the category O. Radio galaxies are mainly in classes O and J, and the radio-loud narrow-line Seyfert 1 all belong to class C. An individual analysis of O sources shows that, despite the absence of a direct association with a specific radio component, the optical Gaia centroid is globally related to the radio VLBI jet structure.
Conclusions. Our study shows that the spatial distribution of the optical counterparts seen by Gaia below the 0.2-arcsec scale around the radio cores appears in the vast majority of cases to be related to the AGN core or to its jet, with most of them located downstream in the jet. Those associated to the core also exhibit a bluer color index, suggesting a possible contribution of the accretion disk to the optical emission, while those associated to a radio knot in the jet appear redder and tend on average to be found in more polarized radio sources. Most BL Lacs have their optical emission coincident with the jet base or a knot in the jet, while sources with an optical emission on or close to the radio core are mostly FSRQs. Radio components associated with the optical centroid at the jet base or along the jet are mainly stationary or quasi-stationary features, with low apparent MOJAVE velocities. There are indications that the apparent proper motion of the Gaia centroids may be higher than the speed of the associated radio components, but the significance of this trend requires further investigation.
Key words: techniques: interferometric / astrometry / reference systems / quasars: general
The CSV table is available at the CDS via anonymous ftp to cdsarc.cds.unistra.fr (130.79.128.5) or via https://cdsarc.cds.unistra.fr/viz-bin/cat/J/A+A/684/A202
© The Authors 2024
 Open Access article, published by EDP Sciences, under the terms of the Creative Commons Attribution License (https://creativecommons.org/licenses/by/4.0), which permits unrestricted use, distribution, and reproduction in any medium, provided the original work is properly cited.
This article is published in open access under the Subscribe to Open model. This email address is being protected from spambots. You need JavaScript enabled to view it. to support open access publication.
1. Introduction
The European Space Agency (ESA) Gaia astrometry mission (Prusti et al. 2016; Brown et al. 2016, 2018, 2021; Vallenari et al. 2022) launched in 2013 and the constantly improving geodetic very-long-baseline radio interferometry (VLBI) program, led mainly by the International VLBI Service for geodesy and astrometry (IVS, Nothnagel et al. 2017), currently provide the best absolute astrometry of distant active galactic nuclei (AGN) with positional accuracies of better than 0.1 mas (e.g., Brown et al. 2021; Fabricius et al. 2021). These AGN belong to galaxies that host a supermassive central black hole surrounded by a bright optical/UV-emitting accretion disk or an under-luminous one – from which large jets of relativistic plasma sometimes emerge, as observed in particular in radio (e.g., Padovani et al. 2017; Blandford et al. 2019). Their distances (megaparsec to gigaparsec) and their compactness make them the ideal reference points for realizing the international celestial reference system (ICRS, Arias et al. 1995; Feissel & Mignard 1998).
The coexistence of radio and optical AGN catalogs with comparable accuracy raises several challenging questions in terms of reference frames and astrophysics. Immediately following the publication of the first two releases of Gaia, several independent studies revealed the existence of significant radio-optical angular separations – of up to several mas – not exclusively due to systematic errors (Mignard et al. 2016, 2018; Petrov & Kovalev 2017; Petrov et al. 2018). Identifying the mechanisms that lead to such offsets is crucial in order to better understand the trends of the AGN population and to improve the tie between radio and optical landmarks. The most recent radio realization of the international celestial reference frame (ICRF), the ICRF3 (Charlot et al. 2020), was released in 2018. This latter is based on about 40 years of VLBI observations and contains positions for more than 4500 sources at 8 GHz; for 800 of them, positions are available at 8, 22, and 32 GHz. The recent Gaia catalog (Data Release 3 or DR3, Vallenari et al. 2022) is based on 34 months of observations. About 3500 sources are in common with the ICRF3. Recent studies comparing absolute radio and optical astrometry, VLBI imaging, and photometric properties, allowed the first general picture to be drawn of the radio–optical system. The radio centroids at 8, 22, and 32 GHz are close to each other (< 0.1 mas) and are arranged in order of increasing frequency towards the base of the jet; that is, towards the central black hole, in coherence with a frequency-dependent model of the jet plasma opacity (Lambert et al. 2021). Optical centroids often appear to be located downstream in the jet and significantly distant from radio centroids, that is, by 0.1 to several mas (Kovalev et al. 2017; Plavin et al. 2019a; Xu et al. 2021; Lambert et al. 2021). There is evidence that these optical centroids could coincide with a radio component in the jet with a high degree of linear polarization in radio as well as in the optical range, testifying to a well-organized magnetic field typical of synchrotron emission (Xu et al. 2021; Lambert et al. 2021; Kovalev et al. 2020); conversely, when the Gaia centroid is upstream relative to the radio centroid, weaker polarization and a bluer color index suggest a dominant contribution of the accretion disk to the optical emission (Plavin et al. 2019a; Kovalev et al. 2020). Reaching an accurate alignment between the Gaia reference frame and the ICRF clearly needs reaching a sound understanding of the physical links between their radio and optical emission at the sub-millarcsecond scale.
In the present study, we test a more systematic method of identifying the optical centroid given by Gaia DR3 with 15 GHz radio features as identified by the latest model-fitting of the MOJAVE survey (Lister & Homan 2005; Lister et al. 2021) on the basis of fundamental astrometry as provided by the ICRF3 (Charlot et al. 2020). We compare the various properties in terms of position, proper motion, and photometry associated with the coincidences.
2. Data
Our radio catalog consists of the ICRF3 (Charlot et al. 2020) restricted to the 4536 entries at X-band (8.4 GHz). For the optical counterparts, we proceeded with a cross-matching of the full Gaia DR3 positions (Prusti et al. 2016; Brown et al. 2021) with the ICRF3 positions with a cross-identification radius of 1 arcsec. For all these positions, we adopt the errors given by the two catalogs, which presently represent the state of the art for astrometric data. This leads to 3519 sources.
From Gaia, we also collected values for the proper motion, the renormalized unit weight error (RUWE), and the BP-RP color index. BP-RP is the difference in magnitude between 330–660 nm (BP) and 630–1000 nm (RP) bands and can be used as an indicator of whether the disk or the jet dominates the optical emission, the latter producing a redder luminosity and the former leading to a bluer source (see, e.g., Plavin et al. 2019a).
Lister et al. (2021) used very long baseline array (VLBA) maps of 447 radio-loud AGN acquired by the MOJAVE survey at 15.4 GHz between 1994 and 2019. Of these sources, 422 are common to the above sample of common Gaia-ICRF3 sources and form our sample of objects referred to as GIM (Gaia-ICRF3-MOJAVE) in the following. Tracking the relative positions of bright, parsec-scale (i.e., mas-scale) features, these GIM data provide the time-dependent coordinates and fluxes of VLBI components relative to a putative core component (region close to the apparent base of the jet with an optical depth close to 1 at a given frequency) at several epochs. We used Table 4 of Lister et al. (2021) to measure a mean position of each component as the time-integrated flux-weighted average of the positions at all epochs. Uncertainties on position angles were computed as the time-integrated flux-weighted standard deviation of the positions. Optical spectroscopic classification of the objects was retrieved from their Table 1. In addition, we collected the proper motion vectors of each component (Table 5 of Lister et al. 2021, available for all of the GIM sources). The maximum of the total fractional polarization at 15 GHz was deduced from Table 2 of Lister et al. (2018; available for 379 sources), while the optical polarization is available for only 60 sources from Hutsemékers et al. (2018).
3. Identification of radio and optical centroids with radio features
We attempt to locate Gaia optical centroids with respect to MOJAVE radio components (radio core or knots in the jet), thereby characterizing the source based on its “radio-optical geometry”, which comprises the radio–optical vector and the radio structure. To achieve this, we compare the Gaia position relatively to the ICRF3 position with the positions of the MOJAVE components (that are relative to the putative MOJAVE core component, referred to as component 0 in the tables of Lister et al. 2021). The sketch in Fig. 1 represents the relative positions of the radio core, the optical (Gaia) and radio (VLBI) centroids, and a MOJAVE component. The relative distance and position-angle of Gaia to the radio core are referred to as dG and θG. The relative distance and position-angle of the MOJAVE components to the radio core are referred to as dM and θM. The associated proper motions are parameterized by the amplitude (apparent velocity) vG, M and the position-angle ϕG, M. The distance between the Gaia centroid and a MOJAVE component is denoted dGM. Finally, dCV is the distance between the MOJAVE radio core and the X-band centroid.
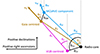 |
Fig. 1. Sketch of the geometry of the relative positions of the radio core, the Gaia optical centroid, and a MOJAVE component. |
A critical step in our identification of these centroids is to locate the geodetic VLBI reference point (ICRF3 position) with respect to the MOJAVE map. Indeed, what represents the X-band (8 GHz) reference point given by the ICRF3 is not obvious with respect to the brightness distribution provided by the 15 GHz MOJAVE maps. The radio core often appears as an obvious reference point for the radio source (Porcas 2009), which is well justified for sources widely dominated by their core. However, the MOJAVE map centroid could constitute a better reference point than the VLBI astrometry position especially for radio sources with a more complex structure, not fully dominated by their radio core; for example, for radio galaxies, such as M87, and compact steep spectrum (CSS) sources, such as 3C 119 (see Sect. 4.5). Nevertheless, there are several objections to such a simplified vision.
At an angular resolution of below 1 mas, radio sources are not point-like. Instead, they generally present an extended structure with a bright core and a relativistic jet, with each of these regions having a different spectral index. The X-band positions in ICRF3 are obtained from bi-frequency S/X (2 GHz/8 GHz) group delay measurements. The contribution from the dispersive ionosphere is deduced for 8 GHz and then applied to the X-band group delay. The X-band group delays are then globally inverted to deduce source and station coordinates along with Earth orientation parameters and other station-dependent parameters relevant to the troposphere and clocks. The global inversion is constrained by a no-net rotation to be aligned with the ICRS; in that sense, the positions can be referred to as absolute positions.
However, the position of the core is expected to be frequency-dependent (core-shift) due to the opacity with a dependence of the form ν−β, where β = 1 corresponds to the somewhat ideal scenario of the self-absorption of the synchrotron emission by a magnetized plasma in equipartition and for which the core-shift contribution in group delay vanishes (Porcas 2009). Also, β is expected to be relatively close to 1, as measured in several sources such as 3C 345 and 3C 454.3 (Lobanov 1998; Sokolovsky et al. 2011; Chamani et al. 2023), although this frequency dependence is disrupted as inferred from time-variability of core-shift during strong flares (Plavin et al. 2019b). Therefore, the position of the core measured at S-band and at X-band should differ by several tenths of a milliarcsecond (Kovalev et al. 2008; Plavin et al. 2019b, mas). However, the data used to build the ICRF3 catalog are dominated by X-band data, and so an error on the X-band position due to the S-X-band core-shift (that would shift the X-band position in the direction opposite to the jet if β differs from 1) is expected to be minimized, and is included in the ICRF3 error bars in any case (we note that the group delay uncertainty is that of the ionosphere-free linear combination of group delays at X- and S-band).
Furthermore, the presence of an extended structure creates an additional term in the group delay (structure delay; see, e.g., Charlot 1990) that produces a shift of the reference point in the direction of the jet with respect to its base. This term is not accounted for in the geodetic VLBI catalog positions; it can be “observed” as an apparent motion of the source position in coordinate time series obtained from session-wise analyses of geodetic VLBI sessions (e.g., Fey et al. 1997; MacMillan & Ma 2007; Gattano et al. 2018; Gattano & Charlot 2021). For the most spatially unstable sources, the displacement of the reference point generally reaches amplitudes of around 0.1 mas and rarely reaches values that exceed 1 mas (Feissel et al. 2000).
In contrast, MOJAVE map components are relative to the brightest feature or to a core component whose identification is based on a flat, inverted radio spectrum. The difference in frequency between MOJAVE (15 GHz) and the geodetic VLBI (8 GHz) induces a core-shift of the centroids along the jet direction (Martí-Vidal et al. 2008) that is of the order of 0.1–0.3 mas according to dedicated measurements and can be time-variable at the moment of strong nuclear flares (during which β differs from 1) within a similar range (Pushkarev et al. 2012; Plavin et al. 2019b).
In summary, the VLBI reference point given by the ICRF3 can differ from that deduced from a MOJAVE map by several tenths of a mas (the value is source-dependent) along the jet direction. In addition, the structure is variable with time, meaning that the geodetic VLBI positions and the MOJAVE maps are epoch-dependent. Although most of the ICRF3 sources have been chosen in such a way that they have small structures, MOJAVE sources do have extended structures, meaning that their geodetic VLBI reference points can be affected by the variability following the considered epoch (see discussion above and Feissel et al. 2000).
To overcome an inextricable problem of comparing absolute positions against relative maps, a compromise must be reached by adhering to an error budget. We suggest a conservative approach consisting of putting the geodetic VLBI reference point onto the centroid of the MOJAVE map given conservative positional errors sufficiently large to cover all the unaccounted-for random and systematic errors listed above. How these imperfect choices affect our conclusions is discussed below.
We made composite maps of intensity distribution by stacking all the components provided by Lister et al. (2021) convoluted by a Gaussian circular beam of 0.1 mas in radius. The MOJAVE centroid is computed with respect to the map coordinate system using the MOJAVE model-fitted components and their respective fluxes. The upper panel of Fig. 2 displays the distribution of the differences dCV in position between the MOJAVE core and the MOJAVE centroid averaged over all epochs. The bottom panel displays the distribution of the rms of dCV due to epoch-dependent structure, illustrating that the time-variable structure has an impact on the centroid position that is globally an order of magnitude smaller than the distance to the core. In addition, dCV remains mostly relatively small as the GIM sample is dominated by core–jet radio sources, and so the choice of the VLBI reference point should not drastically affect the main conclusions of the present study; we indeed verified this a posteriori. Though the ICRF3 and Gaia errors are precisely provided in the catalogs, the MOJAVE components can be affected by a conservative positional isotropic error of 0.2 mas. We also note that the ICRF3 errors are not the native standard errors – which are generally underestimated – resulting from the least-squares inversion of delays but are conservative errors inflated by a factor of 1.5 with an addition noise floor of 0.03 mas (Charlot et al. 2020).
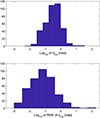 |
Fig. 2. (Top) Distribution of dCV and (Bottom) of its rms of computed over the existing epochs for each source. |
We associate the optical centroid with a MOJAVE component if their normalized separation is less than a certain threshold X0. In the case of optical centroids associated with radio components with no intrinsic offsets – that is, just random errors –, the normalized separation would follow a Rayleigh distribution of parameter equal to unity. We search X0 for which the expected number of sources with X > X0 is less than 1 in a sample of 422 sources, that is X0 = 3.5.
Doing so, we can split the sources into four categories whose typical configurations are represented in Fig. 3:
-
The first category contains sources for which the optical centroid can be associated with the MOJAVE putative core component (component 0). These sources form the Core category, denoted category C hereafter. There could be other MOJAVE components at normalized separations of less than the threshold X0 but, if so, they are more distant than the core component.
-
A second category contains sources whose radio component closest to the Gaia centroid is a radio knot in the jet but for which the normalized separation between the optical centroid and the radio core is still less than X0. These sources form the Base (of the jet) category, or category B.
-
Sources for which the optical centroid is closer than X0 in normalized separation to a MOJAVE jet component and is significantly distinct from the core form the Jet category, or category J.
-
Finally, sources for which no identification is found with structures seen by MOJAVE are placed in the “Other” category, or category O.
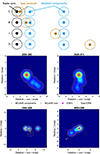 |
Fig. 3. Configurations corresponding to the four categories of radio/optical identification as defined in this study. In the top panel, the dotted-circles represent the contour of 99% confidence around the optical centroid or the radio core and knots. |
Examples of sources placed in the four categories are given in the lower panels of Fig. 3. The full set of images is made available electronically1. The error ellipses in the maps represent three times (99% CI) the error ellipse deduced from uncertainties in right ascension and declination and their correlations as reported in the ICRF3 and Gaia catalogs.
From the difference |θG − θM|, we deduce whether or not the optical centroid is within the jet (upstream if |θG − θM|< 45° and downstream if it is in the range 180° ±45°). A Table available online provides the geometrical parameters, the source category, and the identifier of the MOJAVE component. The number of sources falling in each category and subcategory (downstream, upstream, elsewhere) is shown in Table 1. As various random and systematic errors cannot be taken into account rigorously, the columns of this table are expected to have some porosity; this is discussed below.
Number of sources falling in each category: C for Core, B for Base (of the jet), J for Jet, and O for Other, and subcategory (downstream, upstream, or elsewhere), and their median separation.
Categories C and B are not unambiguously distinct. In both categories, the optical centroid can be close enough to several components in the base of the jet regarding the positional errors. More generally, the various errors evoked above contribute to a certain permeability between the four categories. The porosity of the boundaries of the four categories under the position errors can be tested by adding systematic and random errors to the VLBI reference point position with respect to the MOJAVE component. Such tests are illustrated in Fig. 4. In the upper plot, we simulate a possible systematic error by moving the position of the VLBI reference point and Gaia centroid along the jet (systematic error) by between 0.2 and 0.6 mas for all sources. The number of sources in categories C and J is not significantly affected. However, as the systematic shift grows, sources of B category switch to category O, as the Gaia centroid loses the association with the MOJAVE component to which it was identified in the case of no systematic error. In the middle plot, we applied a translation of the VLBI reference point and Gaia centroid by a random value (0.2–0.6 mas) in a random direction (averaged over 1000 runs), making it diffciult to match any optical centroid with a MOJAVE component and depopulating categories C and B. Though most of the sources are then placed in category O, the population of category J also grows because of the random direction of the translation. Finally, we also tested the effect of inflating the VLBI and Gaia positional uncertainties by growing them uniformly by between 0.2 and 0.6 mas, which increases the number of matches between the optical centroids and the central MOJAVE components, as expected, and therefore increases the populations in categories C and B. These tests provide indications as to the uncertainty on the number of sources in each category, with some sources being at the boundary between two categories and falling on one side or the other depending on the fixed criteria. However, it is clear that introducing systematic or random changes of the MOJAVE centroids results mainly in a strong depletion of the intermediate category B, and for the largest changes in a significant increase in the population of category O, where radio–optical associations are lost. Conversely, inflating the uncertainties on the radio and Gaia positions significantly increases the population of the intermediate category B as expected, and prevents sources from being clearly separated into categories C and J. In all cases, changing the MOJAVE positions or inflating errors, does not modify the main conclusion of the existence of four categories of sources C, B, J, and O. Finally, large changes to or large errors on positions simply result in a loss of information and of credible radio–optical associations, with almost all sources being placed in category B when assuming very large errors on the positions. This analysis of error effects therefore justifies a posteriori the values we adopted for the errors in the present study and the choice of the MOJAVE centroids as putative VLBI reference points.
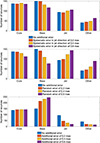 |
Fig. 4. Number of sources in each category for various additional errors. Upper plot: Systematic change in position of the MOJAVE centroid by 0.2–0.6 mas along the jet for all sources. Middle plot: Random translation of the MOJAVE centroid by 0.2–0.6 mas in a random direction. Lower plot: Effect of inflating the VLBI and Gaia positional uncertainties by 0.2–0.6 mas. |
4. Trends and properties
The distribution of the various properties in the categories that we collected are represented with box plots in Fig. 5, where the box is limited to the first and third quartiles and includes the median value, and the extreme horizontal bars indicate the 5th and 95th percentiles. There is no boxplot concerning the proper motion of the radio core as it is assumed to be zero. For the category O, as there is no identification, the boxplot relevant to radio properties should be empty. Nevertheless, the pink boxplot is made up of the radio properties of the MOJAVE component, which is the closest to the optical centroid.
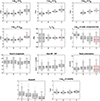 |
Fig. 5. Boxplots of various astrometric and photometric quantities following the source category. The boxplots in pink are related to optical centroids not identified with radio components: in such cases, the boxplot reports the radio properties of the MOJAVE component closest to the optical centroid. The thick horizontal line in the whisker represents the median value. The box limits are the first and third quartiles, and the extreme horizontal bars indicate the 5th and 95th percentiles. |
4.1. Comparative properties of the four source categories
The panels of Fig. 5 relevant to dV, dG, dM, dGM, and θG − θM reveal that the location of the VLBI and Gaia centroids is mostly similar for C and B sources, and to some extent for J sources, suggesting comparable radio and optical structures on average and some common primary origin. The Gaia centroids of B and J sources are clearly located at small angles from the jet direction, which is consistent with their association with phenomena occurring along the radio jet. The situation appears quite different for C sources, whose Gaia centroids are distributed over all angles with respect to the jet direction. This would be expected for instance if their Gaia centroids were, on average, dominated by optical emission from nonaxisymmetric active zones in the AGN disks. However, the measurement of angles in these C sources is marred by large error bars, and simple statistical effects may also be responsible for the observed scatter. This potentially interesting trend requires further investigation. Category O contains optical sources relatively far from the core but mostly at small angles from the jet direction, suggesting that the Gaia centroid may coincide with a radio component whose flux is too weak to be detected or model-fitted by MOJAVE. These sources are therefore susceptible to reclassification into category J if a new VLBI component is identified, which is sometimes the case (see Sect. 4.5). For 7 of the 45 category O sources, the optical and VLBI centroids are not significantly different, suggesting an optical structure (distribution and flux) comparable to the structure at 8 GHz. Category O could also include sources for which the optical centroid is influenced by a halo or results from the contribution of two or more optical components along the jet whose optical flux is averaged in a single position. We note that Gaia determines the optical centroid of a region of several hundred squared mas, which is much larger than the area integrated by the VLBI to form the structure and the VLBI reference point. In addition, the non-simultaneity of Gaia positions (2016.0) and MOJAVE maps (produced in some cases several years earlier or later) could also contribute to the absence of identifications as both radio and optical components can move along the jet by several mas over a few years. Finally, some cases of fortuitous nonphysical associations of a Gaia source with an AGN from the ICRF3 cannot be excluded either. Some sources of category O are further discussed individually in Sect. 4.5.
As confirmed in Fig. 5, the radio flux of the core component for the C sources is expectedly significantly stronger than that of the radio knots caught in the case of B, J, and O sources. However, there is no striking difference in Gaia magnitude between the four categories. This apparent paradox should be considered in light of the two following factors. First, radio fluxes are only those of the MOJAVE component associated to the optical centroid, and originate from nonthermal synchrotron radiation. Also, as expected, the radio flux of the core component is on average higher than the radio flux of other jet components in a sample dominated by blazars. In contrast, the optical magnitudes are those of the whole source, possibly including contributions from accretion disks and from several knots in the jet. Although one expects some correspondence between radio and optical nonthermal fluxes of a given knot, there is no reason to suggest that the correspondence will still hold when considering the entire Gaia catalog. Second, the Gaia limit magnitude is 21 regardless of the category, and the GIM sample is only composed of sources that are sufficiently optically bright to be detected. Such a selection effect can influence the statistical distribution of the optical fluxes and mask differences between the four categories. The magnitude selection, carried out over the sum of thermal (disk) and nonthermal (jet) optical fluxes, could also lead to a loss of sources (in categories J and O) for which the optical flux is dominated by the nonthermal emission only. For categories C and B, the optical flux can be reinforced by the disk so that its lower magnitude allows the source to be detected by Gaia. However, it is interesting to note that the lowest mean optical magnitudes of the sample are finally reached by J sources, which shows that some knots in jets can be significantly brighter than accretion disks and the bases of jets in the optical range.
The sources of categories B, J, and O exhibit a redder color index than those of category C, which is consistent with a possible contribution of the disk to the optical emission in the case of the C sources (Plavin et al. 2019a), but is in contrast to a dominantly nonthermal (synchrotron) emission for the other categories. Figure 5 shows the maximum of total fractional linear polarization in per cent observed by MOJAVE at 15 GHz over several epochs. The percentage of polarization is found to be slightly higher on average for J sources, followed by B sources, C sources, and O sources. Considering that the relative number of BL Lacs compared to flat spectrum radio quasars (FSRQs) is significantly lower in categories C and B than in categories J and O (see Sect. 4.4), this effect appears consistent with recent observations by Pushkarev et al. (2023), who show that BL Lacs are more polarized than FSRQs up to 100 pc in deprojected scale, and go down to polarizations similar to that of FRSQs at larger scales. The mean total polarization of O sources can also be reduced by the presence of several radiogalaxies in this class, which are usually less polarized than blazars. The higher total polarization in J sources can be expected from their bright optically thin synchrotron emission in somewhat organized jet magnetic field (e.g., Ginzburg 1979) which partially supports the findings of earlier studies (Lister & Homan 2005; Kovalev et al. 2020; Xu et al. 2021).
Finally, the median redshift is higher for short separations between the radio core and the optical centroid, suggesting that these short angular separations are favored on average for more distant sources, which is coherent with the fact that high-redshift sources globally appear more compact. We also note that, on average, sources of category O have significantly smaller redshifts than the other categories. This is to be expected from various effects such as a stronger influence of brighter optical halos or host galaxies on the location of the optical centroid for low-redshift sources. Another effect, discussed in Sect. 4.5 for the case of M87, can be due to the non-strict simultaneity of the radio and optical data, which can induce a significant temporal shift between the location of the optical and radio structures in the case of low-redshift superluminal jets.
4.2. Astrometric stability
We examined the astrometric stability of 394 sources of our sample for which we were able to obtain positional time series from the global geodetic VLBI monitoring program. These coordinate time series were computed at the Paris Observatory IVS analysis center as explained in Charlot et al. (2020). To limit the presence of outlier positions that commonly arise, for example, from sessions of weak network or other problems, we remove data whose normalized distance to the median coordinate of the detrended series is larger than 5. The positional stability of a series is then expressed using Formula (4) of Fey et al. (2015). The corresponding boxplots are reported in the last panel of Fig. 5. We observe slightly better stability for the C and B categories. Among our sample, 95 sources are ICRF3-defining sources, of which 35 (36%) fall into category C, 40 (42%) into category B, 13 (14%) into category J, and 7 (7%) into category O. Merging categories C and B, 76% of the present defining sources have an optical centroid that can be considered to be confounded with the radio core within the positional uncertainty.
4.3. Proper motions
Figure 6 shows the statistics of proper motions relevant to vG and vM as well as differences between Gaia proper motion and the apparent speed of the corresponding MOJAVE component, both in terms of amplitude vG − vM and direction ϕG − ϕM and normalized by the accumulated uncertainties. Before commenting further, we highlight the fact that only 17% of our sources have a significant optical proper-motion amplitude on the basis of Gaia DR3 measurements. The difference with MOJAVE speeds is significant in amplitude for 8% of the sources, and in direction for 11% of the sources.
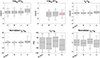 |
Fig. 6. Statistics of Gaia and MOJAVE apparent proper motion amplitude and of the differences between Gaia proper motions and the MOJAVE measurements of the apparent motion of the VLBI component (amplitude and position angle). In the middle plot of the upper row, the boxplot in pink reports the radio properties of the MOJAVE component closest to the optical centroid. The MOJAVE proper motion of sources of category C being null, these sources are not considered in the MOJAVE-related plots. In the difference plots, “All BJO” reports the statistics of the overall B, J, and O sources. |
The median velocity of the radio component is larger for category J sources, which is consistent with the presence of a relativistic jet ejected from a presumably supermassive black hole at rest at the gravitational center of the host galaxy. However, the apparent velocities in radio usually remain low (median 0.08 mas yr−1), characterizing stationary or almost stationary components rather than fast components moving at several mas yr−1, favoring association of the optical emission with stationary features in the jets such as reconfinement shocks. Conversely, the optical proper motions measured by Gaia appear globally larger than the MOJAVE ones by a factor of 2. Furthermore, this factor is much larger for O sources, which is not easy to interpret. This phenomenon may suggest some acceleration of the optical centroids along the jets, on average. However, as illustrated in Sect. 4.5, this effect can be at least partially explained by the nonsimultaneity of the radio maps and of the Gaia data, which induces larger apparent shifts between the observed radio and optical components for the sources with the fastest optical proper motions, which then tend to belong to category O. The same effect might also appear – albeit in the opposite direction – for the proper motions in radio, which seem to be slower for O sources on average (see Figure 6); this tends to increase the difference in speed between the radio and optical components, and favors observation of high radio–optical separations.
If we were to trust the current different values retained for radio and optical proper motions, we could interpret them as signatures of perturbations propagating along the jet often more rapidly in the optical than in the radio range; when crossing stationary radio structures (such as reconfinement shocks), these would emit stronger in the optical range and would be detected at higher velocity by Gaia. Another explanation could be that the position and apparent motion of the optical centroids are determined by the flux variation of several bright components, which would mean the rapid displacement of the optical centroid is due solely to flux variations and not to physical component displacement. Such dramatic positional changes are commonly seen in radio (Titov et al. 2022) and could even show a faster variability in the optical range where particles emitting high energies have a shorter synchrotron lifetime.
However, no strong significant correlations or trends between radio and optical proper motions emerge from the present sample, which is likely due to the astrometric uncertainties on Gaia data, especially in crowded fields. The assumption of zero motion for all radio cores could also be questionable. Finally, we believe it would be inappropriate to draw firm conclusions before more accurate optical proper motions are delivered by Gaia, with precisions possibly comparable to those derived from MOJAVE. The refinement of optical proper motions in the future releases of Gaia will therefore be crucial to pursuing this particular area of study. We note that Souchay et al. (2022) also recently pointed out the existence of still unexplained high optical proper motions in some Gaia extragalactic objects, demanding more research.
4.4. Distribution of AGN types in the four categories
Our sample is widely dominated by blazars but also includes some radio galaxies. Figure 7 displays the number of AGN of various types in each of the four categories, C, B, J, and O, according to the AGN classification by MOJAVE. The class of quasars, which includes mostly FSRQs and a few rare (≤3) compact steep spectrum (CSS) quasars, dominates the three populations C, B, and J, and is more present in proportion among the C and B sources (∼70–75%) than among the J sources (∼60%), while quasars form only about 30% of category O, which appears dominated by BL Lacs. The largest numbers of BL Lacs belong first to category J, and second to category B. We note that, here again, the over-representation of FSRQs versus other AGN types (especially BL Lac) can be partly due to magnitude selection, as FSRQ optical fluxes cumulate both thermal and nonthermal emissions and are, as expected, of lower magnitude, and are therefore more susceptible to being captured by Gaia.
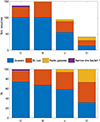 |
Fig. 7. Number and proportion of AGN spectral types in each category. |
The class of narrow-line Seyfert 1 (NLS1), which challenges the standard unified AGN model, is represented here by only five radio-loud NLS1s, all of which are gamma-ray sources detected by Fermi/LAT and belonging to category C. Such sources are known to show a broadband spectral energy distribution (SED) with two bumps – with the high-energy bump typically due to inverse-Compton scattering of background photons external to the jet – and are quite similar to the FSRQs in this regard (Paliya et al. 2018, 2019). Their presence in category C, already dominated by FSRQs, further strengthens the interpretation that category C mainly includes sources with luminous accretion disks.
Conversely, the 21 radio galaxies (RGs) of our sample mainly belong to the categories O (11 RGs) and J (7 RGs). Together with the increasing percentage of BL Lacs from category C to categories B, J, and O, this tendency is consistent with the idea that the Gaia centroids are mostly associated to AGN jet features for sources with weak accretion disks. Indeed, a visual inspection of all sources of category O revealed that even in this peculiar category, the Gaia centroid mainly lies either inside the radio jet or close to it, or in continuity to the radio structure as illustrated in Figs. 3 and 8. Finally, there are fewer than ten objects in category O where this is not the case, with some of them possibly being explained by the interaction of the jet with the ambient gas or by additional optical nuclear structures, as in a few CSS sources and Seyfert radio galaxies, as further discussed in the following section.
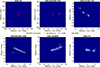 |
Fig. 8. Maps reconstructed from MOJAVE model-fitting of Lister et al. (2021) with X-band (violet star) and optical (yellow disk) centroids and the MOJAVE components (blue) for particular sources (see text) and their 99% confidence ellipses. These sources are all classified in category O and are presented in order of increasing radio–optical shift. For the last two, the shift between the MOJAVE components and the Gaia centroid is so high that their VLBI radio jet cannot be seen at this scale. |
4.5. The specific case of sources of category O with large radio–optical separation
Category O includes the fewest sources of the four categories but nonetheless merits particular attention. It gathers AGN that are on average at lower redshifts, with some well-known objects that have benefited from in-depth studies in the literature such as AP Lib, NGC 6251, 3C 264, 3C 345, Mrk 501, M87, and NGC 315. FSRQs are very much under-represented in this category, which is the only one dominated by BL Lacs, and hosts the largest number of radio galaxies of the GIM sample. Some of the O sources show various peculiarities, such as complex optical structures or high optical proper motion, which can result in high radio–optical shift as illustrated here. The composite maps of intensity distribution we made are shown in Fig. 8 for six sources representative of various cases found in category O, either because of a particularly large and significant radio–optical distance or large optical proper motion not associated with a correspondingly large MOJAVE proper motion. All six are relatively close sources, with redshifts of lower than 0.1.
The two sources 1638+118 (TXS 1638+118) and 1228+126 have optical proper motions of 2.1 and 7.4 mas yr−1, respectively, and have large RUWE with respective values of 2.3 and 2.9. 1638+118 (z = 0.078) is a low-spectral-peak radio galaxy detected by Fermi/LAT, with a flat radio spectrum and a radio core unresolved at the kiloparsec scale. Its Gaia centroid is located in continuity with the jet structure, on the edge of a bright knot. At the parsec-scale, MOJAVE maps between 2013 and 2019 show only three moving features with subluminal motion and a maximum speed of 0.044 mas yr−1 (Lister et al. 2019), well below the measured Gaia proper motion, which suggests that the optical centroid brings to light a physical phenomenon different from the quasi-stationary features detected by MOJAVE. However, a bright galactic halo extends over several arcseconds in the optical range. The large RUWE indicates the potential contamination of the astrometric solution by several optical sources and therefore a risk of having an unreliable proper motion.
1228+126 at z = 0.0046 is the well-known radio galaxy Messier 87 with a strong optical and X-ray jet extending over several arcseconds and showing a complex velocity field with both subluminal and superluminal radio, optical, and X-ray structures along the jet, and also transverse to the jet (Biretta et al. 1999; Snios et al. 2019; Park et al. 2019). The optical Gaia centroid appears shifted at 18.2 mas westward of the radio core, which is consistent with the direction of both the radio and optical jets. The reconstructed map shown in Fig.5 is based on MOJAVE data at 15.4 GHz between 1995 and 2015 with a mean epoch of 2004.6, and bears strong similarities with the radio maps obtained at 22 GHz in 2016 by Park et al. (2019). The overall long-term radio structure therefore appears dominated by quasi-stationary bright features on the scale of 10 mas. However, Park et al. (2019) report detailed identifications of several radio knots and apparent motions measured in 2016, while Gaia was operational. Around the location of the Gaia centroid, between 18 and 20 mas from the core, apparent motions are found to vary from 3.8 to 10 mas yr−1 along the jet. The significant proper motion of 7.4 mas yr−1 measured by Gaia is therefore consistent with previously reported values, while its transverse component could presumably be due to some helical motion in the jet, averaged over the Gaia operational time. This suggests that the Gaia centroid is physically associated with one superluminal feature (from a group of such features) in the radio jet.
Indeed the first radio map by Park et al. (2019; epoch 2016.15) was obtained 0.18 years after the average epoch of Gaia DR3 data collection. Assuming that the Gaia centroid moved according to the Gaia proper motion along the jet direction, it should have moved typically 1.33 mas, and be located at a distance of about 18.2 + 1.33 = 19.53 mas from the core on the 22 GHz map provided by Park et al. (2019), which is close to the radial distance of the quasi-stationary KP7 radio feature (see their Figs. 2 and 5). It is therefore possible that the present classification of M87 as an AGN of category O is not physically justified but due to the nonsimultaneity of the Gaia and MOJAVE data. This effect could also influence other low-redshift sources. However, the association proposed here and the transverse component of the Gaia proper motion of M87 require further investigation. Moreover, the RUWE value is high, and the location of the Gaia centroid can be influenced by optical radiation from the host galaxy and the larger-scale jet. New optical/IR data expected from the Hubble Space Telescope (HST) and the James Webb Space Telescope (JWST) should help to clarify these issues.
Both 0238−084 (NGC 1052, z = 0.005) and 0055+300 (NGC 315, z = 0.017) are low-spectrum-peak radio galaxies with a two-sided structure on the kiloparsec scale. Their jets appear subluminal at the parsec scale, with a maximum speed of respectively 1.26 mas yr−1 and 0.049 mas yr−1 measured by MOJAVE (Lister et al. 2019). However, they differ in their VLBI structure, which is two-sided for 0238-084, and one-sided for 0055+300 (this latter is detected by Fermi/LAT). Both galaxies are bright elliptical galaxies, with galactic components clearly visible on Pan-STARRS1 images (Flewelling et al. 2020) or SDSS (Abdurro’uf et al. 2022). Their nuclei have been classified as low-ionization nuclear emission line regions (LINERs, Ho et al. 1997). We note that Gaia does not provide any proper motion or RUWE values for their optical centroid, and the current Gaia data correspond to poor astrometric solutions for these two cases. Future Gaia releases may allow us to better determine their optical positions. In such circumstances, the large separation obtained in the present analysis could be due to the influence of the host galaxy, if the active nucleus is not exactly located at the global photometric center of the galaxy, or to the presence of some specific optical nuclear features, which could contaminate the measurement of the optical centroid by Gaia at the subarcsecond scale. Indeed, high-resolution V and I images obtained by the HST of the central region of 0055+300 show a circumnuclear disk seen in absorption, highly inclined at a position angle of ∼40 degrees, and extended to 1.45 arcsec, with an unresolved nuclear source at its center (Capetti et al. 2000). Such dusty structure results in an asymmetry of the central zone, which appears slightly brighter on its eastern side in the optical range, which could be compatible with the separation between the radio and optical centroids shown in Fig. 8. The situation could be somewhat similar for 0238-084 but there the nuclear region shows a complex and clumpy optical structure with absorption as well as emission features in the inner arcseconds, possibly due to a warped accretion disk, with a jet misaligned with the rotation axis of the inner disk and interacting with its own disk (Dopita et al. 2015). The presence of several components emitting in the optical range, such as ionized gas, cocoon shocks, a stellar disk, and bipolar outflows (Pogge et al. 2000; Ravindranath et al. 2001; Cazzoli et al. 2022), makes it difficult to come to any firm conclusions as to the resulting optical centroid as measured by Gaia at the subarcsecond scale.
0429+415 or 3C 119, is a CSS source associated with a galaxy dominated by its nucleus at z = 1.023. Such CSS sources are intrinsically small but powerful radio sources usually seen as representing early stages of the evolution of radio AGN, and possibly confined to small dimensions by a dense interstellar medium (O’Dea & Saikia 2021). These sources often show complex radio VLBI structures quite different from the typical core–jet structure of blazars, and their VLBI centroids can be rather far from the radio cores. This is the case for 3C 119, where the VLBI centroid is located along the inner jet at about 35 mas from the core and seems to result mainly from the two polarized components B and C mapped by multi-frequency VLBI (Mantovani et al. 2010), before the jet bends at a projected distance of about 325 pc from the core, suggesting a strong interaction with a dense ambient gas. In this AGN, the Gaia centroid is located at about 6.2 mas from the core, in a direction opposite to the VLBI jet structure. Its proper motion estimated by Gaia (866 μas yr−1) appears 13 times higher than the maximal speed of 67 μas yr−1 detected by MOJAVE for the radio VLBI components, and is tilted at a large angle to the jet, possibly suggesting the presence of a counter-jet feature. However, this measurement is subject to large uncertainty and requires further investigation.
The last source of Fig. 8, 0648−165 (PKS B0648−165), is a low-spectral-peaked, flat-spectrum, one-sided gamma-ray-emitting radio source classified as a probable FSRQ by Lefaucheur & Pita (2017). 0648−165 presents the highest radio–optical shift of our sample, larger than 0.5 arcsec. The location of the Gaia centroid (with a RUWE of 1.0) seems at first glance unrelated to the direction of the radio jet visible on MOJAVE maps as extending westward. No optical counterpart was identified in a survey with limiting magnitude of about 20 (Torres & Wroblewski 1987) and the redshift is unknown. The 30-arcsec Pan-STARRS1 field reveals a red point source well detected in the i, z, and y bands with limiting magnitudes of 23 to 21, alone within a radius of 10 arcsec and with no sign of a perturbing bright object in its immediate vicinity able to shift the Gaia position estimate. If the association of this optical source with the AGN is real, the large and significant proper motion of about 2.9 mas yr−1 measured by Gaia could possibly be related to a relativistic motion for instance along a highly curved jet. However, the Gaia data on parallax and proper motion are also compatible with a faint galactic source. The parallax is nevertheless significant at 2.5σ, and though the Gaia object has been otherwise identified as a possible optical counterpart (e.g., SIMBAD), the identification remains questionable at this stage.
We note that the majority of the O sources show a Gaia centroid that appears likely related to the radio jet itself, despite the absence of direct coincidence with a well-identified radio component. In some sources, such as 1011+496 or 0106+678, the Gaia centroid can indeed be associated with a faint radio knot not listed by MOJAVE. In other sources, such as 1845+797, 1833+326, 2356+196, or 3C 309.1, the Gaia centroid is located very close to the radio VLBI centroid, which suggests a similarity (and a possible common origin) of the extended structures observed in the radio and optical ranges. Most often, as shown in Fig. 5, the Gaia centroid of O sources is located along the jet direction, in the inner flow or at the periphery of the jet mapped by MOJAVE (at the end or at the edges). It is therefore possible that the optical centroid is a signature of the presence of a new knot that goes undetected in the radio range, as in the case of 0615−172, where the Gaia proper motion is well directed along the jet direction. When the Gaia centroid is inside the jet, it is also possible that its location results from the contribution of some of the radio components (core and knots) to the optical emission, and therefore cannot be associated with a single radio knot, which induces a large normalized separation in the present study. This could be the case for instance for 0212+735, where the optical centroid lies between the radio core and the VLBI centroid. This could also explain why in some sources, such as AP Lib, 0923+392, 1538+149, and 0118−272, the Gaia centroid appears to move along the jet but against the flow, toward the nucleus, resulting from a simple increase in the optical flux of the optical components located closer to the core. However, in some cases, such apparent upstream motion could also be due to the presence of bent or helical jets. A third possibility is that the nonsimultaneity of the radio maps and of the acquisition of Gaia data blurs the correspondence between the knots detected at radio and optical frequencies. As discussed above, this interpretation seems to apply to M87. This effect probably affects some of the O sources, such as Mrk 501 and other AGN with high Gaia proper motion such that VG > VM.
In category O, the Gaia centroid of a few sources, although still partially related to the jet physics, is likely influenced by the presence of various additional optical emission or absorption components due to the host galaxy, to circumnuclear features such as dust disks, or even to the interaction of the nuclear jet with a dense environment, which can increase the radio–optical shift. This concerns mostly a few Seyfert galaxies, liners, or CSS/CSO sources, such as NGC 6251, NGC 1052, and 1509+054.
Finally, there are only a handful of O sources that seem very peculiar. This is especially the case for 0723−008, 3C 119, and 1923+210, which show a Gaia centroid along the jet axis but on the other side of the core, opposite to the jet. This unexpected situation requires further investigation; if this result is confirmed, the optical emission may be a signature of the presence of a counterjet in these AGN. Finally, one source, 0648−165, remains highly enigmatic. If the Gaia source is genuinely associated to the AGN, its high proper motion implies a relativistic speed of the optical centroid, which is hard to explain by a cosmic phenomenon other than a jet. However, the Gaia centroid is far from any radio structure on the sky. This case will require further study, in particular in optics, to confirm or nullify the validity of the association.
5. Conclusion
In this study, we compared the relative positions of the Gaia DR3 optical centroid, the 8 GHz radio centroid given by geodetic VLBI, and the various radio jet components revealed by the MOJAVE VLBI program for a set of 422 sources of the ICRF3, which constitute the GIM sample dominated by blazars. We separated these AGN into four categories, namely C, B, J, and O, based on their respective distances and location close to the core, to the jet base, or to a jet component.
About 65% of the sources have their optical centroid either associated to the radio core or sufficiently close to it to render a clear separation from it ambiguous (categories C and B), although 33% are located closer to a radio knot at the base of the jet (category B). Imaging at higher resolution (higher radio frequencies) as well as improved absolute astrometry with future releases of the Gaia catalog and ICRF versions should make it possible to remove the ambiguity on category B sources and to specify their association with the core or with the base of the jet. The remaining 35% of the sources have either an optical centroid close to a jet radio knot (category J) or no direct identification of their optical centroid with a well-identified radio component (category O). Nevertheless, the optical centroid of the vast majority of O sources still appears related to the VLBI radio jet structure.
This study strengthens and clarifies some trends already highlighted in previous works concerning the spatial distribution of the optical counterparts around the radio core, most of them being downstream in the jet (Kovalev et al. 2017), with those closer to the core being found to be bluer on average, suggesting a possible contribution of the accretion disk to the optical emission (Plavin et al. 2019a). This is found to be consistent with FSRQs with bright disks dominating categories C and B, while the optical counterparts of category J and O sources located farther from the core are redder on average, as expected from the optical synchrotron emission of blazar jets, with an increasing relative number of BL Lac objects (and radio galaxies) with under-luminous accretion disks in these two categories. Sources of category J exhibit a total linear radio polarization that is globally higher than that of sources in categories C, B, and O, which could be explained by the higher influence of BL Lacs in this category (compared to categories C and B), and the growing influence of radio galaxies in category O.
Regarding proper motions, it is striking to note that the radio knots associated to Gaia centroids usually show low apparent velocities characteristic of stationary or quasi-stationary jet features, as observed by MOJAVE. We note that the optical proper motions measured by Gaia appear globally larger than the MOJAVE proper motions of their corresponding radio components. This is particularly the case for category O sources (up to a factor of ∼5), which could be due to the tendency of sources showing fast motion in the optical range to be classified as O sources just because of the frequent nonsimultaneity of the radio and optical data considered in the present study, which may blur any association between optical centroids and radio components. The astrometric uncertainties of Gaia, for instance in crowded fields, may also limit the significance of the high proper motion measurements. However, if confirmed, this effect could suggest the presence of different kinds of perturbations along the jet, those detected at optical frequencies propagating more rapidly than their associated radio features, such as for instance a fast-moving zone activated when crossing a standing shock. Conversely, fast apparent velocities detected by Gaia could also result from an uncorrelated variability of the fluxes of different optical components that influence the location of the Gaia centroid. Future releases of Gaia will probably bring better estimates with precision comparable to MOJAVE proper motions and allowing a more relevant comparison between the radio and optical apparent velocities. As we deal with time variability, we underline the importance of determining time series of centroid positions as currently done in the radio domain with geodetic VLBI (e.g., Gattano et al. 2018) and – if possible – similarly in the optical. Better knowledge and consideration of the temporal evolution of sources at the submilliarcsecond scale, both at radio and optical wavelengths, will be a major asset for progress in the multiwavelength description of blazars and for our understanding of the mechanisms at play.
From an astrometry point of view, the radio (8 GHz) centroids of category B and C sources appear to be slightly more stable than those of the sources from the other categories. An interesting point here is that, for the sources where the optical centroid is coincident with a radio component, and if this coincidence remains in time, it offers a means to link the radio and optical reference frames even if the radio and optical centroids are significantly separated. The tie between the radio and optical position, for a given source, can be retrieved by VLBI imaging. For reference frame realization, sources from categories C and B, but also J (and some O), can therefore be used, on the condition that the latter be imaged regularly to follow the radio counterpart of the optically bright component. In this paradigm, VLBI imaging becomes an essential segment of the multiwavelength reference frame realization in addition to global absolute astrometry, and must be encouraged and coordinated with other techniques.
Acknowledgments
This work has made use of data from the European Space Agency (ESA) mission Gaia (https://www.cosmos.esa.int/gaia), processed by the Gaia Data Processing and Analysis Consortium (DPAC, https://www.cosmos.esa.int/web/gaia/dpac/consortium). Funding for the DPAC has been provided by national institutions, in particular the institutions participating in the Gaia Multilateral Agreement. This research has made use of the NASA/IPAC Extragalactic Database (NED), which is operated by the Jet Propulsion Laboratory, California Institute of Technology, under contract with the National Aeronautics and Space Administration.
References
- Abdollahi, S., Acero, F., Ackermann, M., et al. 2020, ApJSS, 247, 33 [NASA ADS] [CrossRef] [Google Scholar]
- Abdurro’uf, Accetta, K., Aerts, C., et al. 2022, ApJ, 259, 35 [Google Scholar]
- Arias, E. F., Charlot, P., Feissel, M., & Lestrade, J.-F. 1995, A&A, 303, 604 [Google Scholar]
- Biretta, J. A., Sparks, W. B., & Macchetto, F. 1999, ApJ, 520, 621 [NASA ADS] [CrossRef] [Google Scholar]
- Blandford, R., Meier, D., & Readhead, A. 2019, ARA&A, 57, 467 [NASA ADS] [CrossRef] [Google Scholar]
- Brown, A. G. A., Vallenari, A., Prusti, T., et al. 2016, A&A, 595, A2 [NASA ADS] [CrossRef] [EDP Sciences] [Google Scholar]
- Brown, A. G. A., Vallenari, A., Prusti, T., et al. 2018, A&A, 616, A1 [NASA ADS] [CrossRef] [EDP Sciences] [Google Scholar]
- Brown, A. G. A., Vallenari, A., Prusti, T., et al. 2021, A&A, 649, A1 [NASA ADS] [CrossRef] [EDP Sciences] [Google Scholar]
- Capetti, A., de Ruiter, H. R., Fanti, R., et al. 2000, A&A, 362, 871 [NASA ADS] [Google Scholar]
- Cazzoli, S., Hermosa Muñoz, L., Márquez, I., et al. 2022, A&A, 664, A135 [NASA ADS] [CrossRef] [EDP Sciences] [Google Scholar]
- Chamani, W., Savolainen, T., Ros, E., et al. 2023, A&A, 672, A130 [NASA ADS] [CrossRef] [EDP Sciences] [Google Scholar]
- Charlot, P. 1990, AJ, 99, 1309 [Google Scholar]
- Charlot, P., Jacobs, C. S., Gordon, D., et al. 2020, A&A, 644, A159 [EDP Sciences] [Google Scholar]
- Dopita, M. A., Ho, I.-T., Dressel, L. L., et al. 2015, ApJ, 801, 42 [NASA ADS] [CrossRef] [Google Scholar]
- Fabricius, C., Luri, X., Arenou, F., et al. 2021, A&A, 649, A5 [NASA ADS] [CrossRef] [EDP Sciences] [Google Scholar]
- Feissel, M., & Mignard, F. 1998, A&A, 331, L33 [Google Scholar]
- Feissel, M., Gontier, A. M., & Eubanks, T. M. 2000, A&A, 359, 1201 [NASA ADS] [Google Scholar]
- Fey, A. L., Eubanks, M., & Kingham, K. A. 1997, AJ, 114, 2284 [CrossRef] [Google Scholar]
- Fey, A. L., Gordon, D., Jacobs, C. S., et al. 2015, AJ, 150, 58 [Google Scholar]
- Flewelling, H. A., Magnier, E. A., Chambers, K. C., et al. 2020, ApJ, 251, 7 [NASA ADS] [Google Scholar]
- Gattano, C., & Charlot, P. 2021, A&A, 648, A125 [NASA ADS] [CrossRef] [EDP Sciences] [Google Scholar]
- Gattano, C., Lambert, S. B., & Le Bail, K. 2018, A&A, 618, A80 [NASA ADS] [CrossRef] [EDP Sciences] [Google Scholar]
- Ginzburg, V. L. 1979, Theoretical Physics and Astrophysics (Pergamon Press) [Google Scholar]
- Ho, L. C., Filippenko, A. V., Sargent, W. L. W., & Peng, C. Y. 1997, ApJS, 112, 391 [NASA ADS] [CrossRef] [Google Scholar]
- Hutsemékers, D., Borguet, B., Sluse, D., & Pelgrims, V. 2018, A&A, 620, A68 [NASA ADS] [CrossRef] [EDP Sciences] [Google Scholar]
- Kovalev, Y. Y., Lobanov, A. P., Pushkarev, A. B., & Zensus, J. A. 2008, A&A, 483, 759 [NASA ADS] [CrossRef] [EDP Sciences] [Google Scholar]
- Kovalev, Y. Y., Petrov, L., & Plavin, A. V. 2017, A&A, 598, L1 [NASA ADS] [CrossRef] [EDP Sciences] [Google Scholar]
- Kovalev, Y. Y., Zobnina, D. I., Plavin, A. V., & Blinov, D. 2020, MNRAS, 493, L54 [Google Scholar]
- Lambert, S., Liu, N., Arias, E. F., et al. 2021, A&A, 651, A64 [NASA ADS] [CrossRef] [EDP Sciences] [Google Scholar]
- Lefaucheur, J., & Pita, S. 2017, A&A, 602, A86 [NASA ADS] [CrossRef] [EDP Sciences] [Google Scholar]
- Lister, M. L., & Homan, D. C. 2005, AJ, 130, 1389 [NASA ADS] [CrossRef] [Google Scholar]
- Lister, M. L., Aller, M. F., Aller, H. D., et al. 2018, AJ, 234, 12 [Google Scholar]
- Lister, M. L., Homan, D. C., Hovatta, T., et al. 2019, ApJ, 874, 43 [NASA ADS] [CrossRef] [Google Scholar]
- Lister, M. L., Homan, D. C., Kellermann, K. I., et al. 2021, ApJ, 923, 30 [NASA ADS] [CrossRef] [Google Scholar]
- Lobanov, A. P. 1998, A&A, 330, 79 [NASA ADS] [Google Scholar]
- MacMillan, D. S., & Ma, C. 2007, J. Geod., 81, 443 [NASA ADS] [CrossRef] [Google Scholar]
- Mantovani, F., Rossetti, A., Junor, W., Saikia, D. J., & Salter, C. J. 2010, A&A, 518, A33 [NASA ADS] [CrossRef] [EDP Sciences] [Google Scholar]
- Martí-Vidal, I., Marcaide, J. M., Guirado, J. C., Pérez-Torres, M. A., & Ros, E. 2008, A&A, 478, 267 [NASA ADS] [CrossRef] [EDP Sciences] [Google Scholar]
- Mignard, F., Klioner, S., Lindegren, L., et al. 2016, A&A, 595, A5 [NASA ADS] [CrossRef] [EDP Sciences] [Google Scholar]
- Mignard, F., Klioner, S. A., Lindegren, L., et al. 2018, A&A, 616, A14 [NASA ADS] [CrossRef] [EDP Sciences] [Google Scholar]
- Nothnagel, A., Artz, T., Behrend, D., & Malkin, Z. 2017, J. Geod., 91, 711 [Google Scholar]
- O’Dea, C. P., & Saikia, D. J. 2021, A&A Rev., 29, 3 [CrossRef] [Google Scholar]
- Padovani, P., Alexander, D. M., Assef, R. J., et al. 2017, A&A Rev., 25, 2 [NASA ADS] [CrossRef] [Google Scholar]
- Paliya, V. S., Ajello, M., Rakshit, S., et al. 2018, ApJ, 853, L2 [NASA ADS] [CrossRef] [Google Scholar]
- Paliya, V. S., Parker, M. L., Jiang, J., et al. 2019, ApJ, 872, 169 [NASA ADS] [CrossRef] [Google Scholar]
- Park, J., Hada, K., Kino, M., et al. 2019, ApJ, 887, 147 [Google Scholar]
- Petrov, L., & Kovalev, Y. Y. 2017, MNRAS, 467, L71 [Google Scholar]
- Petrov, L., Kovalev, Y. Y., & Plavin, A. V. 2018, MNRAS, 482, 3023 [Google Scholar]
- Plavin, A. V., Kovalev, Y. Y., & Petrov, L. Y. 2019a, ApJ, 871, 143 [Google Scholar]
- Plavin, A. V., Kovalev, Y. Y., Pushkarev, A. B., & Lobanov, A. 2019b, MNRAS, 485, 1822 [NASA ADS] [CrossRef] [Google Scholar]
- Pogge, R. W., Maoz, D., Ho, L. C., & Eracleous, M. 2000, ApJ, 532, 323 [NASA ADS] [CrossRef] [Google Scholar]
- Porcas, R. W. 2009, A&A, 505, L1 [NASA ADS] [CrossRef] [EDP Sciences] [Google Scholar]
- Prusti, T., de Bruijne, J. H. J., Brown, A. G. A., et al. 2016, A&A, 595, A1 [NASA ADS] [CrossRef] [EDP Sciences] [Google Scholar]
- Pushkarev, A. B., Hovatta, T., Kovalev, Y. Y., et al. 2012, A&A, 545, A113 [NASA ADS] [CrossRef] [EDP Sciences] [Google Scholar]
- Pushkarev, A. B., Aller, H. D., Aller, M. F., et al. 2023, MNRAS, 520, 6053 [NASA ADS] [CrossRef] [Google Scholar]
- Ravindranath, S., Ho, L. C., Peng, C. Y., Filippenko, A. V., & Sargent, W. L. W. 2001, AJ, 122, 653 [Google Scholar]
- Snios, B., Nulsen, P. E. J., Kraft, R. P., et al. 2019, ApJ, 879, 8 [NASA ADS] [CrossRef] [Google Scholar]
- Sokolovsky, K. V., Kovalev, Y. Y., Pushkarev, A. B., & Lobanov, A. P. 2011, A&A, 532, A38 [CrossRef] [EDP Sciences] [Google Scholar]
- Souchay, J., Secrest, N., Lambert, S., et al. 2022, A&A, 660, A16 [NASA ADS] [CrossRef] [EDP Sciences] [Google Scholar]
- Titov, O., Frey, S., Melnikov, A., et al. 2022, MNRAS, 512, 874 [NASA ADS] [CrossRef] [Google Scholar]
- Torres, C., & Wroblewski, H. 1987, A&AS, 69, 23 [NASA ADS] [Google Scholar]
- Vallenari, A., Brown, A. G. A., Prusti, T., et al. 2022, A&A, 674, A1 [Google Scholar]
- Xu, M. H., Lunz, S., Anderson, J. M., et al. 2021, A&A, 647, A189 [EDP Sciences] [Google Scholar]
All Tables
Number of sources falling in each category: C for Core, B for Base (of the jet), J for Jet, and O for Other, and subcategory (downstream, upstream, or elsewhere), and their median separation.
All Figures
|
Fig. 1. Sketch of the geometry of the relative positions of the radio core, the Gaia optical centroid, and a MOJAVE component. |
| In the text | |
|
Fig. 2. (Top) Distribution of dCV and (Bottom) of its rms of computed over the existing epochs for each source. |
| In the text | |
|
Fig. 3. Configurations corresponding to the four categories of radio/optical identification as defined in this study. In the top panel, the dotted-circles represent the contour of 99% confidence around the optical centroid or the radio core and knots. |
| In the text | |
|
Fig. 4. Number of sources in each category for various additional errors. Upper plot: Systematic change in position of the MOJAVE centroid by 0.2–0.6 mas along the jet for all sources. Middle plot: Random translation of the MOJAVE centroid by 0.2–0.6 mas in a random direction. Lower plot: Effect of inflating the VLBI and Gaia positional uncertainties by 0.2–0.6 mas. |
| In the text | |
|
Fig. 5. Boxplots of various astrometric and photometric quantities following the source category. The boxplots in pink are related to optical centroids not identified with radio components: in such cases, the boxplot reports the radio properties of the MOJAVE component closest to the optical centroid. The thick horizontal line in the whisker represents the median value. The box limits are the first and third quartiles, and the extreme horizontal bars indicate the 5th and 95th percentiles. |
| In the text | |
|
Fig. 6. Statistics of Gaia and MOJAVE apparent proper motion amplitude and of the differences between Gaia proper motions and the MOJAVE measurements of the apparent motion of the VLBI component (amplitude and position angle). In the middle plot of the upper row, the boxplot in pink reports the radio properties of the MOJAVE component closest to the optical centroid. The MOJAVE proper motion of sources of category C being null, these sources are not considered in the MOJAVE-related plots. In the difference plots, “All BJO” reports the statistics of the overall B, J, and O sources. |
| In the text | |
|
Fig. 7. Number and proportion of AGN spectral types in each category. |
| In the text | |
|
Fig. 8. Maps reconstructed from MOJAVE model-fitting of Lister et al. (2021) with X-band (violet star) and optical (yellow disk) centroids and the MOJAVE components (blue) for particular sources (see text) and their 99% confidence ellipses. These sources are all classified in category O and are presented in order of increasing radio–optical shift. For the last two, the shift between the MOJAVE components and the Gaia centroid is so high that their VLBI radio jet cannot be seen at this scale. |
| In the text | |
Current usage metrics show cumulative count of Article Views (full-text article views including HTML views, PDF and ePub downloads, according to the available data) and Abstracts Views on Vision4Press platform.
Data correspond to usage on the plateform after 2015. The current usage metrics is available 48-96 hours after online publication and is updated daily on week days.
Initial download of the metrics may take a while.