| Issue |
A&A
Volume 695, March 2025
|
|
|---|---|---|
| Article Number | A135 | |
| Number of page(s) | 9 | |
| Section | Extragalactic astronomy | |
| DOI | https://doi.org/10.1051/0004-6361/202453551 | |
| Published online | 12 March 2025 | |
Correlation of long-term optical color variability of radio-loud quasars with their VLBI astrometric characteristics
1
LTE, Observatoire de Paris, Université PSL, CNRS UMR8255, Sorbonne Université, Université de Lille, LNE, 61 avenue de l’Observatoire, 75014 Paris, France
2
U.S. Naval Observatory, 3450 Massachusetts Ave NW, Washington, DC 20392-5420, USA
Received:
20
December
2024
Accepted:
10
February
2025
Abstract
Aims. The International Celestial Reference Frame (ICRF) is realized through geodetic very long baseline interferometry (VLBI) positions of thousands of extragalactic objects, mainly radio-loud active galactic nuclei. As previous studies have suggested a link between the optical variability of these sources and optical-radio position offsets and variability, we want to explore the possible relationships between these astrometric quantities and the color variability that characterizes VLBI sources.
Methods. We computed the BP/RP and color-magnitude correlations of 2584 ICRF sources using the Gaia DR3 photometric time series at the GBP (BP), GRP (RP), and G bands, and we compared them with astrometric properties (Gaia-VLBI optical-radio offsets and positional variability derived from VLBI coordinate time series). We also searched for possible biases coming from the length of the photometric series, the magnitude, the redshift, and the jet viewing angle when available as well as correlations between the color variability and the central engine properties (black hole mass and accretion luminosity).
Results. We find that the most astrometrically stable sources and the sources with smaller optical-radio shifts have lower values of BP/RP correlation and low color-magnitude correlations, corresponding to the undefined-when-brighter (or redder-stable-when-brighter and bluer-stable-when-brighter) classes of optical variability. These preferred astrometric objects often belong to the spectral class FSRQ and have a z of about one and higher. We found a significant correlation for both of the astrometric stability measures with the jet viewing angle. The shorter optical-radio offsets occur in active galactic nuclei that contain more massive black holes and more luminous accretion disks, which may be caused by the tendency of smaller viewing angles to be associated with higher redshifts.
Conclusions. Our results strengthen the hypothesis that the Doppler boosting effect on luminosity and geometry is the driving physical mechanism at the origin of the observed optical-radio position offsets and the astrometric variability suggested by previous studies. The results define additional predictors of absolute astrometric performance of reference frame candidates, and they supplement the optical variability criterion. Moreover, this work demonstrates that the relatively short time span (a few years) and irregular sampling of the Gaia light curves are sufficient to predict the astrometric stability of new reference frame objects. This study also shows that absolute astrometry with the geodetic VLBI is a valuable tool to gain new insight into the physical processes responsible for quasar activity in the inner parts of the relativistic engines.
Key words: techniques: interferometric / astrometry / reference systems / galaxies: jets / quasars: general
© The Authors 2025
 Open Access article, published by EDP Sciences, under the terms of the Creative Commons Attribution License (https://creativecommons.org/licenses/by/4.0), which permits unrestricted use, distribution, and reproduction in any medium, provided the original work is properly cited.
This article is published in open access under the Subscribe to Open model. This email address is being protected from spambots. You need JavaScript enabled to view it. to support open access publication.
1. Introduction
Modern celestial reference systems are realized through compact extragalactic objects – mostly quasars – that are monitored by high accuracy space and geodetic techniques. These techniques involve, since the 1980s, the geodetic very long baseline interferometry (VLBI) network (see Nothnagel et al. 2017, and references therein) and, since 2013, the European Space Agency (ESA) Gaia satellite (Gaia Collaboration 2016). The VLBI observations have predominantly been made in the geodetic S/X radio bands (2.2/8.4 GHz), and recently they have included the K (22 GHz) and Ka (32 GHz) bands, forming successive iterations of the International Celestial Reference Frame (ICRF; Ma et al. 1998; Fey et al. 2015; Charlot et al. 2020). Gaia, on the other hand, has realized an independent frame of comparable precision aligned to the ICRF1 at visual wavelengths (Arias et al. 1995; Feissel & Mignard 1998; Gaia Collaboration 2022).
The compactness and the astrometric stability of the reference sources is therefore an essential condition to have a reliable and stable reference frame. The arrival of Gaia added the condition of having reasonable optical-radio (OR) position offsets that have unfortunately been shown to be of the order of a few 0.1 mas to several milliarcseconds (Petrov & Kovalev 2017; Makarov et al. 2017). The sub-milliarcsecond precision of VLBI and Gaia positions corresponds to physical scales of a few parsecs for a typical z ∼ 1 source given h ∼ 0.7, so the physics of the central engine contributes to its apparent position. For example, the VLBI technique yields the position of the radio brightness peak, which is frequency dependent due to synchrotron self-absorption, so it lies somewhere downstream of the true base of the jet. Gaia positions, in contrast, correspond to proper centroids set by the sum of various physical sub-components, such as the accretion disk, jet, and host galaxy, within the point spread function. Recent studies have shown that the optical centroid is generally downstream of the jet (Kovalev et al. 2017; Plavin et al. 2019), with some evidence that it is, in some cases, coincident with radio features in the jet (Lambert et al. 2021, 2024).
Radio-bright quasars emit in a very wide range of wavelengths, from radio to γ-rays, and some show violent variability on various timescales ranging from minutes (intraday variability) to years (long-term variability). Their spectral energy distributions (SEDs) are characterized by non-thermal continuum spectra consisting of two components: a low-energy component peaking anywhere from infrared to X-ray frequencies and a high-energy component peaking at frequencies from hard X-rays to TeV gamma-rays. The low-energy component is attributed to the synchrotron radiation emitted by relativistic electrons in the jets. While the origin of the high-energy component is not fully understood, it is commonly thought to be due to the inverse-Compton scattering of soft photons by the same relativistic electrons (see a review in Blandford et al. 2019).
Interestingly, the photometric variability of active galactic nuclei (AGNs) on timescales of a few months to years as measured by Gaia was shown to be inversely correlated with the OR offset (Secrest 2022), a result subsequently corroborated by the finding that the time variability of VLBI positions appears to also be negatively correlated with the photometric variability (Lambert & Secrest 2024), suggesting that the photometric variability can be used as an efficient proxy to predict whether a source is a reliable celestial reference frame source. These relationships appear consistent with the small jet viewing-angle that defines blazars, reducing the projected displacements between radio and optical positions while boosting the flux and amplitude of their photometric variations.
The above works were based on the G-band fractional variability and ignored other photometric bands. However, the latest data release (DR3) of Gaia also provides time series magnitudes and fluxes in the GBP (BP) and GRP (RP) bands (Eyer et al. 2023), thus allowing study of their long-term variability separately. In the present study, we used the BP and RP times series data with Gaia and VLBI astrometry to address the question of how the consideration of colors in photometric variability is linked to astrometric parameters of interest for reference frame realization (OR offsets and astrometric stability) and to the intrinsic properties of the sources, including the spectral class, the jet viewing angle, and the emission mechanisms from disk and/or jet.
2. Data
We obtained Gaia photometric time series in G, BP, and RP photometric bands from Eyer et al. (2023) and selected those of 2813 AGNs that are common to the Gaia DR3 catalog and the third release of the international celestial reference frame (ICRF3, Charlot et al. 2020). The cross-identification between the ICRF3 and Gaia catalog was realized with a cross-match radius of  . The length of the photometric time series is not homogeneous: The median length is 2.5 yr but the minimum length is as low as 0.25 yr, and about one hundred sources have lengths less than 2 yr. We chose to reject the latter, keeping only photometric series longer than 2 yr, which constitutes a much more homogeneous sample for which the first and third quartiles are 2.47 yr and 2.58 yr, respectively. This left 2584 sources, for which Gaia also gives the G magnitude and the color index BP-RP. In addition, we retrieved spectroscopic redshifts from the NASA/IPAC Extragalactic Database (NED) available for 2035 of our sources.
The faintest magnitudes can constitute a serious source of systematic error. First, Lindegren et al. (2021) have stated that beyond G ∼ 18, the number of sources with a five-parameter astrometric solution drastically decreases, thus making the position unsure (and consequently the OR offset). Second, the BP magnitude of sources fainter than about 20.5 and the RP magnitude of sources fainter than about 20 is biased toward brighter values (Fabricius et al. 2021) so that the BP-RP color index is likely inaccurate for sources with G > 20. One-quarter of our sample has a G magnitude fainter than 19.6. For this reason, we used a color index G-RP instead of BP-RP as recommended by Fabricius et al. (2021) when the sample includes faint sources.
We then computed for each source the correlation coefficients ρBP, RP between BP and RP and ρG, G − RP between color index G-RP and magnitude G (color-magnitude correlation). Such coefficients can only be computed between time series sampled at the same epochs. However, the number of epochs in each band differs sometimes, albeit slightly, because of data rejection in one or several bands on the basis of the Gaia variability processing or negative (physically meaningless) flux. Moreover, the epochs have no strict correspondence in each band. We overcame these disagreements by averaging the magnitude and fluxes in fixed-length windows of 15 days and keeping only the windows for which G, BP, and RP values are available. Such a compromise allowed us to conserve the general shape of the series and to compute differences and correlations between bands. In each window, the averaging was done by the sample weighted mean. An uncertainty was computed as the weighted standard error on the mean. The correlation was measured using the Spearman ρ coefficient characterizing the ordinal association without assumption of a linear relationship. Spearman coefficients have an associated p-value that gives the probability of obtaining results as extreme as those actually observed under the null hypothesis of stochastically independent variables.
As astrometric quantities of interest, we considered the OR separations and their normalized values (referred to as X) between optical and radio centroids computed from the coordinate differences between the ICRF3 (Charlot et al. 2020) and Gaia DR3 (Gaia Collaboration 2023) astrometric catalogs using formulae of Mignard et al. (2016). We also considered the astrometric variability Avar from VLBI coordinate time series already used in Lambert & Secrest (2024) and derived from the entire geodetic VLBI database available from the International VLBI Service for Geodesy and Astrometry (IVS; Nothnagel et al. 2017). The VLBI astrometric time series are highly inhomogeneous from one source to another. Only 2156 objects in our sample have a coordinate time series longer than five measurements, and only these objects were considered further in this work. In addition to Avar, which is given by the amplitude of the strongest eigenvalue of the position covariance matrix, we also computed the shape parameter of the dispersion ellipse of single-epoch positions Aell as the ratio of the strongest eigenvalue to the weakest one. We refer to this quantity as astrometric ellipticity in the following, and it is the same as the degree of elongation defined by Eq. (3) of Makarov et al. (2024). The parameter Aell ranges from small positive values close to unity for isotropic distributions of the VLBI position measurements around the mean position to high values for much elongated distributions. In our sample, we find that Aell and Avar are strongly correlated, with a correlation coefficient of about 0.5. High-Avar dispersion, often coinciding with high elongation, is likely linked to the spatial extent of the radio structure at the milliarcsecond scale, reflecting the core-jet structure with an extended relativistic jet. We provide electronically the full table with these parameters.
Our sample has a median OR offset of 0.49 mas with an interquartile range of [0.26 0.96] mas, respectively; a median X of 1.79 [1.04 3.03]; a median redshift of 1.16 [0.65 1.73] with a maximum redshift of 4.63; a median G of 18.5 [17.8 19.6]; and a median BP-RP of 0.78 [0.59 1.07]. Following spectral classes retrieved from the incremental fourth Fermi/Large Array Telescope (LAT) catalogue (Abdollahi et al. 2022), our sample contains 591 identified flat spectrum radio quasars (FSRQs) and 284 identified BL Lacertae (BL Lacs) objects. The remainder contains 130 blazars of uncertain type, while 1542 sources were simply not detected by Fermi/LAT). Spectral classes taken from the OCARS database (Malkin 2018) provides 1734 quasars and 430 BL Lacs. Both suggest a large excess of FSRQs over the BL Lacs.
3. Analysis and results
Figure 1 displays the sample distribution of the BP/RP correlation ρBP, RP and brightness-color correlation ρG, G − RP. For comparison, the distribution for a much larger sample is also shown, namely, 307317 Gaia-CRF3 sources brighter than G = 19.6 provided in Makarov (2024). Our ρBP, RP distribution is clearly shifted toward positive values, with a median correlation of 0.51. The median is even higher for the BL Lacs group, at 0.84, and it is 0.65 for the FSRQ group. The highly positive median for the BL Lacs is in line with the dominance of the jet for this spectral class, while the disk-dominated FSRQs are more marginally perturbed by the jet activity in the bluer part of the spectrum. The brightness-color correlation median for our sample is also clearly positive (0.20). It is estimated at 0.39 for BL Lacs and 0.03 for FSRQs. Theses distributions are consistent with a number of previous studies using independent data and source samples (e.g., Negi et al. 2022; Zhang et al. 2015, 2022; Schmidt et al. 2012; Jovanović et al. 2023; Gaur et al. 2012). However, our median values differ from Makarov (2024), who found a median of 0.224 for ρBP, RP and 0.1 for ρG, G − RP, reflecting the consequences of the dominance of the jet in the ICRF (radio-loud) quasars that have more coherent BP and RP variations and a bluer-when-brighter (BWB) behavior (see next paragraph) during jet activity periods.
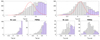 |
Fig. 1. Distribution of BP/RP correlation ρBP, RP and color-magnitude correlation ρG, G − RP for all sources (gray) and for p-values lower than 0.05 (blue). In pink is the distribution of 307317 Gaia-CRF3 sources brighter than G = 19.6 from Makarov (2024) normalized to the maximum value of the gray histogram. |
Indeed, the FSRQ spectral energy distribution combines both the disk and the jet components in comparable measures, resulting in a medium color BP-RP. When the jet flares up, the beamed non-thermal emission increases with respect to the bluer thermal emission from the disk, leading to a redder-when-brighter (RWB) behavior. The BL Lacs, in contrast, have an underluminous disk (e.g., Urry & Padovani 1995; Prandini & Ghisellini 2022), and their brightness variations are mostly defined by the synchrotron activity in the jet. During a flare, fresh electrons are injected in the jet. As the highest energy electrons cool faster, the excess flux first occurs in the highest frequency bands, that is, on the blue side of the optical spectrum, making BL Lac objects BWB. (We note that though BL Lacs become bluer when they flare, they often remain redder than a quiescent FSRQ.) Many of the objects in the sample have a near-zero ρG, G − RP, which can be classified as an “unchanged” – when – brighter (UWB) regime. Such sources are susceptible to intermittent BWB and RWB phases, depending on the emission mechanism currently in action. The UWB objects have regimes designated as redder-stable-when-brighter or bluer-stable-when-brighter that were found in both the FSRQ and BL Lac populations (McCall et al. 2024). In the fainter state, the thermal emission from the disk drives the color variations (RWB), while in the brighter state, the color variations are dominated by the non-thermal emission from the jet (BWB; see Zhang et al. 2015). The existence of a stable-when-brighter regime was also found for some sources (Ghosh et al. 2000; McCall et al. 2024).
Figure 2 displays the BP/RP correlation ρBP, RP and the color-magnitude correlation ρG, G − RP as functions of the normalized OR offsets X and the astrometric variability for all sources, sources of G < 19, and sources whose ρBP, RP or ρG, G − RP are statistically significant at better than 95% (p < 0.05). As we wanted to determine whether there is a correlation between ρBP, RP or ρG, G − RP and the quantities X, Avar, and Aell, we computed the Spearman coefficient of the unbinned data, that is, the Spearman coefficient between ρBP, RP and X (Fig. 2, top-left), between ρBP, RP and Avar (Fig. 2, top-middle), and so on. The value of this coefficient is reported at the top of the subplots (second number) with the number of sources (left) and the associated p-value (right). In each subplot, the data were also partitioned in bins with an equal number of sources. For each bin, the median value is shown with dots connected by a thick line. The shaded area represents the 95% confidence interval of the median estimated using a Monte Carlo test of 1000 random permutations. In Fig. 2, the binning was done alternatively for all sources, for the brightest ones (G < 19), and for those whose ρBP, RP or ρG, G − RP has a p-value lower than 0.05.
 |
Fig. 2. BP/RP correlation ρBP, RP and color-magnitude ρG, G − RP correlations as functions of the normalized OR offsets X, the astrometric variability Avar and ellipticities Aell. Each dot represents one source. Dots are purple if the p-value associated with ρ is lower than 0.05. The thick, solid lines represent the median values of ρ in bins of equal number of sources for all sources (black), source whose G < 19 (green), and sources whose ρ has a p-value lower than 0.05. The shaded area represents the 95% confidence interval. The three numbers above the plots refer to, from left to right, the number of sources, the Spearman coefficient of the unbinned data and its p-value. |
Figure 3 illustrates possible biases and shows ρBP, RP and ρG, G − RP as functions of the series length, G magnitude, and redshift. The plots were built as described for Fig. 2 except that only the binning for all sources is considered.
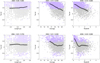 |
Fig. 3. BP/RP correlation ρBP, RP and color-magnitude ρG, G − RP correlations as functions of the series length, G magnitude, and the redshift. Each dot represents one source. Dots are purple if the p-value associated with ρ is lower than 0.05. The thick, solid line connects the median values of ρ computed for bins of equal number of sources sorted by the corresponding abscissa values. The shaded area represents the 95% confidence interval of the overall sample distribution. The three numbers above the plots refer, from left to right, to the number of sources, the Spearman coefficient of the unbinned data and its p-value. |
The BP/RP correlation ρBP, RP appears to be correlated only very weakly–if at all–with the normalized OR offset independent of whether the sample is reduced or not to the brightest sources or to the clearly significant values of ρBP, RP. In the absence of real OR offsets, the normalized separation X follows a Rayleigh distribution with σ = 1. The cumulative distribution function of the Rayleigh[1] distribution specifies the expected rate of sources with normalized offsets X below a given value X0 in the absence of additional perturbations or statistical dispersion. If we choose X0 = 3.96, for example, the expected rate of sources with larger offsets is only 0.0004, which translates to one source for our sample size. Therefore, any sources with X > X0 can be considered as formally confident outliers. This amounts to about 18% of the sample. This value is an upper bound, as it has been suggested that Gaia position errors are underestimated by about 6% (Secrest 2022). The median ρBP, RP is 0.51 for X < X0 and 0.58 otherwise; thus, these values were found to be marginally different (a Wilcoxon rank-sum test returned p = 0.02). This is consistent with BP and RP variations being more coherent when the optical emission is non-thermal and associated with one or several components downstream in the jet, possibly driving the optical centroid downstream at significant offsets from the radio centroid. Conversely, non-significant OR offsets can contain a contribution from the (bluer) disk, which causes BP to vary more independently from RP. Nevertheless, this assumption must be mitigated, as the shortest OR offsets can also arise from a sharp-peaked emission from the base of the jet or a point-like emission from the jet in the case of a very low viewing angle, which could be equivalent to the case of real large OR offsets. In all cases, the values of ρBP, RP remain, in median, relatively high (larger than or about 0.5) and are thus in favor of an unclear provenance of the optical.
A positive trend appeared between the normalized OR offset and ρG, G − RP. Sources with the shortest normalized OR offsets appeared to be preferably UWB, which can be understood in the context of an unclear provenance of the optical emission, as explained above. As the normalized OR offset increases and as the OR offset becomes “real”, the sources clearly go toward an expected BWB behavior. The median ρG, G − RP for X < X0 is 0.18, while it is 0.29 for X > X0, with a statistical significance well beyond 99.9%.
The BP/RP correlation ρBP, RP appears to be negatively correlated with Aell (for the three groups of all sources, the brightest sources, and significant ρBP, RP) and with Avar (but more marginally except for the brightest sources). A high Aell suggests an extended structure due to an active jet (generally with superluminal knots driving the radio centroid away from a mean position; see, e.g., Fey et al. 1997; Makarov et al. 2024). We found that such sources are more likely to have a relatively small ρBP, RP, suggesting an unclear optical provenance where the red contribution from the jet is mitigated by a blue contribution from the disk. This corresponds to sources with no significant OR offset (or low X). That said, these sources should also correspond to a low Avar, as the spatial variability has been found to be positively correlated with X (Lambert et al. 2024), which seems to be contradicted by the negative correlation coefficients in the upper-central plot of Fig. 2. Nevertheless, visual inspection of this plot also shows that the population of ρBP, RP that is close to zero or even negative is preferably at a low Avar, while there is less negative ρBP, RP at a higher Avar and Aell, which is consistent with the idea that low ρBP, RP are preferably associated with a low X, a low Avar, and a low Aell.
There is a marginal positive correlation of ρG, G − RP with Avar. This is consistent with previous studies, which positively correlated Avar and the normalized OR offset (Lambert et al. 2024), and in line with the hypothesis that BWB sources are more likely to present significant offsets and have a higher spatial variability. The trend of ρG, G − RP with Aell remains elusive except when selecting only the significant ρG, G − RP, for which we find a positive correlation in line with the positive correlation between ρG, G − RP and Avar.
Figure 3 reveals strong correlations of ρBP, RP and ρG, G − RP with several variables. First, both ρBP, RP and ρG, G − RP were deduced from photometric time series and could be biased toward the duration of the series, as a too-short series could undersample or miss jet flares and underestimate the variability. We detected a marginal correlation between ρBP, RP and ρG, G − RP and the length of the series in the sense that a longer series suggests an increased role of the jet, pushing the sources toward a higher ρBP, RP and ρG, G − RP (i.e., more BWB), which is consistent with the hypothesis that longer series have more chances to catch a flare and thereby better sample the jet activity. Nevertheless, these correlations remain marginal and need to be assessed with longer series from the next releases of the Gaia catalog, as they will allow one to compute more realistic values of ρBP, RP and ρG, G − RP.
As expected from the largest random systematic errors for high magnitudes, we found that ρBP, RP and ρG, G − RP are significantly biased toward fainter sources. Notably, there is a stagnation of ρG, G − RP close to zero beyond G ∼ 19, where it is likely that errors make the values meaningless. Figure 4 shows how the magnitude depends on the redshift, as high redshift sources tend to have a higher magnitude. This can be understood since these sources are farther. The fact that ρG, G − RP is smaller as the sources become fainter can result from a lack of sensitivity of Gaia for the weakest sources and an inability to catch the simultaneous variations in BP and RP. Another factor could be a selection bias of the sources that allows a luminous disk to be caught by Gaia, while sources with no luminous disk remain invisible if their jet is not sufficiently strong. Sources with a luminous disk, mostly FSRQs, are less likely to have coherent variations in BP and RP, as the bluer part of the spectrum is partly controlled by the disk. Such a selection bias is consistent with a median z and G of FSRQs in our sample of 1.12 and 18.7, respectively, while they are 0.46 and 17.8 for BL Lacs.
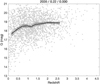 |
Fig. 4. Magnitude as function of the redshift. Each dot is one source. The thick, solid line represents the median values of G in bins of equal number of sources sorted by redshift. The shaded area represents the 95% confidence interval. The three numbers above the plots refer to, from left to right, the number of sources, the Spearman coefficient of the unbinned data and its p-value. |
The trend between ρBP, RP and ρG, G − RP and the redshift is consistent with similar comparisons in Berghea et al. (2021) and Makarov (2024) using a different sample and an independent photometric series. The redshift-ρBP, RP trend is monotonic, while the redshift-ρG, G − RP trend is negative for z < 1, and it shows a bump culminating between z = 1.5 and 2 (see Makarov 2024, and references therein).
As the jet inclination onto the line of sight was invoked in Secrest (2022) and Lambert & Secrest (2024) as the most important bias to explain the amplification of the variability at short OR distances and low Avar, we used estimates of the jet viewing angle from the maximum apparent speed of the jet features observed by the VLBA and Doppler factor derived from the observed brightness temperature by Homan et al. (2021) for 274 of our sources. We found a significant anticorrelation between the viewing angle and the fractional variability (ρ = −0.25, p < 0.001) that supports that short OR distances and low Avar are more likely to select blazars. Conversely, the correlation of the fractional variability with the Doppler factor and Lorentz factor is positive (ρ = 0.26, p < 0.001 and ρ = 0.18, p = 0.003, respectively). The correlation between ρBP, RP and the viewing angle appears not to be significant (p = 0.54), as well as with the Lorentz and Doppler factors. However, the color-magnitude correlation ρG, G − RP is positively correlated with the viewing angle (Fig. 5, upper panel) and negatively correlated with the Lorentz and Doppler factors, with ρ = −0.39 and −0.45, respectively, both with p < 0.001 and tending to values close to zero for lower viewing angles (i.e., UWB, as discussed above in the case of the correlation between ρG, G − RP and the normalized OR separation) and to positive values for higher viewing angles that reflect a BWB behavior typical of sources whose luminosity is dominated by their jet and associated with longer OR offsets. The Spearman coefficient between the viewing angle and Avar is 0.28 (p < 0.001). It is 0.14 (p < 0.001) between the viewing angle and the normalized offset (0.17 with the OR separation), thus supporting the hypothesis of the Doppler having a role in boosting the spatial variability and the OR offset.
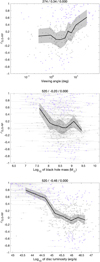 |
Fig. 5. Color-magnitude correlation ρG, G − RP as a function of the jet viewing angle (top), BH mass (middle), and the accretion luminosity (bottom). Each dot represents one source. Dots are purple if the p-value associated with ρ is lower than 0.05. The thick solid line represents the median values in bins with an equal number of sources. The shaded area represents the 95% confidence interval. The three numbers above the plots refer to, from left to right, the number of sources, the Spearman coefficient of the unbinned data, and its p-value. |
To check whether such astrometric parameters could also be influenced by the activity of the inner regions, we used black hole (BH) masses and accretion luminosities estimated by Paliya et al. (2021) for emission-line blazars from optical spectra while assuming that the broad line region (BLR) is virialized and the broad-line full width at half maximum represents the virial velocity. They are available for 520 of our sources. We found no convincing correlation between ρBP, RP and the BH mass. However, the BH mass is negatively correlated with the fractional variability (ρ = −0.22, p < 0.001) and ρG, G − RP (ρ = −0.20, p < 0.001) as is the accretion luminosity (ρ = −0.33 with the fractional variability and −0.46 with ρG, G − RP, both highly significant at more than 99.99%; see Fig. 5, middle and bottom panels). The most massive BHs and most luminous disks are apparently less variable in optical and are also UWB, while less massive BHs and less luminous disks are BWB and highly optically variable. An examination of the redshifts revealed that the most massive BHs and luminous disks are located at a higher z (positive Spearman ρ between z and the BH mass of 0.47 with p < 0.001), as already mentioned by Paliya et al. (2021). This dependence was interpreted as an observational bias, as the most massive and luminous systems are more likely to be detected at large distances. The sample for which we have the BH masses and accretion luminosities contains 422 FSRQs and 74 BL Lacs, which further bias the correlations toward the most luminous disks and more distant objects. The optical variability amplitude in a much larger selection of Gaia-CRF3 sources was found to be a steadily declining function of redshift in the G-band (Makarov 2024, their Fig. 7), although it becomes rather flat at z > 1. For the narrower RP and BP bands, this dependence appears to be of more complex undulating character. Narrow-band photometry is probably more sensitive to the contribution from bright lines, which move in and out of the spectral window with increasing redshift. Both the broad emission lines and the continuum component in the spectra of FSRQ sources show significant variability at various timescales, which are not coherent possibly due to a large time delay (Woo et al. 2013). The dichotomy of color variations may then be related to the spectral position of the dominant line. For example, a powerful Lyα line may be present in the BP band at z > 2.3 (but it further moves to RP at z > 4.3). A flare in this line would be associated with a BWB event, while the corresponding flare in the thermal continuum, which happened earlier, could be seen as a RWB or UWB event.
Now, let us consider what kind of manifestations can be expected from this general physical description in the observed astrometric parameters. Assuming that the radio centroid is close to the base of the jet, a luminous disk would pull the optical centroid down to the central region of the AGN and thereby closer to the radio centroid, leading to shorter values of OR separation. In this respect, we do find a correlation between the disk luminosity and the OR distance of −0.23 (p < 0.001). It is −0.11 (p < 0.001) between the OR distance and the BH mass. Nevertheless, we found no significant correlation of the normalized OR separation and the BH mass and a very marginal one with the accretion luminosity (ρ = −0.09, p = 0.05), thus reflecting the complex and involved relationship between the OR offsets and their standard errors that come from both VLBI and Gaia astrometry. As we expected, there is no correlation of the inner engine parameters with Avar that reflects the jet activity and is not straightforwardly connected with the inner regions.
4. Conclusions
We studied the trends in the BP/RP correlation and color-magnitude correlation with respect to astrometric parameters of interest for reference frame construction: the OR position offsets determined by sub-milliarcsecond absolute Gaia and VLBI astrometry and the astrometric variability in time determined by VLBI. We find that the “best” sources for realizing an OR reference frame (most astrometrically stable and with short OR link) are those that also have a low BP/RP correlation and a low color-magnitude (here between G and RP) correlation. The latter property corresponds to selecting UWB sources of spectral class FSRQ with z higher than about one. We have shown a clear correlation of both astrometric parameters and the color-magnitude correlation with the jet viewing angle, strengthening the hypothesis that the Doppler boosting effect on luminosity and geometry is at the origin of apparently short OR offsets and low spatial variability, as suggested by Secrest (2022) and Lambert & Secrest (2024). In addition, our study suggests that the OR offset is also correlated with the central engine parameters: short OR offsets occur in sources that contain the most massive BHs and most luminous accretion disks.
These results add additional possible predictors of reference frame candidate sources to the optical variability raised in previous studies. This work also demonstrates that a relatively short time span (a few years) and loose monthly sampling of the magnitude variations in blue and red are already sufficient to isolate trends and provide a good prediction of the optical radio offset (whose direct measurement otherwise needs heavy sub-milliarcsecond astrometry observations and analyses) and of the astrometric stability. Future releases of the Gaia catalog – if providing magnitude/flux time series over additional years – will be critical to tightening these conclusions. After the end of the Gaia mission, the task of monitoring AGN photometry in multi-band must not be discontinued, and it can be handled by ground-based telescopes with a relatively low cost. A small park of well-distributed automated instruments of 1-m class in both hemispheres would be sufficient to work alongside the geodetic VLBI network and other imaging facilities to maintain celestial reference frames and continue multiwavelength studies of AGNs, in line with recent and ongoing works merging absolute astrometry and traditional observations (e.g., Plavin et al. 2019; Sol et al. 2023; Lambert et al. 2024). Such facilities could also densify the photometric series toward higher rates in order to better apprehend whether the magnitude variability can also degrade the optical astrometric precision (Lindegren et al. 2012; Taris et al. 2018; Schwartzman et al. 2024) and obtain a more precise scheme to select blazars through the complex relation between astrometry, photometry, and the intrinsic nature of these objects.
Our study emphasizes the fact (previously discussed in the literature) that radio-loud quasars are complex, extended, and structured sources of light at the level of sub-milliarcsecond precision astrometry. This fact constitutes an unavoidable reality for the maintenance of a global celestial reference frame that is stable to 𝒪(10 μas) precision. It offers also an opportunity for studies of the intricate physical processes in the most powerful sources of radiation in the Universe. Combining ultra-precise methods of VLBI and optical astrometry and photometry allows for research that peeks deep into the central area of AGNs on the spatial scale of a few parsecs. In the classic Shakura & Sunyaev (1973) accretion disk model, the thermal radiation from the accretion disk is expected to be symmetric around the BH. VLBI astrometry is likely to pick up the sharpest peak in the distribution of surface radio flux, which is presumably within the jet closer to its base (though it exhibits frequency-dependent position shifts of tens to hundreds of μas). At the same time, the optical photocenters are often (but not always) found downstream of the radio jet direction, that is, further away from the BH along the jet direction than the radio core position. It can be proposed that the optical photocenter is dominated not by the disk but by the inner part of the rotating torus, where the jet interacts with the surrounding matter, and the even more extended BLR. The small viewing angles in combination with the significant self-absorption in the outlying gas-dust torus create an asymmetric distribution of optical flux with a photocenter at a considerable angular distance from the BH. Within this scenario, the optical position is frequency dependent as well. Gaia cannot perform astrometric measurements in the BP and RP bands to verify this prediction, but the correlations between magnitude and color changes and observed astrometric parameters found in this paper seem to be consistent with it. The ultimate test can be provided by a careful matching of VLBI astrometry time series and quasi-simultaneous optical light curves for selected individual quasars.
Main abbreviations used in this study are explicated in the Appendix.
Acknowledgments
We thank the reviewer, François Mignard, for his comments and suggestions that helped in improving this work. This work has made use of data from the European Space Agency (ESA) mission Gaia (https://www.cosmos.esa.int/gaia), processed by the Gaia Data Processing and Analysis Consortium (DPAC, https://www.cosmos.esa.int/web/gaia/dpac/consortium). Funding for the DPAC has been provided by national institutions, in particular the institutions participating in the Gaia Multilateral Agreement. This research has made use of the NASA/IPAC Extragalactic Database (NED), which is operated by the Jet Propulsion Laboratory, California Institute of Technology, under contract with the National Aeronautics and Space Administration.
References
- Abdollahi, S., Acero, F., Baldini, L., et al. 2022, ApJS, 260, 53 [NASA ADS] [CrossRef] [Google Scholar]
- Arias, E. F., Charlot, P., Feissel, M., & Lestrade, J. F. 1995, A&A, 303, 604 [NASA ADS] [Google Scholar]
- Berghea, C. T., Makarov, V. V., Quigley, K., & Goldman, B. 2021, ApJ, 162, 21 [Google Scholar]
- Blandford, R., Meier, D., & Readhead, A. 2019, ARA&A, 57, 467 [NASA ADS] [CrossRef] [Google Scholar]
- Charlot, P., Jacobs, C. S., Gordon, D., et al. 2020, A&A, 644, A159 [EDP Sciences] [Google Scholar]
- Eyer, L., Audard, M., Holl, B., et al. 2023, A&A, 674, A13 [NASA ADS] [CrossRef] [EDP Sciences] [Google Scholar]
- Fabricius, C., Luri, X., Arenou, F., et al. 2021, A&A, 649, A5 [NASA ADS] [CrossRef] [EDP Sciences] [Google Scholar]
- Feissel, M., & Mignard, F. 1998, A&A, 331, L33 [Google Scholar]
- Fey, A. L., Eubanks, M., & Kingham, K. A. 1997, AJ, 114, 2284 [CrossRef] [Google Scholar]
- Fey, A. L., Gordon, D., Jacobs, C. S., et al. 2015, AJ, 150, 58 [Google Scholar]
- Gaia Collaboration (Brown, A. G. A., et al.) 2016, A&A, 595, A2 [NASA ADS] [CrossRef] [EDP Sciences] [Google Scholar]
- Gaia Collaboration (Klioner, S. A., et al.) 2022, A&A, 667, A148 [NASA ADS] [CrossRef] [EDP Sciences] [Google Scholar]
- Gaia Collaboration (Vallenari, A., et al.) 2023, A&A, 674, A1 [NASA ADS] [CrossRef] [EDP Sciences] [Google Scholar]
- Gaur, H., Gupta, A. C., Strigachev, A., et al. 2012, MNRAS, 425, 3002 [NASA ADS] [CrossRef] [Google Scholar]
- Ghosh, K. K., Ramsey, B. D., Sadun, A. C., & Soundararajaperumal, S. 2000, ApJS, 127, 11 [NASA ADS] [CrossRef] [Google Scholar]
- Homan, D. C., Cohen, M. H., Hovatta, T., et al. 2021, ApJ, 923, 67 [NASA ADS] [CrossRef] [Google Scholar]
- Jovanović, M., Damljanovic, G., Taris, F., Gupta, A., & Bhatta, G. 2023, MNRAS, 525, 5928 [CrossRef] [Google Scholar]
- Kovalev, Y. Y., Petrov, L., & Plavin, A. V. 2017, A&A, 598, L1 [NASA ADS] [CrossRef] [EDP Sciences] [Google Scholar]
- Lambert, S., & Secrest, N. J. 2024, A&A, 684, A93 [NASA ADS] [CrossRef] [EDP Sciences] [Google Scholar]
- Lambert, S., Liu, N., Arias, E. F., et al. 2021, A&A, 651, A64 [NASA ADS] [CrossRef] [EDP Sciences] [Google Scholar]
- Lambert, S., Sol, H., & Pierron, A. 2024, A&A, 684, A202 [NASA ADS] [CrossRef] [EDP Sciences] [Google Scholar]
- Lindegren, L., Lammers, U., Hobbs, D., et al. 2012, A&A, 538, A78 [NASA ADS] [CrossRef] [EDP Sciences] [Google Scholar]
- Lindegren, L., Klioner, S. A., Hernández, J., et al. 2021, A&A, 649, A2 [EDP Sciences] [Google Scholar]
- Ma, C., Arias, E. F., Eubanks, T. M., et al. 1998, AJ, 116, 516 [Google Scholar]
- Makarov, V. V. 2024, ApJS, 274, 27 [CrossRef] [Google Scholar]
- Makarov, V. V., Frouard, J., Berghea, C. T., et al. 2017, ApJ, 835, L30 [Google Scholar]
- Makarov, V. V., Cigan, P., Gordon, D., et al. 2024, ApJ, 977, L14 [NASA ADS] [CrossRef] [Google Scholar]
- Malkin, Z. 2018, ApJS, 239, 20 [Google Scholar]
- McCall, C., Jermak, H., Steele, I. A., et al. 2024, MNRAS, 532, 2788 [NASA ADS] [CrossRef] [Google Scholar]
- Mignard, F., Klioner, S., Lindegren, L., et al. 2016, A&A, 595, A5 [NASA ADS] [CrossRef] [EDP Sciences] [Google Scholar]
- Negi, V., Joshi, R., Chand, K., et al. 2022, MNRAS, 510, 1791 [Google Scholar]
- Nothnagel, A., Artz, T., Behrend, D., & Malkin, Z. 2017, J, Geod., 91, 711 [NASA ADS] [CrossRef] [Google Scholar]
- Paliya, V. S., Domínguez, A., Ajello, M., Olmo-García, A., & Hartmann, D. 2021, ApJS, 253, 46 [NASA ADS] [CrossRef] [Google Scholar]
- Petrov, L., & Kovalev, Y. Y. 2017, MNRAS, 467, L71 [Google Scholar]
- Plavin, A. V., Kovalev, Y. Y., & Petrov, L. Y. 2019, ApJ, 871, 143 [Google Scholar]
- Prandini, E., & Ghisellini, G. 2022, Galaxies, 10, 35 [NASA ADS] [CrossRef] [Google Scholar]
- Schmidt, K. B., Rix, H.-W., Shields, J. C., et al. 2012, ApJ, 744, 147 [NASA ADS] [CrossRef] [Google Scholar]
- Schwartzman, E., Clarke, T. E., Nyland, K., et al. 2024, ApJ, 961, 233 [NASA ADS] [Google Scholar]
- Secrest, N. J. 2022, ApJ, 939, L32 [NASA ADS] [CrossRef] [Google Scholar]
- Shakura, N. I., & Sunyaev, R. A. 1973, A&A, 24, 337 [NASA ADS] [Google Scholar]
- Sol, H., Lambert, S., & Pierron, A. 2023, PoS, Gamma 2022, 095 [Google Scholar]
- Taris, F., Damljanovic, G., Andrei, A., et al. 2018, A&A, 611, 52 [Google Scholar]
- Urry, C. M., & Padovani, P. 1995, PASP, 107, 803 [NASA ADS] [CrossRef] [Google Scholar]
- Woo, S. C., Turnshek, D. A., Badenes, C., & Bickerton, S. 2013, MNRAS, 434, 1411 [NASA ADS] [CrossRef] [Google Scholar]
- Zhang, B.-K., Zhou, X.-S., Zhao, X.-Y., & Dai, B.-Z. 2015, RAA, 15, 1784 [NASA ADS] [Google Scholar]
- Zhang, B.-K., Zhao, X.-Y., & Wu, Q. 2022, ApJS, 259, 49 [CrossRef] [Google Scholar]
Appendix A: Abbreviations
We list here the main abbreviations used in this study.
| AGN | Active galactic nucleus |
| BL Lac | Beta Lacertae-type object |
| BP/RP | Gaia’s blue and red photometer magnitudes |
| BWB | Bluer-when-brighter |
| FSRQ | Flat Spectrum Radio Quasar |
| ICRF | International celestial reference frame |
| OR | Optical-radio |
| RWB | Redder-when-brighter |
| UWB | Unchanged-when-brighter |
All Figures
|
Fig. 1. Distribution of BP/RP correlation ρBP, RP and color-magnitude correlation ρG, G − RP for all sources (gray) and for p-values lower than 0.05 (blue). In pink is the distribution of 307317 Gaia-CRF3 sources brighter than G = 19.6 from Makarov (2024) normalized to the maximum value of the gray histogram. |
| In the text | |
|
Fig. 2. BP/RP correlation ρBP, RP and color-magnitude ρG, G − RP correlations as functions of the normalized OR offsets X, the astrometric variability Avar and ellipticities Aell. Each dot represents one source. Dots are purple if the p-value associated with ρ is lower than 0.05. The thick, solid lines represent the median values of ρ in bins of equal number of sources for all sources (black), source whose G < 19 (green), and sources whose ρ has a p-value lower than 0.05. The shaded area represents the 95% confidence interval. The three numbers above the plots refer to, from left to right, the number of sources, the Spearman coefficient of the unbinned data and its p-value. |
| In the text | |
|
Fig. 3. BP/RP correlation ρBP, RP and color-magnitude ρG, G − RP correlations as functions of the series length, G magnitude, and the redshift. Each dot represents one source. Dots are purple if the p-value associated with ρ is lower than 0.05. The thick, solid line connects the median values of ρ computed for bins of equal number of sources sorted by the corresponding abscissa values. The shaded area represents the 95% confidence interval of the overall sample distribution. The three numbers above the plots refer, from left to right, to the number of sources, the Spearman coefficient of the unbinned data and its p-value. |
| In the text | |
|
Fig. 4. Magnitude as function of the redshift. Each dot is one source. The thick, solid line represents the median values of G in bins of equal number of sources sorted by redshift. The shaded area represents the 95% confidence interval. The three numbers above the plots refer to, from left to right, the number of sources, the Spearman coefficient of the unbinned data and its p-value. |
| In the text | |
|
Fig. 5. Color-magnitude correlation ρG, G − RP as a function of the jet viewing angle (top), BH mass (middle), and the accretion luminosity (bottom). Each dot represents one source. Dots are purple if the p-value associated with ρ is lower than 0.05. The thick solid line represents the median values in bins with an equal number of sources. The shaded area represents the 95% confidence interval. The three numbers above the plots refer to, from left to right, the number of sources, the Spearman coefficient of the unbinned data, and its p-value. |
| In the text | |
Current usage metrics show cumulative count of Article Views (full-text article views including HTML views, PDF and ePub downloads, according to the available data) and Abstracts Views on Vision4Press platform.
Data correspond to usage on the plateform after 2015. The current usage metrics is available 48-96 hours after online publication and is updated daily on week days.
Initial download of the metrics may take a while.