| Issue |
A&A
Volume 684, April 2024
|
|
|---|---|---|
| Article Number | A93 | |
| Number of page(s) | 8 | |
| Section | Celestial mechanics and astrometry | |
| DOI | https://doi.org/10.1051/0004-6361/202348842 | |
| Published online | 09 April 2024 | |
VLBI position variability of AGNs is inversely correlated with their photometric variability★
1
SYRTE, Observatoire de Paris – Université PSL, CNRS, Sorbonne Université, LNE,
75014
Paris, France
e-mail: This email address is being protected from spambots. You need JavaScript enabled to view it.
2
U.S. Naval Observatory,
3450 Massachusetts Ave NW,
Washington, DC
20392, USA
Received:
5
December
2023
Accepted:
3
February
2024
Abstract
Aims. The stability of the International Celestial Reference Frame (ICRF), realized through geodetic very long baseline interferometry (VLBI) positions of thousands of extragalactic objects, is dependent on the individual positional stability of these objects. It has been recently shown that the prevalence of offsets between the VLBI positions of ICRF objects and their Gaia optical positions, which limit the optical-radio reference frame tie, is inversely correlated with optical photometric variability, suggesting that photometrically variable objects may be more positionally stable. In this work, we determine the relationship between VLBI position stability of ICRF objects and optical-radio position offsets as well as optical photometric variability.
Methods. We created multi-epoch geodetic VLBI solutions for a sample of 520 ICRF sources that have sufficient data to determine the variability in their VLBI positions over time. We compared this position variability with the fractional photometric variability provided by the Gaia extragalactic source catalog, the Gaia-ICRF optical-radio position offsets, the uncertainty-normalized position offsets, and optical BP-RP color as well as with possible confounders such as optical magnitude, VLBI/Gaia position error, and redshift. We determined the relationship between VLBI position stability and γ-ray detection by the Fermi Large Area Telescope (LAT), and we determined how the VLBI position and optical flux variabilities correlate with the spectral classification of our sample, considering flat spectrum radio quasars (FSRQs), quasi-stellar objects, BL Lacs, Seyfert, and gigahertz-peaked spectrum radio sources or compact-steep-spectrum radio sources.
Results. We found that VLBI astrometric variability is (i) negatively correlated with optical flux variability, (ii) positively correlated with optical-radio offsets, (iii) negatively correlated with optical color index BP-RP, and (iv) negatively correlated with γ-ray detection. We also found that the most positionally stable sources are among the FSRQ and BL Lac classes. In other words, redder, photometrically variable sources have the most stable VLBI positions, the smallest optical-radio position offsets, and the highest rate of γ-ray detection, and these sources tend to be spectrally classified as blazars.
Conclusions. Our results are consistent with the most positionally stable sources being blazars, a class of object in which the jet is oriented close to the line of sight and where relativistic beaming increases photometric variability and minimizes the projected offset between the optical and radio positions. Our study should therefore orient future geodetic VLBI observing programs preferentially toward sources with high photometric variability because these sources are predicted to have better VLBI position stabilities and smaller optical-radio position offsets, improving the stability of the celestial reference frame axes.
Key words: techniques: interferometric / catalogs / reference systems / quasars: general
Full Table 1 is available at the CDS via anonymous ftp to cdsarc.cds.unistra.fr (130.79.128.5) or via https://cdsarc.cds.unistra.fr/viz-bin/cat/J/A+A/684/A93
© The Authors 2024
 Open Access article, published by EDP Sciences, under the terms of the Creative Commons Attribution License (https://creativecommons.org/licenses/by/4.0), which permits unrestricted use, distribution, and reproduction in any medium, provided the original work is properly cited.
This article is published in open access under the Subscribe to Open model. This email address is being protected from spambots. You need JavaScript enabled to view it. to support open access publication.
1 Introduction
Modern astrometry and geodesy rely on a global celestial reference frame based on the positions of thousands to millions of compact extragalactic objects at gigaparsec distances where their peculiar motions (typically of a few nanoseconds of arc per year for a moderate redshift) are undetectable with current technology. These “ideal” reference points are active galactic nuclei (AGN) hosting a supermassive black hole surrounded by an optical- and UV-luminous accretion disk from which large jets of relativistic plasma sometimes emerge and are observed brightly at radio wavelengths (e.g., Padovani et al. 2017; Blandford et al. 2019). The international celestial reference system (ICRS; Arias et al. 1995; Feissel & Mignard 1998) is an ideal, quasi-inertial reference system that is realized by the positions of these extra-galactic objects. It is developed and maintained by international teams of astrometrists and geodesists, with the objective being to improve the precision and accuracy of the celestial reference frame to as low as one millimeter in position at the Earth surface and, equivalently, a few microseconds of arc (µas) in angle on the sky. The practical realization of the ICRS at radio wavelengths is the International Celestial Reference Frame (ICRF), which is based on the absolute positions of AGN determined by very long baseline radio interferometry (VLBI) in geodetic mode, while the realization of the ICRS at visual wavelengths (optical) is Gaia-CRF, developed since 2016 by the European Space Agency (ESA) Gaia astrometry mission (Prusti et al. 2016). The current radio realization of the ICRF (ICRF3; Charlot et al. 2020) was released in 2018. It is based on 40 yr of VLBI observations, mostly operated by the International VLBI Service for Geodesy and Astrometry (IVS; Nothnagel et al. 2017), and it contains positions for 4536 sources at 8 GHz (X band), 824 sources at 24 GHz, and 678 sources at 32 GHz. Gaia-CRF3 (Gaia Collaboration 2022) is based on 34 months of observations and is centered in the Gaia G band (~600 nm).
Both have a comparable median per-source position precision of 0.2 milliarcseconds.
The co-existence of radio and optical AGN catalogs with comparable precision creates several challenges for the celestial reference frame that are likely astrophysical in nature. Immediately after the publication of the first two releases of Gaia, several independent studies confirmed the existence of significant optical-radio angular offsets – up to several milliarcseconds – that are likely not purely due to statistical errors or observational systematics (Mignard et al. 2016, 2018; Petrov & Kovalev 2017; Petrov et al. 2018). For example, for sources in which extended radio structures are found in VLBI imaging, the position angles of these structures, presumably jets, are often found to correlate with the position angles of optical-radio offsets (Kovalev et al. 2017; Petrov & Kovalev 2017; Petrov et al. 2019; Plavin et al. 2019). Understanding the mechanisms that create these offsets is therefore crucial to not only improving the tie between radio and optical reference frames but also better understanding AGN accretion physics. In addition, VLBI positions, radio fluxes, and optical fluxes are variable in time, raising the question as to how flux variability affects the stability of the ICRS axes. The VLBI positional variability reflects the evolution of the source structure (e.g., Fey et al. 1997; Feissel et al. 2000; MacMillan & Ma 2007; Gattano et al. 2018) and can reach several hundred microarcseconds per year, while the Gaia fluxes are subject to variations of several tenths of a magnitude on sub-annual to inter-annual timescales (Carnerero et al. 2022). A crucial question for the maintenance of the ICRF is how to manage a reference frame defined by reference points that exhibit apparent motions (in radio) and have both frequency-dependent locations and variable flux (both in radio and in optical).
A step forward in understanding and mitigating the optical-radio position offset problem was made by Secrest (2022), who demonstrated that the optical flux variability of objects in the ICRF is anticorrelated with their optical-radio offsets. Secrest (2022) further showed that the most highly flux-variable objects, those with Gaia fractional variability Fvar > 0.4, are predominantly blazars, indicating that jet geometry and beaming with respect to the observer likely underpins this result. Given that the reduction in the prevalence of significant optical-radio position offsets between the most and least flux-variable objects was found to be nearly an order of magnitude, this result provides a means of optimally selecting VLBI targets as well as potentially weighting their contribution to the optical-radio reference frame link by their flux variability. In this work, we complement Secrest (2022) by analyzing the VLBI positional variability, which is a pragmatic condition for the stability of the ICRF axes.
2 Data and methods
We started with the 4536 objects in the S/X-band ICRF3 (Charlot et al. 2020), which have source positions defined at the geodetic X-band (8.4 GHz), and we cross-matched these to Gaia DR3 using a tolerance of 0″.1. Following Gaia Collaboration (2022), we excluded matches whose parallax and proper motion is uncertain by selecting sources with five- or six-parameter astrometric solutions. We also excluded sources whose parallax does not satisfy Eqs. (2) and (3) of Gaia Collaboration (2022) as well as sources whose optical-radio offset could be due to a bad astrometry. The latter are sources presenting multiple peaks in the Gaia scanning window, significant astrometric excess noise (significance larger than two), and a photometric BP/RP excess factor larger than two, which indicates a source extent that can cause spurious astrometric motions (Souchay et al. 2022; Makarov & Secrest 2022). This left 2436 sources. Geodetic VLBI positions were calculated with full covariances, allowing the error ellipse to be determined. Similarly, we calculated the error ellipse semimajor axes for the Gaia positions, although the uncertainties are not likely to be underestimated by more than about 6% (e.g., Secrest 2022). We then formed the arc length between the radio position and its optical counterpart as the quadratic sum of coordinate differences in right ascension and declination. Using the arc length directly as an astrometry parameter could be misleading since the optical-radio separation of a substantial number of sources is explained by the positional error (see, e.g., Fig. 14 of Gaia Collaboration 2022). Instead, we used the uncertainty-normalized separation computed with formulas (4) and (5) of Mignard et al. (2016) that account for correlations between right ascension and declination estimates, as was done in previous works on optical-radio offsets.
The astrometric variability of source positions observed by VLBI can result from several causes. The mismodeling of the troposphere associated with network deficiencies (e.g., size, asymmetry) creates baseline-dependent errors that can produce apparent shifts of the source position from one session to another. Additionally, the presence of an extended structure – generally a core-jet shape with a dominant component – creates an additional term in the group delay (structure delay, see, e.g., Charlot 1990) that produces a shift of the reference point in the direction of the jet with respect to its base. This term is not accounted for in the geodetic VLBI catalog positions. As the structure of the source evolves with time, on timescales of a few months to several years, it results in an apparent change of the source position (e.g., Fey et al. 1997; MacMillan & Ma 2007; Gattano et al. 2018; Gattano & Charlot 2021).
We used coordinate time series for 4616 radio sources between 1979 and 2023 obtained from four VLBI global solutions using state-of-the-art modeling of the delay. In each of the four solutions, one-fourth of the source coordinates were estimated as session parameters, while the remaining three-fourths of the source coordinates were estimated as global parameters (see, e.g., Lambert 2013; Fey et al. 2015). For each solution, a no-net rotation constraint was applied to the ICRF3, defining sources whose coordinate is estimated globally (Charlot et al. 2020), that is, three-fourths of the full set of 303 defining sources. In the resulting time series, we eliminated outliers defined as points beyond five times the scaled median absolute deviation. This amounted to about 2% of the data and is likely due mainly to small networks, as suggested by Malkin (2009), who showed that the precision and accuracy of Earth orientation parameters was primarily connected to the network volume, although other factors also contributed to a lesser extent, such as data rate. For consistency with ICRF3, we inflated the formal errors on the positions by a scale factor of 1.5 and a noise floor of 30 µas added in quadrature. The astrometric variability Avar of a source can be defined in several ways. The simplest way is to take the overall standard deviation as the quadratic sum of the squared standard deviation in both coordinates (Fey et al. 2015; Lambert 2013). Since this ignores the possible correlation between right ascension and declination over time, often associated with the jet direction (Gattano & Charlot 2021), we suggest using the dispersion along the semi-major axis of the confidence ellipse computed as the main eigenvalue of the covariance matrix. Thus,
 (1)
(1)
where υα cos δ and υδ are the variance of a series in α cos δ and δ, respectively, and υα cos δ,δ is the covariance, all of which are computed using data uncertainties. To avoid a poorly constrained Avar, we only kept time series with at least ten position data points. This reduced the sample to 849 “well-observed” sources.
The Gaia fractional variability Fvar used in this study is the fractional_variability_g quantity calculated for quasi-stellar object (QSO) candidates in Gaia DR3 (Carnerero et al. 2022) and is computed as the square root of the fractional excess variance taking into account the measurement uncertainties. It is available, as are the G magnitude and color index GBP − GRP (hereafter BP-RP), for 520 sources of our previous sample. These 520 sources constitute our final sample. Gaia G magnitudes and BP-RP were corrected from the Galactic extinction using the Planck Collaboration XI (2014) dust map for E(B-V) and the extinction coefficients from Wang & Chen (2019). Additionally, we considered the spectral classes and redshift (the latter being available for 498 sources, of which 463 are spectroscopic and 35 obtained by a method not clearly stated in the publication) from the NASA/IPAC extragalactic database (NED). Our sample contains 400 flat spectrum radio quasars (FSRQs), 54 QSOs, 14 BL Lacs, six Seyfert galaxies of type 1 or 2, seven gigahertz-peaked spectrum radio sources (GPS), and five compact-steep-spectrum radio sources (CSS). Thirty-six objects are of unknown type. The factor of 30 between the number of FSRQs and BL Lacs, both blazar types, could result from an observational bias arising from more optically luminous FSRQs at higher redshift being more common above the Gaia-limiting magnitude of ~ 21 than less luminous BL Lacs at lower redshift.
The full table of 520 sources with associated quantities described above and used below is available at the CDS. A brief sample is shown in Table 1.
Data used in this study (first ten rows; the full table is available at CDS).
3 Results and interpretation
Figure 1 displays the Gaia fractional flux variability Fvar versus the VLBI astrometric variability Avar, using bins of 20 sources each and displaying the 95% confidence interval. The statistical dependence between quantities was evaluated using Spearman’s rank correlation coefficient ρ, allowing non-linear monotonic dependence. The associated p-values give the probability of obtaining the value of ρ under the null hypothesis of two independent Gaussianly distributed data sets. The Spearman coefficients and p-values were calculated for the unbinned data and are indicated over the plot. In Fig. 2, we show similar binning for the total and normalized optical-radio offsets, Gaia G magnitude, BP-RP color index, VLBI and Gaia positional error (error ellipse semi-major axis), and redshift as functions of Avar and Fvar. Our main findings are as follows.
The VLBI astrometric variability exhibits a significant anticorrelation with the optical flux variability. Sources exhibiting notable geodetic VLBI position variability tend to have low fractional flux variability at optical wavelengths, and the most positionally stable sources in geodetic VLBI observations tend to be more photometrically variable. The correlation coefficient for binned data is significant, at better than 99.9%, rejecting the null hypothesis that there exists no monotonic relation between the astrometric variability in radio and the flux variability in the optical. A Kendall τ test, which measures the rank correlation between two variables, gave a p-value of 10−6 for the hypothesis that VLBI astrometric variability and optical flux variability are uncorrelated, the same p-value found by Secrest (2022) for the relationship between normalized optical-radio offset prevalence and fractional flux variability.
The VLBI astrometric variability is significantly correlated (statistical significance better than 99.9%) with the optical-radio offsets (both total and normalized). The most positionally stable sources in geodetic VLBI observations are also those that present the smallest – or the least significant – optical-radio offsets.
The VLBI astrometric variability is significantly anticorrelated with the optical color index BP-RP. Sources with low astrometric variability are redder. The unbinned correlation is straightforwardly significant at 99.9%, rejecting the null hypothesis of no monotonic relation between the radio astrometric variability in the optical color index. This result is consistent with that found by Secrest (2022), who showed that the most highly optically flux-variable objects have a similarly redder optical color.
These findings are in line with a population of blazars with a jet inclination close to the line of sight. The optically thin region of the jet points into the line of sight and is boosted by Doppler beaming, pulling the optical centroid away from the stationary accretion disk into the relativistic jet and increasing its apparent optical variability as well as changing its optical color. The geometric projection additionally makes the optical centroid appear close to the peak of the radio emission, further reducing any physical optical-radio offset to small apparent values. Similarly, any extended radio structure would also be seen as being closer to the central regions, making the structure appear more compact and with less impact on the astrometric position. Such sources would therefore appear as spatially stable when observed with geodetic VLBI but photometrically variable, explaining the anticorrelation between Fvar and Avar; the positive correlation between normalized optical-radio offsets and Avar; and, as shown in Secrest (2022), the dramatically reduced prevalence of significant optical-radio offsets in objects with high Fvar. Such sources dominated by the activity of the jet also appear redder, as the jet is redder than the disk, thereby explaining the anticorrelation between BP-RP and Avar. Indeed, Secrest (2022) showed that the redder colors of ICRF sources with high flux variability are consistent with the spectral energy distributions of blazars (Ghisellini et al. 2017) with typical γ-ray luminosities between 1046 and 1047 erg s−1, while the bluer colors of the more flux-stable ICRF sources are consistent with the observed colors of radio-quiet quasars. Conversely, sources exhibiting larger optical-radio offsets have jets pointed further away from the line of sight, decreasing relativistic Doppler boosting so that the optical centroid is closer to the accretion disk. The VLBI position corresponds to the brightest peak in the extended radio jet, which has a projected separation further from the accretion disk and experiences positional variability due to superluminal motion and stochastic changes within the jet structure.
To test for the effect of confounding variables that could skew the interpretation of our results, Fig. 3 displays the dependencies of Avar and Fvar on the apparent G magnitude, VLBI, and Gaia formal position uncertainties and redshift. The correlation between VLBI astrometric variability and optical magnitude is marginally significant (p = 0.012), but the explanatory power of G is low, and the range of the mean Avar value with G is only ~0.1 mas. Secrest (2022) found that the minimum detectable Gaia fractional flux variability shows nearly no dependence on G magnitude for ICRF objects, mitigating concerns about bias. Nevertheless, we quantified this finding. There is a significant positive dependence of Fvar on G (p = 0.000), but the range of mean Fvar is about ~0.1 for all values of G, so while fainter objects are less likely to be recorded with low values of Fvar, the magnitude of the bias is indeed small compared to that of the range of Fvar relevant to our results.
Despite a mild selection bias toward fainter G, the most photometrically variable sources are preferentially at lower redshifts at high significance (p = 0.000). Whether this is an evolutionary effect, a selection effect due to the (1 + z) time dilation of cosmologically distant sources, or some other mechanism, we note that this means that objects with large Fvar have smaller angular size distances, so they are biased toward larger – and more easily detected – astrometric variability for a given physical position dispersion. The observed inverse correlation between Fvar and astrometric variability is therefore likely to be somewhat underestimated, further underscoring the power of photometric variability in selecting astrometrically stable sources.
Additionally, we found a positive correlation between Avar and the VLBI positional (formal) error, in line with the fact that VLBI catalog errors obtained after global inversion of data over a certain time span are sensitive to intrinsic dispersion of the VLBI position variability over the same time span. However, the Gaia position error appears to not depend on Avar, and it weakly (if at all) depends on Fvar, likely due to the different natures of the emission processes (including the disk and the jet) depending on the jet orientation angle. For a jet oriented toward the observer, the optical will be affected by the boosted jet emission (high Fvar), but the low astrometric variability of the jet (low Avar) would poorly affect the Gaia position and error. Finally, there may be some residual systematic effect of photometric variability on the optical position determination, but the trend remains too small to be considered in this study (a mean Fvar difference of ~0.05 over two orders of magnitude in position error).
To further confirm that our results can be interpreted as bona fide line-of-sight blazars with the most stable astrometric positions, we examined the relationship between Avar and γ-ray detection by Fermi-LAT by matching our sample to 4FGL-DR3 (Abdollahi et al. 2022). We found a highly significant (p = 0.000) inverse correlation between VLBI astrometric variability and γ-ray detection, with the most astrometrically stable objects approaching a nearly ~100% detection rate (Fig. 4). This is consistent with the results of Secrest (2022), who found that by progressively cutting on higher Fvar, the fraction of ICRF objects with γ-ray detection approaches 100% (their Fig. 5). As noted in Secrest (2022), this provides further strong evidence that blazars have the most stable astrometric positions.
Finally, Fig. 5 shows the joint distributions of Avar, Fvar, optical-radio offsets, and normalized optical-radio offsets color coded by the main spectral classes. The center of the crosses indicates the median value, and error bars were computed as the standard error of the median. The figure reveals that the most astrometrically stable objects (low Avar) are the group of blazars formed by BL Lacs and FSRQs, the latter sub-group falling within the error bars of the former. Conversely, BL Lacs are also the most variable in magnitude (upper-left panel of Fig. 5). This is consistent with objects having, for both types, strong non-thermal activity (emitting in both radio and optical) boosted by a weakly inclined jet onto the line of sight. For FSRQs, the optical variability is mitigated by the less variable, bluer thermal emission from the accretion disk, placing the FSRQ group at lower Fvar than the BL Lac group.
If the FSRQs and BL Lacs are both genuine line-of-sight blazars, determining if they are equally astrometrically stable is worthwhile, as the lower photometric variability of FSRQs may be observationally preferable. We found that FSRQs and BL Lacs have statistically indistinguishable VLBI astrometric variability, with means of (0.41 ± 0.02) mas versus (0.38 ± 0.07) mas, where the uncertainties are the standard errors of the means and the differences have p-values of >0.25 when using the k-sample Anderson-Darling test. Interestingly, however, FSRQs possibly have a lower normalized optical-radio offset than BL Lacs, with a mean value of 3.7 ± 0.3 versus 5.0 ± 0.9; nevertheless, the significance is modest (p = 0.007), likely due to the small number of BL Lacs in our sample (14).
As it may be of interest to predict the VLBI position dispersion Avar from the optical-radio offsets, given that the latter is much less observationally expensive, we fit Avar as a function of optical-radio offset, here denoted as dOR:
 (2)
(2)
where fitting logarithmically is motivated by the power-law trend seen in Fig. 2. Using flat priors and a Gaussian likelihood, we sampled the posteriors of the slope a1, intercept a0, and the intrinsic scatter σintr using EMCEE (Foreman-Mackey et al. 2013). We found a1 = 0.14 ± 0.02; a0 = −0.37 ± 0.02 dex; and σintr = 0.23 ± 0.01 dex, where the uncertainties are 16%/84%. The slope and intercept have a correlation coefficient of +0.75, while the intrinsic scatter is effectively uncorrelated with the other two parameters.
We emphasize that the above relation is for the full sample. Given the relationships we have demonstrated between Avar, the optical-radio offset, and Fvar, we might have expected that the correlation between Avar and dOR would be strongest at the lowest values of Fvar, as these are the least blazar-like objects. Indeed, we found that there is a monotonic increase of the Spearman ρ correlation coefficient down to Fvar < 0.05, where it peaks at ρ = 0.54 (p = 0.000). The trend reaches a minimum and flattens for Fvar > 0.4, which is expected if objects above this threshold are nearly all bona fide blazars, as suggested by the results of Secrest (2022). For the most photometrically constant objects, those with Fvar < 0.05, we found a1 = 0.31 ± 0.05; a0 = −0.26 ± 0.03 dex; and  dex, with a correlation coefficient between a1 and a0 of +0.70 and with σintr again uncorrelated with the other two parameters. These coefficients provide a scaling between the VLBI position dispersion and the optical-radio offset for AGN in which the jet is not pointed into the line of sight.
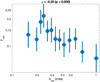 |
Fig. 1 Radio astrometric variability Avar versus the optical fractional variability Fvar in bins comprising 20 sources each. For each bin, the dot represents the mean value. Error bars are 95% confidence intervals. ρ refers to the Spearman ρ coefficient of the unbinned data and its p-value. |
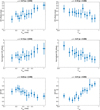 |
Fig. 2 Optical-radio (OR) offsets and color index BP-RP as functions of the astrometric variability Avar and the optical variability Fvar in bins comprising 20 sources each. For each bin, the dot represents the mean value. Error bars are 95% confidence intervals. Above each plot, ρ refers to the Spearman ρ coefficient of the unbinned data and its p-value. |
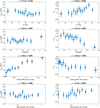 |
Fig. 3 Aval and Fvar as functions of the magnitude, position error, and redshift in bins comprising 20 sources each. For each bin, the dot represents the mean value. The error bars are 95% confidence intervals. Above each plot, ρ refers to the Spearman ρ coefficient of the unbinned data and its p-value. |
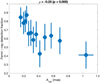 |
Fig. 4 Radio astrometric variability Avar versus fraction of objects detected by Fermi-LAT (4FGL DR3) in bins comprising 20 sources each. For each bin, the dot represents the mean value. The error bars are 95% confidence intervals. The ρ refers to the Spearman ρ coefficient of the unbinned data and its p-value. |
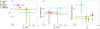 |
Fig. 5 Mean loci of optical-radio offsets and color index as functions of Avar and Fvar following the spectral class. The error bars are 95% confidence intervals. |
4 Conclusions
We have determined the geodetic VLBI positional dispersions for 520 objects in ICRF3 with sufficient VLBI data and Gaia counterparts. We compared the VLBI astrometric variability with the fractional photometric variability from Gaia, finding that the most photometrically variable objects have the most stable VLBI positions. Similarly, we found that VLBI position variability is positively correlated with optical-radio position offset and negatively (inversely) correlated with optical color. Additionally, we found that VLBI position stability is correlated with γ-ray detection by Fermi-LAT, with the most astrometrically stable objects having a ~100% γ-ray detection rate.
These findings are most likely the result of the most astrometrically stable positions being blazars, a class of object characterized by strong and rapid photometric variability due to a relativistically beamed jet pointed into our line of sight. This interpretation is supported both by the correlation between astrometric stability and γ-ray detection and by comparison to the NED-derived AGN spectral class, which shows BL Lacs and FSRQs dominate the population of astrometrically stable objects. Though FSRQs and BL Lacs both have a similar astrometric stability compared to the other AGN spectral classes, FSRQs may be preferable, as they possibly exhibit smaller normalized optical-radio offsets on average and present a lower optical variability. As also argued by Secrest (2022), our study therefore suggests that the observing effort for improving the future celestial reference frame should be oriented toward bona fide blazars, with FSRQs possibly taking priority over BL Lacs.
The results of Secrest (2022) suggest that VLBI source selection and observing preference should incorporate photometric variability information, as the most photometrically variable objects have the fewest significant optical-radio position offsets. We complement that work by adding the VLBI positional variability, which is a pragmatic condition for the stability of the ICRF axes: the most stable source for VLBI geodesy and astrometry should be chosen among the shortest optical-radio offsets and optically variable sources. Our results suggest that both Fvar and Avar measurements can be used to predict normalized or total optical-radio offsets, with the difference being that Fvar somewhat better predicts the uncertainty-normalized offset (Spearman ρ = −0.21 vs. 0.14), while Avar somewhat better predicts the total offset (Spearman ρ = 0.27 vs. −0.16). In practice, however, Fvar is likely preferable for selecting astrometrically stable sources because the photometric variability of sources can be measured quickly – possibly in just a few hours for rapidly varying blazars – while VLBI astrometric variability takes years or decades to measure and is vastly more observationally expensive. For this reason, the Fvar-based study carried out by Secrest (2022) was able to use four times more objects than the Avar-based study we carried out here, despite Fvar being based on a relatively sparse sampling of photometric measures by Gaia over a few years of mission time.
Given the results of this work, systematic monitoring of the photometric variability of VLBI sources – a task than can be realized from ground-based robotic telescopes for example – and follow-up by VLBI networks on objects with blazar-like variability are clearly an observational priority for the celestial reference frame. While many catalogs of variable AGN have been published, these are typically composed of a few hundred AGN, often from narrow, select fields. Large, multi-epoch catalogs other than Gaia exist at optical wavelengths (e.g., the Zwicky Transient Survey; Masci et al. 2019) as well as in the infrared (NEOWISE-R; Mainzer et al. 2014), and they can certainly be leveraged to maximize the number of VLBI sources identified as bona fide blazars. These catalogs have varying but often sparse observing cadences that may miss blazar flaring events, which can occur between periods of relative quiescence (e.g., Angelakis et al. 2019). while blazars “caught” in the general time domain surveys via photometric variability are reliable, there is likely to be a significant population of bona fide blazars that are indiscernible with the current data. Dedicated monitoring of VLBI sources – at a baseline and cadence optimized for blazar detection – would therefore be a valuable observation program for the celestial reference frame and for blazar studies more generally.
Acknowledgements
We thank the anonymous referee for comments and suggestions that helped in improving this work. This work has made use of data from the European Space Agency (ESA) mission Gaia (https://www. cosmos.esa.int/gaia), processed by the Gaia Data Processing and Analysis Consortium (DPAC, https://www.cosmos.esa.int/web/gaia/dpac/consortium). Funding for the DPAC has been provided by national institutions, in particular the institutions participating in the Gaia Multilateral Agreement. This research has made use of the NASA/IPAC Extragalactic Database (NED), which is operated by the Jet Propulsion Laboratory, California Institute of Technology, under contract with the National Aeronautics and Space Administration.
References
- Abdollahi, S., Acero, F., Baldini, L., et al. 2022, ApJS, 260, 53 [NASA ADS] [CrossRef] [Google Scholar]
- Angelakis, E., Fuhrmann, L., Myserlis, I., et al. 2019, A&A, 626, A60 [NASA ADS] [CrossRef] [EDP Sciences] [Google Scholar]
- Arias, E. F., Charlot, P., Feissel, M., & Lestrade, J.-F. 1995, A&A, 303, 604 [Google Scholar]
- Blandford, R., Meier, D., & Readhead, A. 2019, ARA&A, 57, 467 [NASA ADS] [CrossRef] [Google Scholar]
- Carnerero, M. I., Raiteri, C. M., Rimoldini, L., et al. 2022, A&A, 674, A24 [Google Scholar]
- Charlot, P. 1990, AJ, 99, 1309 [Google Scholar]
- Charlot, P., Jacobs, C. S., Gordon, D., et al. 2020, A&A, 644, A159 [EDP Sciences] [Google Scholar]
- Feissel, M., & Mignard, F. 1998, A&A, 331, L33 [Google Scholar]
- Feissel, M., Gontier, A. M., & Eubanks, T. M. 2000, A&A, 359, 1201 [NASA ADS] [Google Scholar]
- Fey, A. L., Eubanks, M., & Kingham, K. A. 1997, AJ, 114, 2284 [CrossRef] [Google Scholar]
- Fey, A. L., Gordon, D., Jacobs, C. S., et al. 2015, AJ, 150, 58 [Google Scholar]
- Foreman-Mackey, D., Hogg, D. W., Lang, D., et al. 2013, PASP, 125, 306 [NASA ADS] [CrossRef] [Google Scholar]
- Gaia Collaboration (Klioner, S. A., et al.) 2022, A&A, 667, A148 [NASA ADS] [CrossRef] [EDP Sciences] [Google Scholar]
- Gattano, C., & Charlot, P. 2021, A&A, 648, A125 [NASA ADS] [CrossRef] [EDP Sciences] [Google Scholar]
- Gattano, C., Lambert, S. B., & Le Bail, K. 2018, A&A, 618, A80 [NASA ADS] [CrossRef] [EDP Sciences] [Google Scholar]
- Ghisellini, G., Righi, C., Costamante, L., et al. 2017, MNRAS, 469, 255 [NASA ADS] [CrossRef] [Google Scholar]
- Kovalev, Y. Y., Petrov, L., & Plavin, A. V. 2017, A&A, 598, A1 [NASA ADS] [CrossRef] [EDP Sciences] [Google Scholar]
- Lambert, S. B. 2013, A&A, 553, A122 [NASA ADS] [CrossRef] [EDP Sciences] [Google Scholar]
- Lambert, S., Liu, N., Arias, E. F., et al. 2021, A&A, 651, A64 [NASA ADS] [CrossRef] [EDP Sciences] [Google Scholar]
- MacMillan, D. S., & Ma, C. 2007, J. Geodesy, 81, 443 [NASA ADS] [CrossRef] [Google Scholar]
- Makarov, V. V., & Secrest, N. J. 2022, ApJ, 933, 28 [NASA ADS] [CrossRef] [Google Scholar]
- Malkin, Z. 2009, J. Geodesy, 83, 547 [NASA ADS] [CrossRef] [Google Scholar]
- Mainzer, A., Bauer, J., Cutri, R. M., et al. 2014, ApJ, 792, 30 [Google Scholar]
- Masci, F. J., Laher, R. R., Rusholme, B., et al. 2019, PASP, 131, 018003 [Google Scholar]
- Mignard, F., Klioner, S., Lindegren, L., et al. 2016, A&A, 595, A5 [NASA ADS] [CrossRef] [EDP Sciences] [Google Scholar]
- Mignard, F., Klioner, S. A., Lindegren, L., et al. 2018, A&A, 616, A14 [NASA ADS] [CrossRef] [EDP Sciences] [Google Scholar]
- Nothnagel, A., Artz, T., Behrend, D., & Malkin, Z. 2017, J. Geodesy, 91, 711 [NASA ADS] [CrossRef] [Google Scholar]
- Padovani, P., Alexander, D. M., Assef, R. J., et al. 2017, A&ARv, 25, 2 [Google Scholar]
- Petrov, L., & Kovalev, Y. Y. 2017, MNRAS, 471, 3775 [Google Scholar]
- Petrov, L., & Kovalev, Y. Y. 2017, MNRAS, 467, L71 [Google Scholar]
- Petrov, L., Kovalev, Y. Y., & Plavin, A. V. 2018, MNRAS, 482, 3023 [Google Scholar]
- Petrov, L., Kovalev, Y. Y., & Plavin, A. V. 2019, MNRAS, 482, 3023 [Google Scholar]
- Planck Collaboration XI. 2014, A&A, 571, A11 [NASA ADS] [CrossRef] [EDP Sciences] [Google Scholar]
- Plavin, A. V., Kovalev, Y. Y., & Petrov, L. Y. 2019, ApJ, 871, 143 [Google Scholar]
- Prusti, T., de Bruijne, J. H. J., Brown, A. G. A., et al. 2016, A&A, 595, A1 [NASA ADS] [CrossRef] [EDP Sciences] [Google Scholar]
- Secrest, N. J. 2022, ApJ, 939, L32 [NASA ADS] [CrossRef] [Google Scholar]
- Souchay, J., Secrest, N., Lambert, S., et al. 2022, A&A, 660, A16 [NASA ADS] [CrossRef] [EDP Sciences] [Google Scholar]
- Wang, S., & Chen, X. 2019, ApJ, 877, 116 [Google Scholar]
All Tables
All Figures
|
Fig. 1 Radio astrometric variability Avar versus the optical fractional variability Fvar in bins comprising 20 sources each. For each bin, the dot represents the mean value. Error bars are 95% confidence intervals. ρ refers to the Spearman ρ coefficient of the unbinned data and its p-value. |
| In the text | |
|
Fig. 2 Optical-radio (OR) offsets and color index BP-RP as functions of the astrometric variability Avar and the optical variability Fvar in bins comprising 20 sources each. For each bin, the dot represents the mean value. Error bars are 95% confidence intervals. Above each plot, ρ refers to the Spearman ρ coefficient of the unbinned data and its p-value. |
| In the text | |
|
Fig. 3 Aval and Fvar as functions of the magnitude, position error, and redshift in bins comprising 20 sources each. For each bin, the dot represents the mean value. The error bars are 95% confidence intervals. Above each plot, ρ refers to the Spearman ρ coefficient of the unbinned data and its p-value. |
| In the text | |
|
Fig. 4 Radio astrometric variability Avar versus fraction of objects detected by Fermi-LAT (4FGL DR3) in bins comprising 20 sources each. For each bin, the dot represents the mean value. The error bars are 95% confidence intervals. The ρ refers to the Spearman ρ coefficient of the unbinned data and its p-value. |
| In the text | |
|
Fig. 5 Mean loci of optical-radio offsets and color index as functions of Avar and Fvar following the spectral class. The error bars are 95% confidence intervals. |
| In the text | |
Current usage metrics show cumulative count of Article Views (full-text article views including HTML views, PDF and ePub downloads, according to the available data) and Abstracts Views on Vision4Press platform.
Data correspond to usage on the plateform after 2015. The current usage metrics is available 48-96 hours after online publication and is updated daily on week days.
Initial download of the metrics may take a while.