Open Access
Fig. 3
Download original image
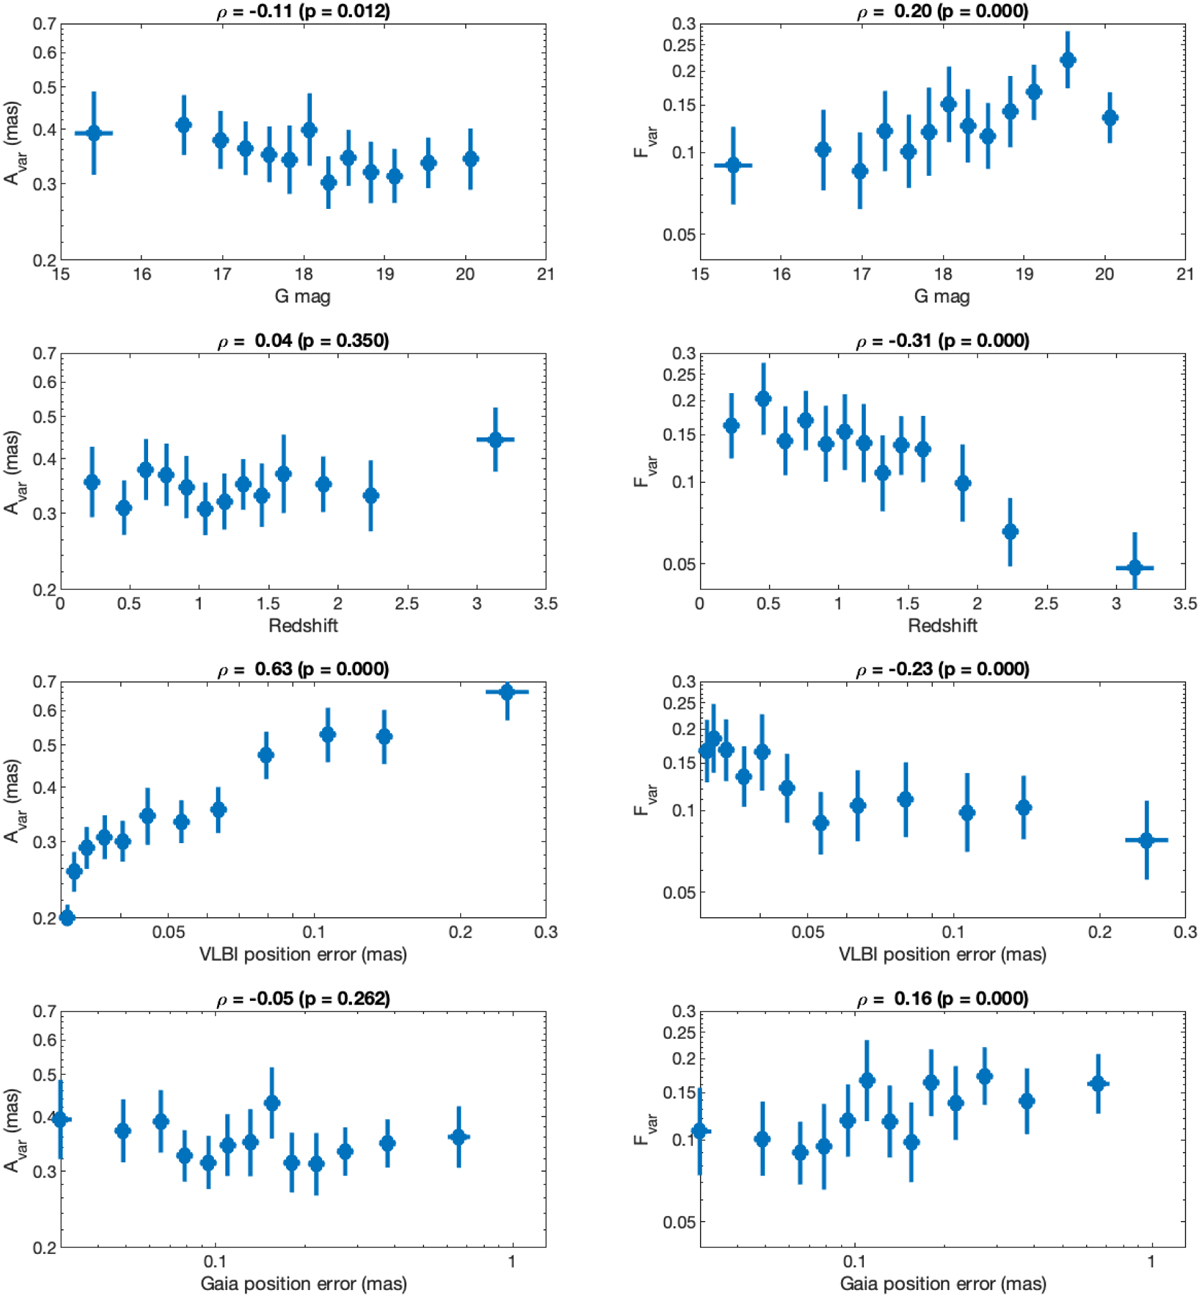
Aval and Fvar as functions of the magnitude, position error, and redshift in bins comprising 20 sources each. For each bin, the dot represents the mean value. The error bars are 95% confidence intervals. Above each plot, ρ refers to the Spearman ρ coefficient of the unbinned data and its p-value.
Current usage metrics show cumulative count of Article Views (full-text article views including HTML views, PDF and ePub downloads, according to the available data) and Abstracts Views on Vision4Press platform.
Data correspond to usage on the plateform after 2015. The current usage metrics is available 48-96 hours after online publication and is updated daily on week days.
Initial download of the metrics may take a while.