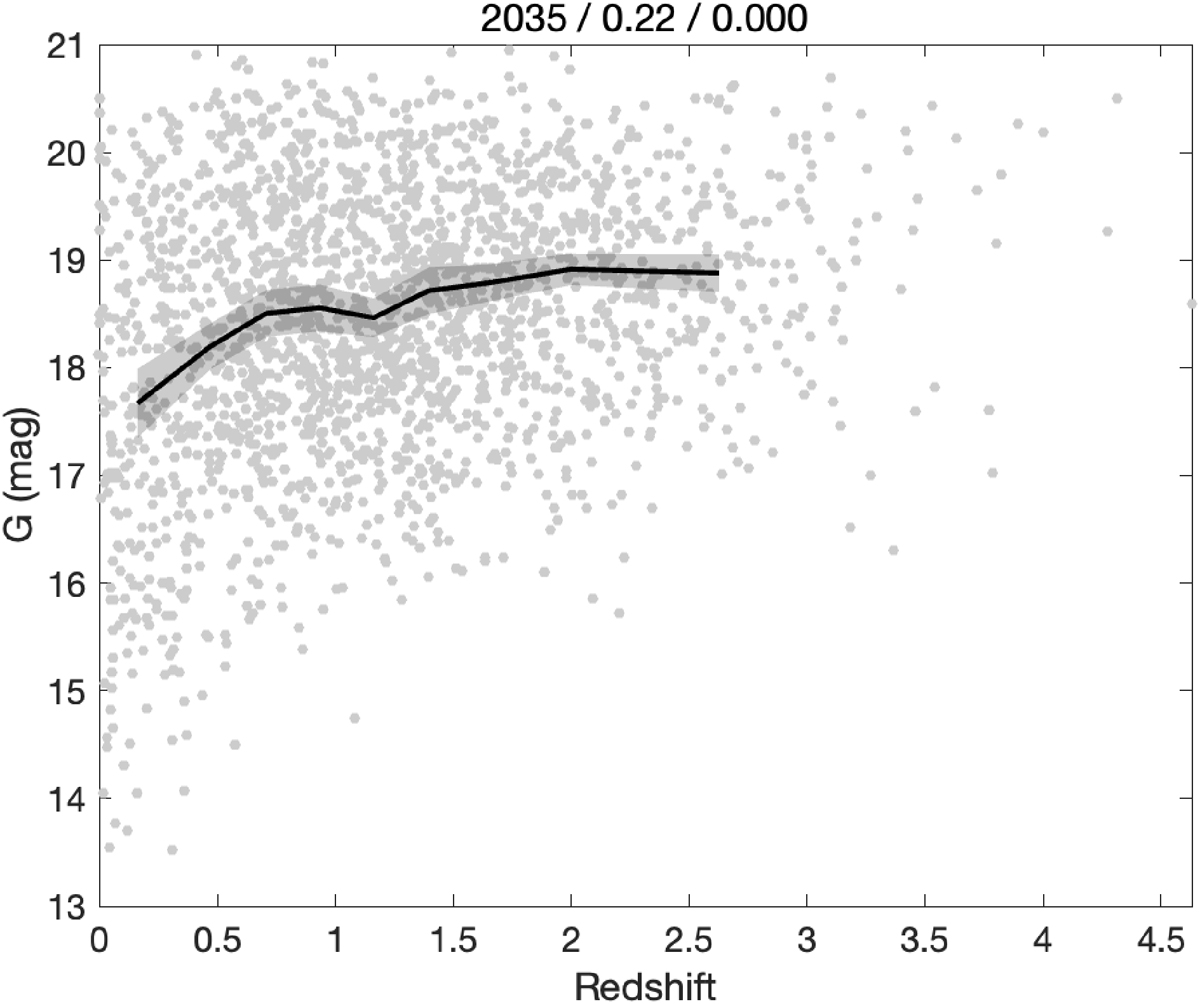
Fig. 4.
Download original image
Magnitude as function of the redshift. Each dot is one source. The thick, solid line represents the median values of G in bins of equal number of sources sorted by redshift. The shaded area represents the 95% confidence interval. The three numbers above the plots refer to, from left to right, the number of sources, the Spearman coefficient of the unbinned data and its p-value.
Current usage metrics show cumulative count of Article Views (full-text article views including HTML views, PDF and ePub downloads, according to the available data) and Abstracts Views on Vision4Press platform.
Data correspond to usage on the plateform after 2015. The current usage metrics is available 48-96 hours after online publication and is updated daily on week days.
Initial download of the metrics may take a while.