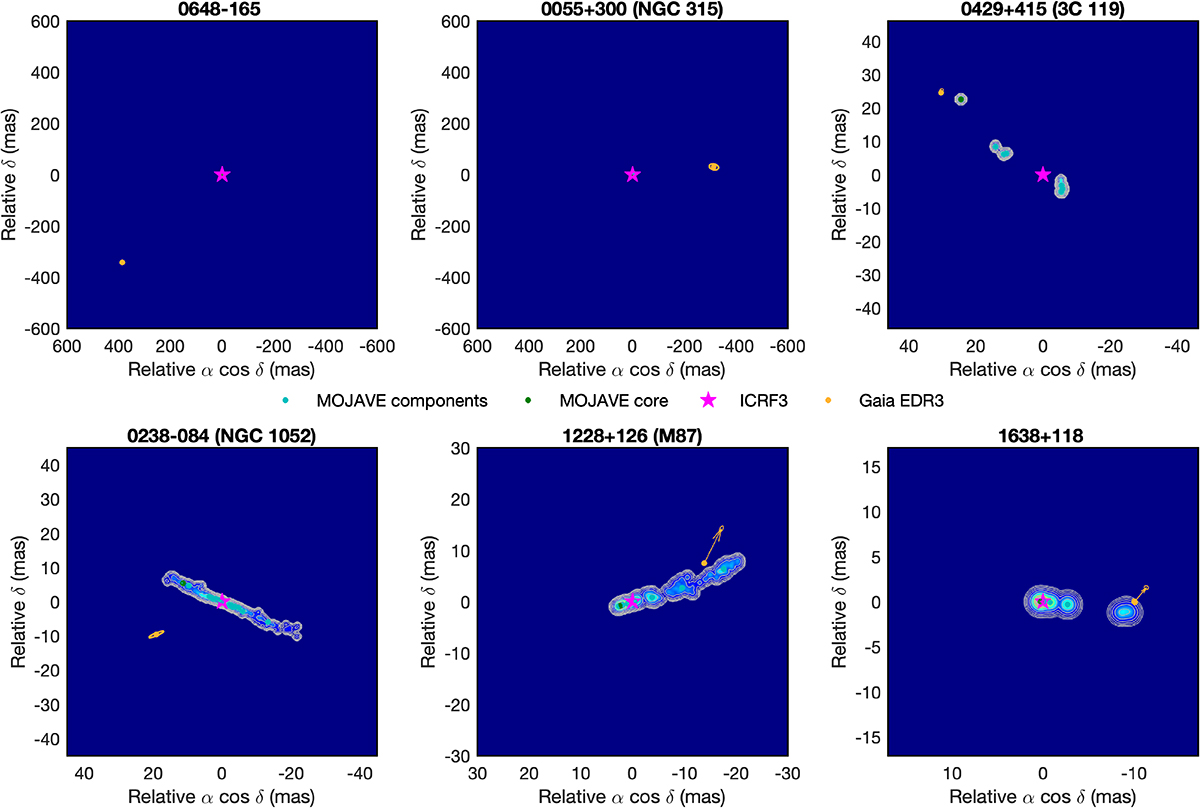
Fig. 8.
Download original image
Maps reconstructed from MOJAVE model-fitting of Lister et al. (2021) with X-band (violet star) and optical (yellow disk) centroids and the MOJAVE components (blue) for particular sources (see text) and their 99% confidence ellipses. These sources are all classified in category O and are presented in order of increasing radio–optical shift. For the last two, the shift between the MOJAVE components and the Gaia centroid is so high that their VLBI radio jet cannot be seen at this scale.
Current usage metrics show cumulative count of Article Views (full-text article views including HTML views, PDF and ePub downloads, according to the available data) and Abstracts Views on Vision4Press platform.
Data correspond to usage on the plateform after 2015. The current usage metrics is available 48-96 hours after online publication and is updated daily on week days.
Initial download of the metrics may take a while.