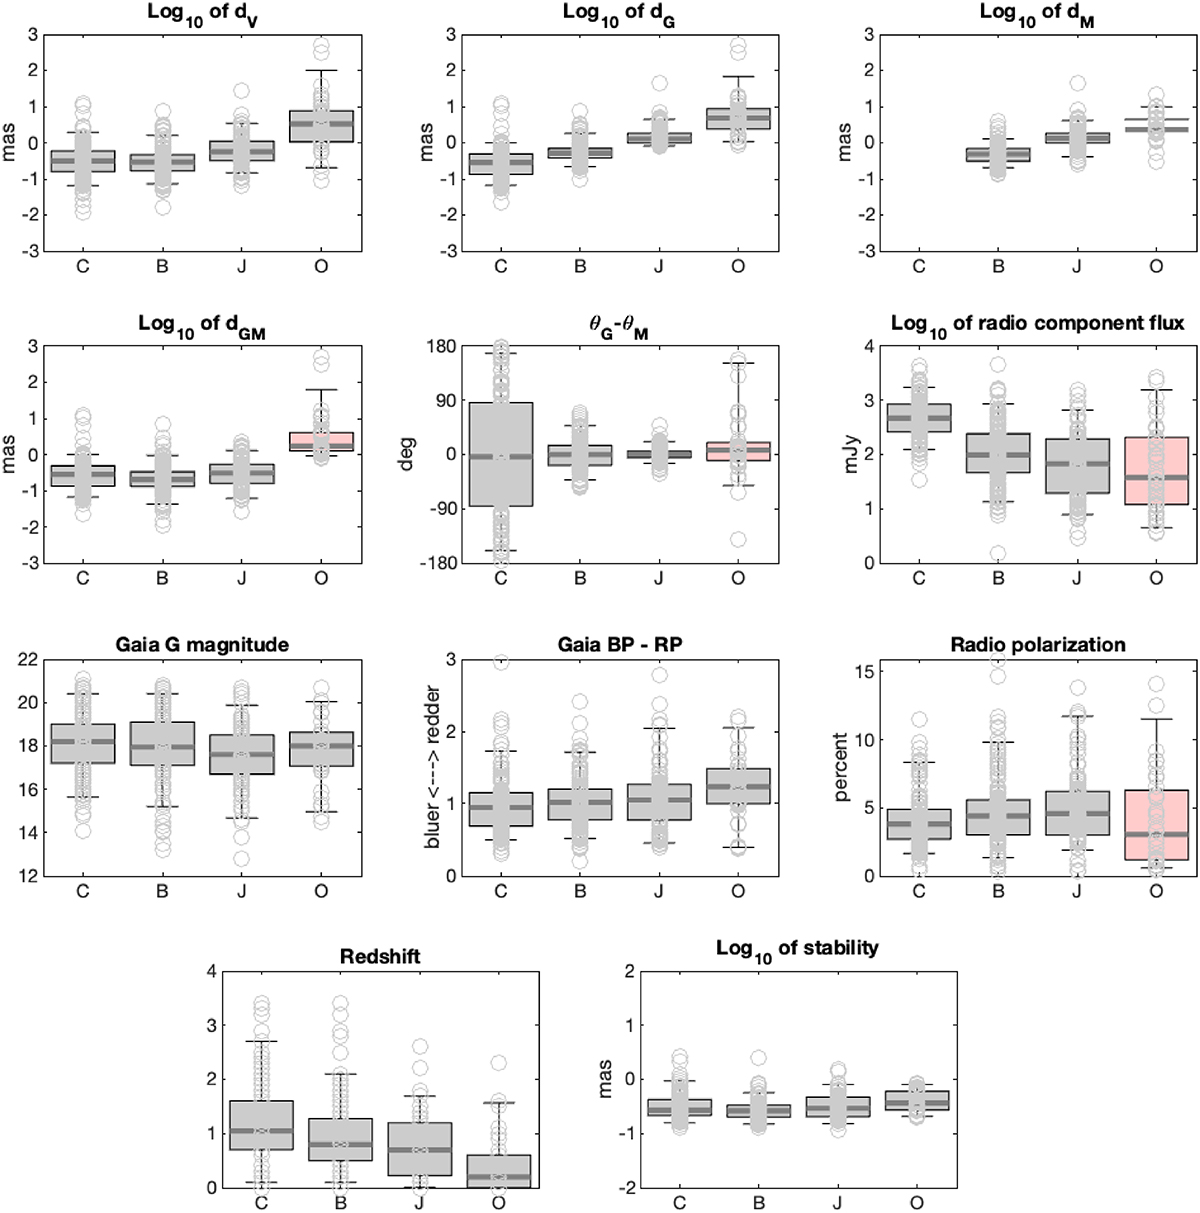
Fig. 5.
Download original image
Boxplots of various astrometric and photometric quantities following the source category. The boxplots in pink are related to optical centroids not identified with radio components: in such cases, the boxplot reports the radio properties of the MOJAVE component closest to the optical centroid. The thick horizontal line in the whisker represents the median value. The box limits are the first and third quartiles, and the extreme horizontal bars indicate the 5th and 95th percentiles.
Current usage metrics show cumulative count of Article Views (full-text article views including HTML views, PDF and ePub downloads, according to the available data) and Abstracts Views on Vision4Press platform.
Data correspond to usage on the plateform after 2015. The current usage metrics is available 48-96 hours after online publication and is updated daily on week days.
Initial download of the metrics may take a while.