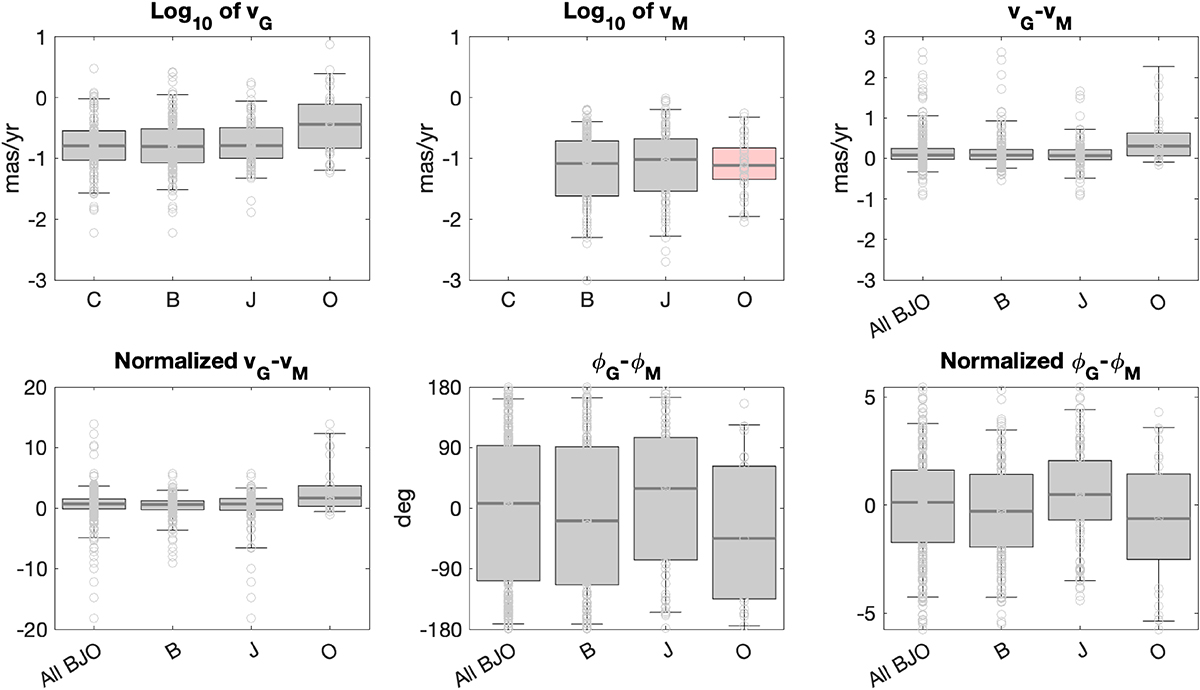
Fig. 6.
Download original image
Statistics of Gaia and MOJAVE apparent proper motion amplitude and of the differences between Gaia proper motions and the MOJAVE measurements of the apparent motion of the VLBI component (amplitude and position angle). In the middle plot of the upper row, the boxplot in pink reports the radio properties of the MOJAVE component closest to the optical centroid. The MOJAVE proper motion of sources of category C being null, these sources are not considered in the MOJAVE-related plots. In the difference plots, “All BJO” reports the statistics of the overall B, J, and O sources.
Current usage metrics show cumulative count of Article Views (full-text article views including HTML views, PDF and ePub downloads, according to the available data) and Abstracts Views on Vision4Press platform.
Data correspond to usage on the plateform after 2015. The current usage metrics is available 48-96 hours after online publication and is updated daily on week days.
Initial download of the metrics may take a while.