| Issue |
A&A
Volume 677, September 2023
|
|
|---|---|---|
| Article Number | A8 | |
| Number of page(s) | 10 | |
| Section | Galactic structure, stellar clusters and populations | |
| DOI | https://doi.org/10.1051/0004-6361/202346792 | |
| Published online | 24 August 2023 | |
The structural properties of multiple populations in the dynamically young globular cluster NGC 2419
1
Leiden Observatory, Leiden University, PO Box 9513 2300 RA Leiden, The Netherlands
2
Dipartimento di Fisica e Astronomia, Via Gobetti 93/2, 40129 Bologna, Italy
e-mail: mario.cadelano@unibo.it
3
INAF-Astrophysics and Space Science Observatory Bologna, Via Gobetti 93/3, 40129 Bologna, Italy
4
Department of Astronomy, Indiana University, Swain West, 727 E. 3rd Street, IN, 47405 Bloomington, USA
Received:
2
May
2023
Accepted:
11
July
2023
NGC 2419 is likely the globular cluster (GC) with the lowest dynamical age in the Galaxy. This makes it an extremely interesting target for studying the properties of its multiple populations (MPs), as they are likely to have been affected only modestly by long-term dynamical evolution effects. Here we present for the first time a detailed analysis of the structural and morphological properties of the MPs along the whole extension of this remote and massive GC by combining high-resolution HST and wide-field ground-based data. In agreement with formation models predicting that second population (SP) stars form in the inner regions of the first population (FP) system, we find that the SP is more centrally concentrated than the FP. This may provide constraints on the relative concentrations of MPs in GCs in the early stages of the evolutionary phase driven by two-body relaxation. In addition, we find that the fraction of FP stars is larger than expected from the general trend drawn by Galactic GCs. If NGC 2419 formed in the Sagittarius dwarf galaxy and was later accreted by the Milky Way, as suggested by a number of studies, we show that the observed FP fraction may be due to the transition of NGC 2419 to a weaker tidal field (its current Galactocentric distance is dgc ∼ 95 kpc) and consequently to a reduced rate of FP star loss.
Key words: methods: data analysis / techniques: photometric / globular clusters: individual: NGC 2419 / supergiants / Galaxy: halo / stars: abundances
© The Authors 2023
 Open Access article, published by EDP Sciences, under the terms of the Creative Commons Attribution License (https://creativecommons.org/licenses/by/4.0), which permits unrestricted use, distribution, and reproduction in any medium, provided the original work is properly cited.
This article is published in open access under the Subscribe to Open model. Subscribe to A&A to support open access publication.
1. Introduction
The presence of subpopulations that differ in terms of their light-element abundances (e.g., He, C, N, O, Na, Mg, Al; elements involved in the CNO-cycle reactions) but have the same iron (and iron-peak) content – hereafter referred to as multiple stellar populations (MPs) – is a key general property of globular clusters (GCs; see e.g., Bastian & Lardo 2018 and Gratton et al. 2019 for recent reviews). Stars sharing the light-element abundances of the surrounding field stars (i.e., Na-poor/O-rich, CN-weak) are commonly classified as first-population (FP) stars, while Na-rich/O-poor and CN-strong stars are referred to as second-population (SP) stars. Interestingly, MPs can also be studied through photometry by exploiting specific combinations of UV and optical filters (e.g., Sbordone et al. 2011), and variations of light-element abundances among stars can result in splitting or spreads of different evolutionary sequences in the colour–magnitude diagram (CMD) when appropriate filter combinations are adopted (e.g., Piotto et al. 2015; Larsen et al. 2015; Milone et al. 2017; Lee 2019). The efficiency of these filter combinations in separating subpopulations mostly depends on their sensitivity to variations of the CN and NH molecular abundances.
Multiple populations are observed in nearly all relatively massive (M > 104 M⊙; Carretta et al. 2010) stellar clusters, both in the Milky Way and in external galaxies (e.g., Mucciarelli et al. 2008; Dalessandro et al. 2016; Larsen et al. 2014; Sills et al. 2019) and in clusters with ages of down to at least ∼1.5 Gyr (Martocchia et al. 2018; Cadelano et al. 2022)1. These populations are believed to form during the very early epochs of the lives of GCs (∼10 − 100 Myr). A number of theoretical studies have been put forward over the years, but no consensus has yet been reached on their origin (e.g., Decressin et al. 2007; D’Ercole et al. 2008; Bastian & Lamers 2013; Denissenkov & Hartwick 2014; D’Antona et al. 2016; Gieles et al. 2018). It is now clear that a comprehensive approach able to focus on different aspects of GC formation, including chemical and dynamical evolution, is needed to drive significant progress in this field.
The kinematical and structural properties of MPs can provide important insights into the early epochs of GC formation and evolution. One of the predictions of MP formation models (see e.g., D’Ercole et al. 2008; Calura et al. 2019) is that SP stars form a centrally segregated subsystem possibly characterised by a more rapid internal rotation (Bekki 2011; Lacchin et al. 2022) than the more spatially extended FP system. Although the original structural and kinematical differences between FP and SP stars are gradually erased during the long-term dynamical evolution of GCs (see e.g., Vesperini et al. 2013; Hénault-Brunet et al. 2015; Miholics et al. 2015), some clusters are expected to retain some memory of their primordial properties. In fact, sparse and inhomogeneous observations show that MPs are characterised by remarkable differences in their relative structural parameters and radial distributions (e.g., Lardo et al. 2011; Dalessandro et al. 2016, 2018a; Simioni et al. 2016), different degrees of orbital anisotropy (e.g., Richer et al. 2013; Bellini et al. 2015; Libralato et al. 2023), different rotation amplitudes (e.g., Lee 2015; Cordero et al. 2017; Dalessandro et al. 2021), and significantly different binary fractions (Lucatello et al. 2015; Dalessandro et al. 2018b; Kamann et al. 2020a).
However, despite the key importance of a full understanding of the structural and kinematical properties of MPs, no systematic study has been performed so far and a complete picture is still lacking. In Dalessandro et al. (2019a; see also Leitinger et al. 2023), we took a first step in this direction and studied the spatial distributions of MPs in a sample of 20 GCs spanning a broad range of dynamical ages. The differences between the spatial distributions of FP and SP stars were quantitatively measured by means of the parameter A+, which is defined as the area enclosed between their cumulative radial distributions. Our study revealed a clear trend between A+ and GC dynamical evolution, as constrained by the ratio between the cluster age and its half-mass relaxation time (t/trh). Less dynamically evolved clusters (t/trh < 8 − 10) have more centrally concentrated SP stars than FP stars (i.e., negative values of A+), while in more dynamically evolved systems the spatial differences between FP and SP stars decrease and eventually disappear (A+ tends to zero). This is the first purely observational evidence of the dynamical path followed by the structural properties of MPs towards a complete FP–SP spatial mixing. Such behaviour is consistent with predictions by N-body and Monte Carlo simulations following the long-term dynamical evolution of MPs (Vesperini et al. 2013, 2018, 2021; Dalessandro et al. 2019a; Sollima 2021) in clusters forming with an initially more centrally concentrated SP subsystem. Very interestingly, the existence of such an evolutionary path provides the possibility to trace back the structural properties of MPs to before two-body relaxation and other long-term dynamical processes that alter the structural properties of the cluster. These constraints, ideally in combination with information on the very early structural properties of proto-clusters (possibly obtained with JWST observations; see e.g., Vanzella et al. 2017) are critical in order to test existing cluster formation and evolutionary models and guide the development of new formation scenarios.
In this context, the structural properties of dynamically young systems (i.e., those with t/trh < 3 − 4) are particularly meaningful, as they are expected to be only partially affected by long-term dynamical evolution and are therefore expected to retain a greater imprint of the conditions emerging from their formation and early evolutionary phases. As a consequence, the study of dynamically young clusters might allow us to probe the early structural properties of MPs, and thus to better define their dynamical evolutionary path. The key constraints provided by this analysis also have important implications for the interpretation of the other MP kinematical features that are now becoming observable thanks to Gaia and the high multiplexing capabilities of state-of-the-art multi-object and integral field unit (IFU) spectrographs. However, in our initial study (Dalessandro et al. 2019a), only three clusters fall in this critical range of young dynamical ages, which prevents any meaningful exploration of this kind.
In this paper, we present a detailed analysis of the case of NGC 2419. This is an old (t ∼ 12 Gyr; Dalessandro et al. 2008) and metal-poor ([Fe/H] = −2.1; Mucciarelli et al. 2012) Galactic GC that shows quite extreme light-element chemical patterns. Indeed, about half of the stars in NGC 2419 have extremely depleted Mg abundances, down to [Mg/Fe] ∼ −12, along with strong enrichment in K (Cohen & Kirby 2012; Mucciarelli et al. 2012). In addition, NGC 2419 hosts a subpopulation (∼30%) of extremely He-rich stars (Y ∼ 0.40), as constrained through photometry of red giant branch (RGB) stars and through the cluster horizontal branch (HB) morphology (di Criscienzo et al. 2011). More interestingly in this context, NGC 2419 is one of the most massive (M ∼ 106 M⊙; Baumgardt & Hilker 2018) GCs in the Galaxy and its relaxation time is among the largest (trh ∼ 42.7 Gyr; Harris 2010). In addition, with a Galactocentric distance of dGC ∼ 95 kpc, NGC 2419 is expected to be only marginally affected by gravitational interactions with the Galactic potential, which can alter its dynamical properties. The very young dynamical age of NGC 2419 has also been empirically confirmed by Dalessandro et al. (2008; see also Ferraro et al. 2018) and Bellazzini et al. (2012), who analysed the blue straggler star population of the cluster and radial variations of the slope of its mass function, respectively. It is also interesting to note that, thanks to the kinematic information secured by Gaia, it has been suggested that NGC 2419 was likely born in the Sagittarius dwarf galaxy and later accreted by the Milky Way (e.g., Massari et al. 2019; Bellazzini et al. 2020).
The first analyses of the radial distribution of MPs in NGC 2419 were presented by Beccari et al. (2013), who found that SP stars are significantly more centrally concentrated than the FP subpopulation based on wide-field ground-based Large Binocular Telescope (LBT) data limited mostly to the external cluster regions (> 100″), and by Larsen et al. (2019), who used Hubble Space Telescope (HST) observations limited to the innermost 80″, and found that SP stars are only slightly more centrally concentrated than FP stars, and with low significance.
To perform a complete and detailed analysis of the MP radial distribution in NGC 2419, in this paper we combine high-resolution HST photometry to sample the innermost and most crowded cluster regions and wide-field images to adequately sample the entire cluster extension. The paper is structured as follows. The observations and data analysis procedures are detailed in Sect. 2. In Sect. 3, we describe a selection of the different subpopulations. In Sect. 4, we estimate the structural properties of MPs, analyse their cumulative radial distributions, and compare them with the results of Dalessandro et al. (2019a). We summarise our conclusions in Sect. 5.
2. Observations and data analysis
This work is based on a combination of 22 images obtained with the HST WFC3/UVIS camera through the F336W and F343N filters (GO-15078, PI: Larsen), and the F438W and F814W filters (GO-11903, PI: Kalirai). A detailed observation log is reported in Table 1.
Summary of the HST dataset used in this work.
The data reduction was performed on the _flc images, which are flat-field corrected, bias subtracted, and corrected for dark current and charge transfer efficiency by the Space Telescope Science Institute WFC3 pipeline. The most up-to-date pixel-area maps were applied independently to each chip and image.
The photometric analysis was performed independently on each chip using DAOPHOT IV (Stetson 1987). A few hundred bright and isolated stars were selected in each frame to model the point spread function (PSF). By following the approach already adopted in previous works of our group (e.g., Dalessandro et al. 2018a; Cadelano et al. 2020a,b,c), a first star list was obtained for each image by independently fitting stellar-like sources above the 4σ level from the local background. We then created a master list composed of stars detected in at least half of the F343N and F438W images. At the corresponding positions of stars in this final master list, a fit was forced with DAOPHOT/ALLFRAME (Stetson 1994) in each frame of the dataset. For each recovered star, multiple magnitude estimates obtained in each chip were homogenised using DAOMATCH and DAOMASTER, ultimately obtaining the final stellar magnitudes and relative uncertainties.
Instrumental magnitudes were reported to the VEGAMAG photometric system using the equations and zero points reported on the dedicated HST web pages. Instrumental coordinates were corrected for geometric distortions using the prescriptions by Bohlin (2016). These were then reported to the absolute system (α, δ), first using the stars in common with the ACS HST high-resolution catalogue presented by Dalessandro et al. (2008), and then the stars in common with Gaia DR3 (Gaia Collaboration 2021) as primary astrometric standards. Catalogue cross-matches and geometric transformations were obtained using the cross-correlation tool CataXcorr3.
In order to study the properties of the cluster MPs throughout the entire radial extension of the cluster, we complemented the HST dataset with the wide-field catalogue presented by Beccari et al. (2013) and obtained from observations acquired with the LBC camera mounted at the LBT using V, I, and SDSS u passbands (see Beccari et al. 2013 for details about the dataset and data analysis). Also in this case, stellar positions were cross-matched with the Gaia DR3 astrometric system to secure homogeneity with the HST dataset.
The sky distribution map of the stars surveyed within the field of view (FoV) of the HST and LBT datasets is shown in Fig. 1. It is worth stressing that the Gaia DR3 catalogue cannot be used to firmly distinguish cluster members from field interlopers along the cluster evolutionary sequences because of the large proper-motion uncertainties for such a remote stellar system. However, we statistically estimated that the contamination due to field interlopers is negligible (see e.g., Dalessandro et al. 2019b). In fact, the density of stars in the region beyond the cluster tidal radius and located in the CMD region occupied by the RGB stars of the cluster is of only ∼4 × 10⁻⁵ stars arcsec−2, corresponding to only about 30 contaminating stars (out of approximately 2500) within the cluster tidal radius.
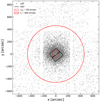 |
Fig. 1. Sky distribution of the surveyed stars measured with respect to the cluster gravitational centre. Grey points are stars from the HST adopted dataset and the LBT wide-field catalogue by Beccari et al. (2013). The black polygon marks the boundaries of the HST FoV. The golden cross marks the cluster gravitational centre, while the dashed and solid circles correspond to the cluster half mass and tidal radius, respectively. |
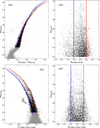 |
Fig. 2. CMDs of NGC 2419 and verticalised RGB colour distribution obtained through the HST observations. Panel a1: gray dots are the (mF438W, mF438W − mF814W) optical CMD, black dots are the selected RGB stars. The red and blue curves are the fiducial lines adopted to verticalise the RGB sequence. Panel a2: verticalised colour distribution of the selected RGB stars. The red and blue vertical lines correspond to the red and blue curves in panel a1. Panel b1: same as in panel a1 but for the (mF814W, CF336W, F343N, F438W) CMD. Panel b2: same as in panel a2 but for the filter combination used in panel b1. |
3. Properties of the multiple populations
3.1. Selection of multiple populations
MPs were first selected in the HST dataset along the cluster RGB in the (mF814W, CF336W, F343N, F438W) and (mF814W, mF438W − mF814W) diagrams, where CF336W, F343N, F438W = (mF336W − mF343N)−(mF343N − mF438W) (see Milone et al. 2017). To this aim, we verticalised the distribution of RGB stars in the (mF814W, CF336W, F343N, F438W) and (mF814W, mF438W − mF814W) diagrams with respect to two fiducial lines at the blue and red edges of the RGB in both the CMDs. The combination of the two verticalised distributions (ΔF438W, F814W and ΔF336W, F343N, F438W) finally gives the so-called cluster chromosome map (ChM; Fig. 3). To maximise the accuracy of the MP selection, only stars with mF814W < 21 were included in the ChM. The ChM obtained here is qualitatively similar to the one obtained by Zennaro et al. (2019) and is characterised by a prominent sequence with a relatively structured and clumpy stellar distribution and a very sparse and poorly populated subgroup at bluer colours. As shown by the two histograms in Fig. 3, the distribution of ΔF336W, F343N, F438W is at least bimodal, while the distribution of ΔF438W, F814W is dominated by a main peak at colour ∼ − 0.2 followed by a long tail.
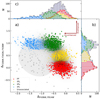 |
Fig. 3. Chromosome map of NGC 2419 RGB stars. Panel a: different populations as selected through the GMM algorithm are highlighted with different colours. A larger marker size indicates an higher probability that a given star belongs to the assigned population. The confidence ellipsoids of each subpopulation fitted with the GMM algorithm are also plotted. Panel b: Histograms of the distribution along ΔF336W, F343N, F438W of the total population and of each subpopulation. Panel c: same as in panel b, but for the distribution along ΔF438W, F814W. |
To identify the number of subpopulations in the cluster and to assign the surveyed stars to the different subgroups, we fit the ChM with 2D Gaussian mixture models using the scikit-learn package4 (Pedregosa et al. 2011). First, we used both the Akaike (AIC) and the Bayes (BIC) information criteria to infer the optimal number of subpopulations in which the observed ChM can be split. The distributions of both parameters as functions of the number of components reach a minimum for five components, indicating that this is the most likely number of subgroups. We then fit the ChM with a mixture of five bidimensional Gaussian functions, whose parameters were obtained from the mixture model analysis. The derived separation among different subpopulations is illustrated by the different colours shown in Fig. 3, where the size of each circle corresponds to the probability of that star belonging to a given subgroup. In agreement with the findings by Zennaro et al. (2019), our analysis confirms the presence of a main primordial population centred around the origin of the ChM (FP; red circles), an intermediate mildly N-enhanced SP subgroup (SPA; yellow circles), a more strongly N-enriched population (SPB; green circles), and finally an extreme population significantly enriched both in terms of He and N (SPC; cyan circles). The fifth sparse component is populated by sources of an unidentified nature (grey points). This unassociated population might include binaries, evolved blue straggler stars, and other exotic objects (Kamann et al. 2020b; Marino 2020) and is not considered in the following analysis.
To obtain a comprehensive view of the structural properties of the MPs throughout the entire radial extension of the cluster, we need to also identify MPs in the LBT wide-field catalogue. First of all, we verified the completeness level of the LBT catalogue. We counted the number of RGB stars in an overlapping area between the HST and LBT datasets and at distances of greater than 70″ from the cluster centre. At the faint end of the RGB analysed in this work (20 < mF814W < 21), we counted 95 RGB stars in the HST dataset and 87 stars in the LBT dataset, suggesting a lower limit on completeness of 90%. As the completeness is expected to increase further for larger clustercentric distances and for brighter stars, we conclude that the LBT catalogue provides an excellent completeness in the region not sampled by the HST observations and within the magnitude range considered in the analysis. As the LBT filters are less efficient in separating MPs than the adopted HST ones (in particular at low metallicities, as in the case of NGC 2419) and the LBT photometric quality is lower than that provided by HST, in the following analysis we consider only the FP and SP subgroups and do not attempt further splitting of the SPs. We used the stars in common between the HST and LBT catalogues to translate the MP selection criteria adopted in the former into the photometric bands of the latter. In doing so, we considered only HST stars with a probability of belonging to the FP or SP of greater than 75% (as predicted by the Gaussian mixture model) in order to minimise contamination between the two populations. Moreover, we restricted the analysis to high-quality photometry stars by considering only stars in the wide-field catalogue with sharpness |sh| ≤ 0.2 and excluding all the sources located in the innermost 30″ from the cluster centre, where the severe crowding condition significantly decreases the photometric quality of ground-based images. We find that in the wide-field catalogue, FP and SP stars appear to be nicely separated in the filter combination (I, CuVI) where CuVI = (u − V)−(V − I) (left-hand panel of Fig. 4). We then verticalised the colour distribution of RGB stars in this filter combination and analysed the position of FP and SP stars in the verticalised distribution (ΔuVI). The verticalised distribution of the selected stars is shown in the right-hand panel of Fig. 4. As can also be seen in the histograms of the verticalised distributions, the selected subpopulations appear to show an almost bimodal distribution in ΔuVI with a maximum separation of around ΔuVI = 0.45, with stars showing ΔuVI < 0.45 belonging to the FP stars and the remaining ones to the SP. We then applied this separation to the LBT stars observed in the area outside the HST FoV. In this way, we obtain a complete list of FP and SP stars across the entire cluster extension. Specifically, stars within 1.3rhl (where rhl ∼ 53.4″ is the cluster half-light radius) are extracted from the HST dataset, while stars beyond this limit are extracted from the LBT dataset. In such a way, 1104 stars are associated to the FP, while 1352 are associated to the SP, yielding a global population ratio of NFP/NTOT = 0.45 ± 0.02, in very good agreement with the results by Zennaro et al. (2019) for the HST sample only.
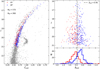 |
Fig. 4. CMDs of NGC 2419 and verticalised RGB colour distribution obtained through the LBT observations. Left-hand panel: I, CuVI CMD of NGC 2419 from the LBT stars in common with the HST catalogue. Red and blue dots are objects classified in the HST dataset as FP and SP stars, respectively. Right-hand panels: top panel shows the verticalised distribution of the CuVI colour. Red and blue dots are the same as in the left-hand panel. The vertical line is adopted as the separation between FP and SP stars for the LBT stars observed in the area complementary to the HST FoV. The bottom panel shows the histograms of the verticalised CuVI distributions for FP and SP stars. |
3.2. Multiple population fractions
Figure 5 shows the distribution of the number fraction of FP stars (NFP/NTOT; from Milone et al. 2017) as a function of the present-day stellar mass obtained from Baumgardt & Hilker (2018) for a sample of 53 Galactic GCs. As already discussed in Milone et al. (2017), NFP/NTOT decreases for increasing cluster mass. However, NGC 2419 appears to not follow the general trend, showing a significantly larger value than any cluster of comparable mass: indeed, it has the largest NFP/NTOT ratio among the massive (M > 5 × 10⁵ M⊙) Galactic GCs (see also Zennaro et al. 2019). A number of dynamical models of the evolution of NFP/NTOT indicate that the strongest decrease in this ratio occurs during the GC early evolutionary phases (see e.g., D’Ercole et al. 2008; Vesperini et al. 2021; Sollima 2021) and is driven by a significant early loss of FP stars, while the subsequent mass loss driven by two-body relaxation has a much weaker effect on the evolution of this ratio (see Vesperini et al. 2021; Sollima 2021). A possible explanation for the observed value of NFP/NTOT in NGC 2419 may be connected to the possibility that this cluster formed in the Sagittarius dwarf galaxy, where during its early evolutionary phases it experienced a stronger tidal field than the one it is experiencing now in the very outer regions of the Milky Way. Figure 6 illustrates the time evolution of the ratio between the FP mass and the total cluster mass obtained from a Monte Carlo simulation run with the MOCCA code (Hypki & Giersz 2013; Giersz et al. 2013). This simulation starts with 6.5 × 10⁶ stars with masses following a Kroupa (2001) IMF between 0.1 and 100 M⊙, and a ratio of the FP to total mass of MFP/MTOT = 0.75. The SP is initially modelled as a King model with W0 = 7 and a half-mass radius equal to one-fifth of the half-mass radius of the FP, which initially follows the density profile of a King model with W0 = 4. In the Monte Carlo simulation run for this paper, the system is initially assumed to evolve in a stronger tidal field than at its present-day galactocentric distance (Rgc = 95 Kpc) in the Milky Way. Specifically, the initial tidal field is equivalent, for example, to that at a distance of 2.5 kpc (4 kpc) from the centre of a host dwarf galaxy modelled with a logarithmic potential with a circular velocity of Vc = 50 km s−1 (80 km s−1) and with the truncation radius of the FP coinciding with the tidal radius. We then assume that between 2 Gyr and 3 Gyr after the system formation, it is accreted to the Milky Way and the cluster continues its subsequent evolution at 95 kpc from the Galactic centre. We also ran a similar simulation setup but with a transition to the Milky Way occurring between 4 Gyr and 5 Gyr. As shown in Fig. 6, until the transition to the weaker tidal field occurs, MFP/MTOT undergoes a significant decrease and shows the typical behaviour found in previous studies (Vesperini et al. 2021; Sollima 2021). After the transition to the much weaker tidal field at a Galactocentric distance of 95 kpc, the tidal radius is significantly larger than the size of the cluster and the star-loss rate becomes much weaker, essentially halting the evolution of MFP/MTOT. As shown by the dashed line, without such a transition, MFP/MTOT would continue to slightly decrease over the next 9–10 Gyr, eventually reaching ratios of about 0.2–0.3, compatible with those measured for the high-mass clusters shown in Fig. 5. We strongly emphasise that the goal of this simulation is not to build a detailed model of NGC 2419 and its structural properties but rather to provide a simple illustration of how a possible transition to a much weaker tidal field than the one in which the cluster formed might reduce the decrease in MFP/MTOT and explain the high ratio of MFP/MTOT found in NGC 2419 compared to other clusters with similar masses.
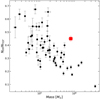 |
Fig. 5. Distribution of the observed fraction of FP stars (as obtained in Milone et al. 2017 – black circles) as a function of cluster mass (from Baumgardt & Hilker 2018). The red square shows the location of NGC 2419 based on the results found in this paper. |
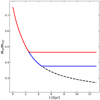 |
Fig. 6. Time evolution of the ratio of the FP mass to the total cluster mass as obtained by Monte Carlo simulations described in Sect. 3. The black curve corresponds to the simulation in which a cluster was formed and spent its entire lifetime within a Sagittarius-like galaxy. The red and blue curves describe the MFP/MTOT evolution if the cluster is accreted by a Milky Way-like galaxy 2 − 3 Gyr and 4 − 5 Gyr after its formation, respectively. |
4. Structural properties of multiple populations and their radial distributions
4.1. Density profiles
We obtained the density profiles of FP and SP stars following the prescriptions by Lanzoni et al. (2019, see also Cadelano et al. 2017). Briefly, for each population, we divided the FoV in concentric annuli centred on the cluster gravitational centre quoted by Dalessandro et al. (2008). Each annulus was divided into subsectors for which we derived the mean stellar density and its standard deviation, which we adopted as the uncertainty on the density value. The resulting density profiles for both the FP and SP are plotted in Fig. 7 (empty black circles). In both profiles, the outermost value, which is located beyond the tidal radius of the cluster (rt = 460″; Dalessandro et al. 2008), is assumed to be representative of the field background density. It was then subtracted from the other bins to obtain the decontaminated density profiles (filled black circles in Fig. 7). The decontaminated density profiles were then fitted using spherical, isotropic, and single-mass King (1966) models to derive the structural parameters of the two populations. Details on the fitting procedure are provided by Raso et al. (2020). The best-fit curves and structural parameters are reported in Fig. 7. The results of the fit clearly show that the two populations are characterised by significantly different structural properties. Moreover, despite being fit by King models with similar values of the central dimensionless potential W0, the SP is characterised by a smaller core, a smaller half-mass, and smaller truncation radius than the FP. The ratios between the core, half-mass, and truncation radius of the FP and SP are  ,
,  and
and  , respectively, confirming that the SP is more centrally concentrated than the FP. We do not find significant variations in the final results if slightly different values of ΔuVI are used to separate between the two populations in the LBT dataset. We note that Larsen et al. (2019) found a significantly smaller difference between the half-mass radii of the two subpopulations, with the SP half-mass radius being only about 10% smaller than that of the FP. This is likely due to the limited FoV adopted in their analysis, which only samples a radial range of 0.7–0.8 rhm.
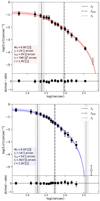 |
Fig. 7. Stellar density profiles of MPs in NGC 2419. Top panel: density profile of FP stars. Empty and solid circles mark the observed and decontaminated density profiles of FP stars, respectively. The red dashed curve is the best-fit profile with a King model and the red stripe marks the envelope of the ±1σ solutions. The dashed, dot-dashed, and dotted vertical lines mark the best-fit core, half-mass, and tidal radii, respectively, and their corresponding 1σ uncertainties are represented with the grey stripes. The fit residuals are plotted in the bottom panel. The best-fit structural parameters are reported in the inset box. Bottom panel: same as in top panel but for SP stars. |
In addition to the projected density profiles, we explored the 2D density distributions for both the FP and SP stars. The 2D density maps shown in Fig. 8 were obtained by transforming the sky distribution of the selected RGB stars into a smoothed surface density function through the use of a Gaussian kernel with a width of 20″. The 2D maps also clearly show that the SP is more centrally concentrated than the FP. Overall, both distributions appear to be grossly spherical, in agreement with the low ellipticity (ϵ = 0.03) derived for NGC 2419 (Harris 2010). However, we note that the SP density distribution is slightly more elongated than the FP one and reaches a maximum of ϵ ∼ 0.08, with the ellipse major axis directed along the East–West direction; this might be the effect of a rotating SP.
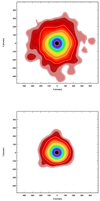 |
Fig. 8. Two-dimensional density maps and isodensity contours of the FP and SP stars in the top and bottom panels, respectively. |
We further investigated the 2D density distribution of the FP, SPA, SPB, and SPC subpopulations identified within the HST FoV, instead using a Gaussian kernel with a width of 5″. The maps plotted in Fig. 9 show that, with the exception of SPA, all the populations are characterised by elongated elliptical structures in the innermost cluster regions. As shown in the top panel of Fig. 10, they have an ellipticity of about ϵ ∼ 0.2 − 0.3 within the cluster core radius (rc = 20″). This value then decreases to zero beyond the core for most populations, but not for the FP stars, which retain a significant ellipticity within twice rc. The SPA population, on the other hand, shows a lower ellipticity of around 0.1. Indeed, the ellipticity of SPA is always smaller than the others, never exceeding ϵ ∼ 0.15 and rapidly vanishing to zero. The bottom panel of Fig. 10 shows the position angle (PA) of the isodensity contours (the angle is measured counterclockwise with the origin set in the east direction). Interestingly, while the FP and SPA, B show a constant and similar PA of about 75deg throughout the whole HST FoV, the SPC shows a remarkably different PA of about 150deg, which is almost perpendicular with respect to the other three populations. This intriguing feature suggests that the SPc population may be characterised by very different kinematics. As this cluster is dynamically young, this difference may contain some information about the properties emerging from the formation and early evolutionary phases. However, given the small sample size, additional observations are needed to suitably investigate the kinematical differences of the various SPs.
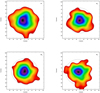 |
Fig. 9. 2D density maps and isodensity contours for the HST stars and belonging to the FP (left-hand top panel), SPA (right-hand top panel), SPB (left-hand bottom panel) and SPC (right-hand bottom panel). |
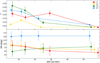 |
Fig. 10. Ellipticity and position angle (top and bottom panel, respectively) of the isodensity contours shown in Fig. 9 for the different sub populations, as a function of the radial distance from the cluster center. The angles are measured counterclockwise with the origin set along the east direction. |
4.2. Radial distribution of multiple populations
We can now compare the radial distributions of FP and SP stars. Fig. 11 shows the cumulative radial distributions of the four subpopulations identified in the HST dataset. These are presented for illustrative purpose only, as they sample a limited cluster extension (∼1.5rh) and therefore may not be representative of the global behaviour. As expected, all SP subpopulations tend to be more centrally concentrated than the FP one. This result is particularly clear in the case of SPA and SPB stars, while the central concentration of SPC stars is far less striking. Although this could be another signature of a different formation and evolutionary path of SPC stars, we stress that both the low number statistics for this subpopulation and the limited radial coverage of the HST dataset prevent us from elaborating on the possible different properties of the SPC population. The general behaviour of the SP radial distributions within the HST FoV is qualitatively in agreement with that presented by Larsen et al. (2019), although there is not a one-to-one correspondence between the subpopulations defined here and those defined by Larsen et al. (2019) because of differences in our adopted selection methods.
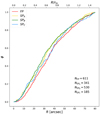 |
Fig. 11. Cumulative radial distributions of the four subpopulations of NGC 2419 detected within the HST FoV (the colour code is the same as that used in Fig. 3). |
As discussed above, the study of the MP properties along the entire radial extension of the cluster is limited to the two subgroups of FP and SP stars as obtained from the combination of the HST and LBT datasets. The left-hand panel of Fig. 12 shows the cumulative radial distributions of the two populations out to the cluster’s tidal radius. In agreement with results obtained from the density profile analysis, we find that the SP population is significantly more centrally concentrated than the FP population across the entire extension of the cluster. Indeed, the Kolmogorov–Smirov test returns a null probability (PKS ∼ 10−31) that the two samples are drawn from the same distribution.
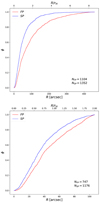 |
Fig. 12. Cumulative radial distribution of FP stars (red curve) and SP stars (blue curve) obtained by combining the HST and LBT datasets. The top panel shows the distribution of stars across the whole cluster extension, while the bottom panel shows the distribution within twice the cluster half-light radius. |
The available dataset allows us to put NGC 2419 in the framework of MP dynamical evolution presented by Dalessandro et al. (2019a) and discussed in the Sect. 1. We only measured the A+ parameter for stars within twice the cluster half-light radius ( ). We show the cumulative distributions of FP and SP stars within 2rhl in the right-hand panel of Fig. 12. The area between the two curves provided us with the value of the
  parameter, while to quantify its uncertainty we performed a bootstrapping/jackknife resampling, finally finding
  = −0.0826 ± 0.0005. Assuming a cluster age t = 13 Gyr and trh = 42.7 Gyr (Dotter et al. 2008; Harris 2010), we find that the ratio Nh = t/trh, which can be used as a measure of the cluster dynamical age, is of only Nh ∼ 0.3. The position of NGC 2419 in a diagram showing
  as a function of Nh is plotted in Fig. 13, and is compared with the results of N-body simulations (green and blue lines) and the location of the GCs analysed by Dalessandro et al. (2019a), with the addition of M 13 from Smolinski et al. (2020). The value of
  obtained for NGC 2419 is among the most negative in the sample and the cluster appears to closely follow the overall trend whereby less dynamically evolved clusters (t/trh < 8 − 10) contain SP stars that are more centrally concentrated than the FP ones (i.e., negative values of A+). This trend is consistent with that expected from models of dynamical evolution and spatial mixing of MPs. In order to illustrate the expected trend, we show in the same plot the results of the two N-body simulations presented in Vesperini et al. (2018) and already discussed in Dalessandro et al. (2019a). The results of these two simulations are added simply to demonstrate the expected trend, but a larger survey of models providing comprehensive coverage of the various initial dynamical properties of MPs (such as the initial ratio of FP to SP half-mass radii, the initial FP and SP density profiles, as determined, for example, by the King central dimensionless potential W0, and the FP and SP kinematics) would be necessary to establish a closer connection between the theoretical predictions and observations, and to shed light on the possible evolutionary path leading to the present-day structure of NGC 2419.
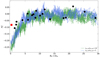 |
Fig. 13.
|


5. Conclusions
In this paper, we present a detailed characterisation of the structural properties of MPs in NGC 2419, one of the most massive (M ∼ 106 M⊙) and dynamically young (tage/trh ∼ 0.3) GCs in the Galaxy. In our analysis, we combine data from HST and LBT to study the density profile and morphology of MPs over a radial range extending from the centre of the cluster to the tidal radius rt. Our results show that the SP population is more spatially concentrated than the FP one. The density profiles of the two populations can be fit by King models with similar values of the central dimensionless potential (W0 = 6.9 for the FP and W0 = 6 for the SP) but different spatial scales: the core and half-mass radius of the FP are about 1.3 and 1.8 times larger, respectively, than those of the SP, while the ratio between the King truncation radius of the FP and that of the SP is equal to about 2.2.
Two-dimensional maps of the spatial distributions of the MPs reveal some deviations from spherical symmetry, which might be associated with internal rotation. Interestingly, the heavily enriched SPc shows a remarkably different structure, being elongated in the central regions, almost perpendicularly to the other subpopulations. Ad hoc spectroscopic observations are necessary to shed light on the possible peculiar kinematics of this population, which may provide clues as to its formation process.
We quantified the differences in the spatial distribution of the FP and SP stars by means of the A+ parameter and find that NGC 2419 has one of the most negative  values of the sample of GCs for which this quantity has been estimated (Dalessandro et al. 2019a), and qualitatively follows the expected general trend
  − t/trh.
The characterisation of the structural properties of MPs in such a dynamically young cluster provides important empirical constraints on the properties emerging after the formation and early evolutionary phases (see e.g., Vesperini et al. 2021; Sollima 2021) and represents a key ingredient in models designed to study the long-term evolution driven by two-body relaxation.
We also confirm that, with a value of approximately 45%, the fraction of FP stars in NGC 2419 is significantly larger than that observed for clusters of similar mass (see also Zennaro et al. 2019). This may be explained by the fact that the orbital properties of NGC 2419 suggest it was originally formed in the Sagittarius dwarf galaxy Massari et al. (2019). We show that a transition from the tidal field of the original host galaxy to the very weak tidal field at the present-day Galactocentric distance would significantly slow the rate of star loss (preferentially affecting FP stars) and halt the evolutionary decrease in the FP fraction.
A tailored set of numerical simulations are needed to build models specifically designed to reconstruct the dynamical history of NGC 2419. The detailed observational characterisation of the FP and SP structural properties presented here provides important constraints for these models and, more generally, for the dynamical study of MP clusters.
Extending this kind of detailed dynamical characterisation to a larger sample of clusters and combination with data on internal kinematics is necessary to build a complete empirical dynamical characterisation of multiple populations.
However, it is worth noting that the detection in younger systems seems to be limited to the main sequence (Cadelano et al. 2022).
It is worth noting that Mg-depleted stars in GCs typically reach values down to [Mg/Fe] ∼ − 0.4 (e.g., Mészáros et al. 2021; Alvarez Garay et al. 2022), making NGC 2419 a peculiar and extreme case.
Acknowledgments
We kindly thank Giacomo Beccari for sharing the LBT photometric catalogue used in this work. M.C. and E.D. acknowledge financial support from the project Light-on-Dark granted by MIUR through PRIN2017-2017K7REXT. E.D. acknowledges support from the Indiana University Institute for Advanced Study through the Visiting Fellowship program. E.V. acknowledges support from NSF grant AST-2009193.
References
- Alvarez Garay, D. A., Mucciarelli, A., Lardo, C., Bellazzini, M., & Merle, T. 2022, ApJ, 928, L11 [NASA ADS] [CrossRef] [Google Scholar]
- Bastian, N., & Lardo, C. 2018, ARA&A, 56, 83 [Google Scholar]
- Bastian, N., Lamers, H. J. G. L. M., de Mink S. E., et al. 2013, MNRAS, 436, 2398 [CrossRef] [Google Scholar]
- Baumgardt, H., & Hilker, M. 2018, MNRAS, 478, 1520 [Google Scholar]
- Beccari, G., Bellazzini, M., Lardo, C., et al. 2013, MNRAS, 431, 1995 [NASA ADS] [CrossRef] [Google Scholar]
- Bekki, K. 2011, MNRAS, 412, 2241 [NASA ADS] [CrossRef] [Google Scholar]
- Bellazzini, M., Dalessandro, E., Sollima, A., & Ibata, R. 2012, MNRAS, 423, 844 [NASA ADS] [CrossRef] [Google Scholar]
- Bellazzini, M., Ibata, R., Malhan, K., et al. 2020, A&A, 636, A107 [NASA ADS] [CrossRef] [EDP Sciences] [Google Scholar]
- Bellini, A., Renzini, A., Anderson, J., et al. 2015, ApJ, 805, 178 [NASA ADS] [CrossRef] [Google Scholar]
- Bohlin, R. C. 2016, AJ, 152, 60 [NASA ADS] [CrossRef] [Google Scholar]
- Cadelano, M., Dalessandro, E., Ferraro, F. R., et al. 2017, ApJ, 836, 170 [NASA ADS] [CrossRef] [Google Scholar]
- Cadelano, M., Chen, J., Pallanca, C., et al. 2020a, ApJ, 905, 63 [NASA ADS] [CrossRef] [Google Scholar]
- Cadelano, M., Dalessandro, E., Webb, J. J., et al. 2020b, MNRAS, 499, 2390 [NASA ADS] [CrossRef] [Google Scholar]
- Cadelano, M., Saracino, S., Dalessandro, E., et al. 2020c, ApJ, 895, 54 [NASA ADS] [CrossRef] [Google Scholar]
- Cadelano, M., Dalessandro, E., Salaris, M., et al. 2022, ApJ, 924, L2 [NASA ADS] [CrossRef] [Google Scholar]
- Calura, F., D’Ercole, A., Vesperini, E., Vanzella, E., & Sollima, A. 2019, MNRAS, 489, 3269 [Google Scholar]
- Carretta, E., Bragaglia, A., Gratton, R. G., et al. 2010, A&A, 520, A95 [NASA ADS] [CrossRef] [EDP Sciences] [Google Scholar]
- Cohen, J. G., & Kirby, E. N. 2012, ApJ, 760, 86 [Google Scholar]
- Cordero, M. J., Hénault-Brunet, V., Pilachowski, C. A., et al. 2017, MNRAS, 465, 3515 [NASA ADS] [CrossRef] [Google Scholar]
- Dalessandro, E., Lanzoni, B., Ferraro, F. R., et al. 2008, ApJ, 681, 311 [NASA ADS] [CrossRef] [Google Scholar]
- Dalessandro, E., Lapenna, E., Mucciarelli, A., et al. 2016, ApJ, 829, 77 [NASA ADS] [CrossRef] [Google Scholar]
- Dalessandro, E., Cadelano, M., Vesperini, E., et al. 2018a, ApJ, 859, 15 [NASA ADS] [CrossRef] [Google Scholar]
- Dalessandro, E., Mucciarelli, A., Bellazzini, M., et al. 2018b, ApJ, 864, 33 [NASA ADS] [CrossRef] [Google Scholar]
- Dalessandro, E., Cadelano, M., Vesperini, E., et al. 2019a, ApJ, 884, L24 [Google Scholar]
- Dalessandro, E., Ferraro, F. R., Bastian, N., et al. 2019b, A&A, 621, A45 [NASA ADS] [CrossRef] [EDP Sciences] [Google Scholar]
- Dalessandro, E., Raso, S., Kamann, S., et al. 2021, MNRAS, 506, 813 [CrossRef] [Google Scholar]
- D’Antona, F., Vesperini, E., D’Ercole, A., et al. 2016, MNRAS, 458, 2122 [Google Scholar]
- Decressin, T., Charbonnel, C., & Meynet, G. 2007, A&A, 475, 859 [CrossRef] [EDP Sciences] [Google Scholar]
- Denissenkov, P. A., & Hartwick, F. D. A. 2014, MNRAS, 437, L21 [Google Scholar]
- D’Ercole, A., Vesperini, E., D’Antona, F., McMillan, S. L. W., & Recchi, S. 2008, MNRAS, 391, 825 [CrossRef] [Google Scholar]
- di Criscienzo, M., D’Antona, F., Milone, A. P., et al. 2011, MNRAS, 414, 3381 [NASA ADS] [CrossRef] [Google Scholar]
- Dotter, A., Chaboyer, B., Jevremović, D., et al. 2008, ApJS, 178, 89 [Google Scholar]
- Ferraro, F. R., Lanzoni, B., Raso, S., et al. 2018, ApJ, 860, 36 [NASA ADS] [CrossRef] [Google Scholar]
- Gaia Collaboration (Brown, A. G. A., et al.) 2021, A&A, 649, A1 [NASA ADS] [CrossRef] [EDP Sciences] [Google Scholar]
- Gieles, M., Charbonnel, C., Krause, M. G. H., et al. 2018, MNRAS, 478, 2461 [Google Scholar]
- Giersz, M., Heggie, D. C., Hurley, J. R., & Hypki, A. 2013, MNRAS, 431, 2184 [NASA ADS] [CrossRef] [Google Scholar]
- Gratton, R., Bragaglia, A., Carretta, E., et al. 2019, A&ARv, 27, 8 [Google Scholar]
- Harris, W. E. 2010, ArXiv e-prints [arXiv:1012.3224] [Google Scholar]
- Hénault-Brunet, V., Gieles, M., Agertz, O., & Read, J. I. 2015, MNRAS, 450, 1164 [CrossRef] [Google Scholar]
- Hypki, A., & Giersz, M. 2013, MNRAS, 429, 1221 [NASA ADS] [CrossRef] [Google Scholar]
- Kamann, S., Dalessandro, E., Bastian, N., et al. 2020a, MNRAS, 492, 966 [NASA ADS] [CrossRef] [Google Scholar]
- Kamann, S., Giesers, B., Bastian, N., et al. 2020b, A&A, 635, A65 [Google Scholar]
- King, I. R. 1966, AJ, 71, 64 [Google Scholar]
- Kroupa, P. 2001, MNRAS, 322, 231 [NASA ADS] [CrossRef] [Google Scholar]
- Lacchin, E., Calura, F., Vesperini, E., & Mastrobuono-Battisti, A. 2022, MNRAS, 517, 1171 [NASA ADS] [CrossRef] [Google Scholar]
- Lanzoni, B., Ferraro, F. R., Dalessandro, E., et al. 2019, ApJ, 887, 176 [NASA ADS] [CrossRef] [Google Scholar]
- Lardo, C., Bellazzini, M., Pancino, E., et al. 2011, A&A, 525, A114 [NASA ADS] [CrossRef] [EDP Sciences] [Google Scholar]
- Larsen, S. S., Brodie, J. P., Grundahl, F., & Strader, J. 2014, ApJ, 797, 15 [NASA ADS] [CrossRef] [Google Scholar]
- Larsen, S. S., Baumgardt, H., Bastian, N., et al. 2015, ApJ, 804, 71 [NASA ADS] [CrossRef] [Google Scholar]
- Larsen, S. S., Baumgardt, H., Bastian, N., Hernandez, S., & Brodie, J. 2019, A&A, 624, A25 [NASA ADS] [CrossRef] [EDP Sciences] [Google Scholar]
- Lee, J.-W. 2015, ApJS, 219, 7 [NASA ADS] [CrossRef] [Google Scholar]
- Lee, J.-W. 2019, ApJ, 883, 166 [NASA ADS] [CrossRef] [Google Scholar]
- Leitinger, E., Baumgardt, H., Cabrera-Ziri, I., Hilker, M., & Pancino, E. 2023, MNRAS, 520, 1456 [NASA ADS] [CrossRef] [Google Scholar]
- Libralato, M., Bellini, A., van der Marel, R. P., et al. 2023, ApJ, 944, 58 [CrossRef] [Google Scholar]
- Lucatello, S., Sollima, A., Gratton, R., et al. 2015, A&A, 584, A52 [NASA ADS] [CrossRef] [EDP Sciences] [Google Scholar]
- Marino, A. F. 2020, in Star Clusters: From the Milky Way to the Early Universe, eds. A. Bragaglia, M. Davies, A. Sills, & E. Vesperini, 351, 261 [NASA ADS] [Google Scholar]
- Martocchia, S., Niederhofer, F., Dalessandro, E., et al. 2018, MNRAS, 477, 4696 [NASA ADS] [CrossRef] [Google Scholar]
- Massari, D., Koppelman, H. H., & Helmi, A. 2019, A&A, 630, L4 [NASA ADS] [CrossRef] [EDP Sciences] [Google Scholar]
- Mészáros, S., Masseron, T., Fernández-Trincado, J. G., et al. 2021, MNRAS, 505, 1645 [Google Scholar]
- Miholics, M., Webb, J. J., & Sills, A. 2015, MNRAS, 454, 2166 [CrossRef] [Google Scholar]
- Milone, A. P., Piotto, G., Bedin, L. R., et al. 2017, MNRAS, 464, 3636 [NASA ADS] [CrossRef] [Google Scholar]
- Mucciarelli, A., Carretta, E., Origlia, L., & Ferraro, F. R. 2008, AJ, 136, 375 [NASA ADS] [CrossRef] [Google Scholar]
- Mucciarelli, A., Bellazzini, M., Ibata, R., et al. 2012, MNRAS, 426, 2889 [Google Scholar]
- Pedregosa, F., Varoquaux, G., Gramfort, A., et al. 2011, J. Mach. Learn. Res., 12, 2825 [Google Scholar]
- Piotto, G., Milone, A. P., Bedin, L. R., et al. 2015, AJ, 149, 91 [Google Scholar]
- Raso, S., Libralato, M., Bellini, A., et al. 2020, ApJ, 895, 15 [NASA ADS] [CrossRef] [Google Scholar]
- Richer, H. B., Heyl, J., Anderson, J., et al. 2013, ApJ, 771, L15 [NASA ADS] [CrossRef] [Google Scholar]
- Sbordone, L., Salaris, M., Weiss, A., & Cassisi, S. 2011, A&A, 534, A9 [CrossRef] [EDP Sciences] [Google Scholar]
- Sills, A., Dalessandro, E., Cadelano, M., Alfaro-Cuello, M., & Kruijssen, J. M. D. 2019, MNRAS, 490, L67 [Google Scholar]
- Simioni, M., Milone, A. P., Bedin, L. R., et al. 2016, MNRAS, 463, 449 [NASA ADS] [CrossRef] [Google Scholar]
- Smolinski, J. P., Hoogendam, W. B., Van Kooten, A. J., Benac, P., & Bruce, Z. J. 2020, AJ, 160, 208 [NASA ADS] [CrossRef] [Google Scholar]
- Sollima, A. 2021, MNRAS, 502, 1974 [NASA ADS] [CrossRef] [Google Scholar]
- Stetson, P. B. 1987, PASP, 99, 191 [Google Scholar]
- Stetson, P. B. 1994, PASP, 106, 250 [Google Scholar]
- Vanzella, E., Calura, F., Meneghetti, M., et al. 2017, MNRAS, 467, 4304 [Google Scholar]
- Vesperini, E., McMillan, S. L. W., D’Antona, F., & D’Ercole, A. 2013, MNRAS, 429, 1913 [Google Scholar]
- Vesperini, E., Hong, J., Webb, J. J., D’Antona, F., & D’Ercole, A. 2018, MNRAS, 476, 2731 [NASA ADS] [CrossRef] [Google Scholar]
- Vesperini, E., Hong, J., Giersz, M., & Hypki, A. 2021, MNRAS, 502, 4290 [NASA ADS] [CrossRef] [Google Scholar]
- Zennaro, M., Milone, A. P., Marino, A. F., et al. 2019, MNRAS, 487, 3239 [CrossRef] [Google Scholar]
All Tables
All Figures
|
Fig. 1. Sky distribution of the surveyed stars measured with respect to the cluster gravitational centre. Grey points are stars from the HST adopted dataset and the LBT wide-field catalogue by Beccari et al. (2013). The black polygon marks the boundaries of the HST FoV. The golden cross marks the cluster gravitational centre, while the dashed and solid circles correspond to the cluster half mass and tidal radius, respectively. |
| In the text | |
|
Fig. 2. CMDs of NGC 2419 and verticalised RGB colour distribution obtained through the HST observations. Panel a1: gray dots are the (mF438W, mF438W − mF814W) optical CMD, black dots are the selected RGB stars. The red and blue curves are the fiducial lines adopted to verticalise the RGB sequence. Panel a2: verticalised colour distribution of the selected RGB stars. The red and blue vertical lines correspond to the red and blue curves in panel a1. Panel b1: same as in panel a1 but for the (mF814W, CF336W, F343N, F438W) CMD. Panel b2: same as in panel a2 but for the filter combination used in panel b1. |
| In the text | |
|
Fig. 3. Chromosome map of NGC 2419 RGB stars. Panel a: different populations as selected through the GMM algorithm are highlighted with different colours. A larger marker size indicates an higher probability that a given star belongs to the assigned population. The confidence ellipsoids of each subpopulation fitted with the GMM algorithm are also plotted. Panel b: Histograms of the distribution along ΔF336W, F343N, F438W of the total population and of each subpopulation. Panel c: same as in panel b, but for the distribution along ΔF438W, F814W. |
| In the text | |
|
Fig. 4. CMDs of NGC 2419 and verticalised RGB colour distribution obtained through the LBT observations. Left-hand panel: I, CuVI CMD of NGC 2419 from the LBT stars in common with the HST catalogue. Red and blue dots are objects classified in the HST dataset as FP and SP stars, respectively. Right-hand panels: top panel shows the verticalised distribution of the CuVI colour. Red and blue dots are the same as in the left-hand panel. The vertical line is adopted as the separation between FP and SP stars for the LBT stars observed in the area complementary to the HST FoV. The bottom panel shows the histograms of the verticalised CuVI distributions for FP and SP stars. |
| In the text | |
|
Fig. 5. Distribution of the observed fraction of FP stars (as obtained in Milone et al. 2017 – black circles) as a function of cluster mass (from Baumgardt & Hilker 2018). The red square shows the location of NGC 2419 based on the results found in this paper. |
| In the text | |
|
Fig. 6. Time evolution of the ratio of the FP mass to the total cluster mass as obtained by Monte Carlo simulations described in Sect. 3. The black curve corresponds to the simulation in which a cluster was formed and spent its entire lifetime within a Sagittarius-like galaxy. The red and blue curves describe the MFP/MTOT evolution if the cluster is accreted by a Milky Way-like galaxy 2 − 3 Gyr and 4 − 5 Gyr after its formation, respectively. |
| In the text | |
|
Fig. 7. Stellar density profiles of MPs in NGC 2419. Top panel: density profile of FP stars. Empty and solid circles mark the observed and decontaminated density profiles of FP stars, respectively. The red dashed curve is the best-fit profile with a King model and the red stripe marks the envelope of the ±1σ solutions. The dashed, dot-dashed, and dotted vertical lines mark the best-fit core, half-mass, and tidal radii, respectively, and their corresponding 1σ uncertainties are represented with the grey stripes. The fit residuals are plotted in the bottom panel. The best-fit structural parameters are reported in the inset box. Bottom panel: same as in top panel but for SP stars. |
| In the text | |
|
Fig. 8. Two-dimensional density maps and isodensity contours of the FP and SP stars in the top and bottom panels, respectively. |
| In the text | |
|
Fig. 9. 2D density maps and isodensity contours for the HST stars and belonging to the FP (left-hand top panel), SPA (right-hand top panel), SPB (left-hand bottom panel) and SPC (right-hand bottom panel). |
| In the text | |
|
Fig. 10. Ellipticity and position angle (top and bottom panel, respectively) of the isodensity contours shown in Fig. 9 for the different sub populations, as a function of the radial distance from the cluster center. The angles are measured counterclockwise with the origin set along the east direction. |
| In the text | |
|
Fig. 11. Cumulative radial distributions of the four subpopulations of NGC 2419 detected within the HST FoV (the colour code is the same as that used in Fig. 3). |
| In the text | |
|
Fig. 12. Cumulative radial distribution of FP stars (red curve) and SP stars (blue curve) obtained by combining the HST and LBT datasets. The top panel shows the distribution of stars across the whole cluster extension, while the bottom panel shows the distribution within twice the cluster half-light radius. |
| In the text | |
|
Fig. 13.
|
| In the text | |
Current usage metrics show cumulative count of Article Views (full-text article views including HTML views, PDF and ePub downloads, according to the available data) and Abstracts Views on Vision4Press platform.
Data correspond to usage on the plateform after 2015. The current usage metrics is available 48-96 hours after online publication and is updated daily on week days.
Initial download of the metrics may take a while.