Fig. 3.
Download original image
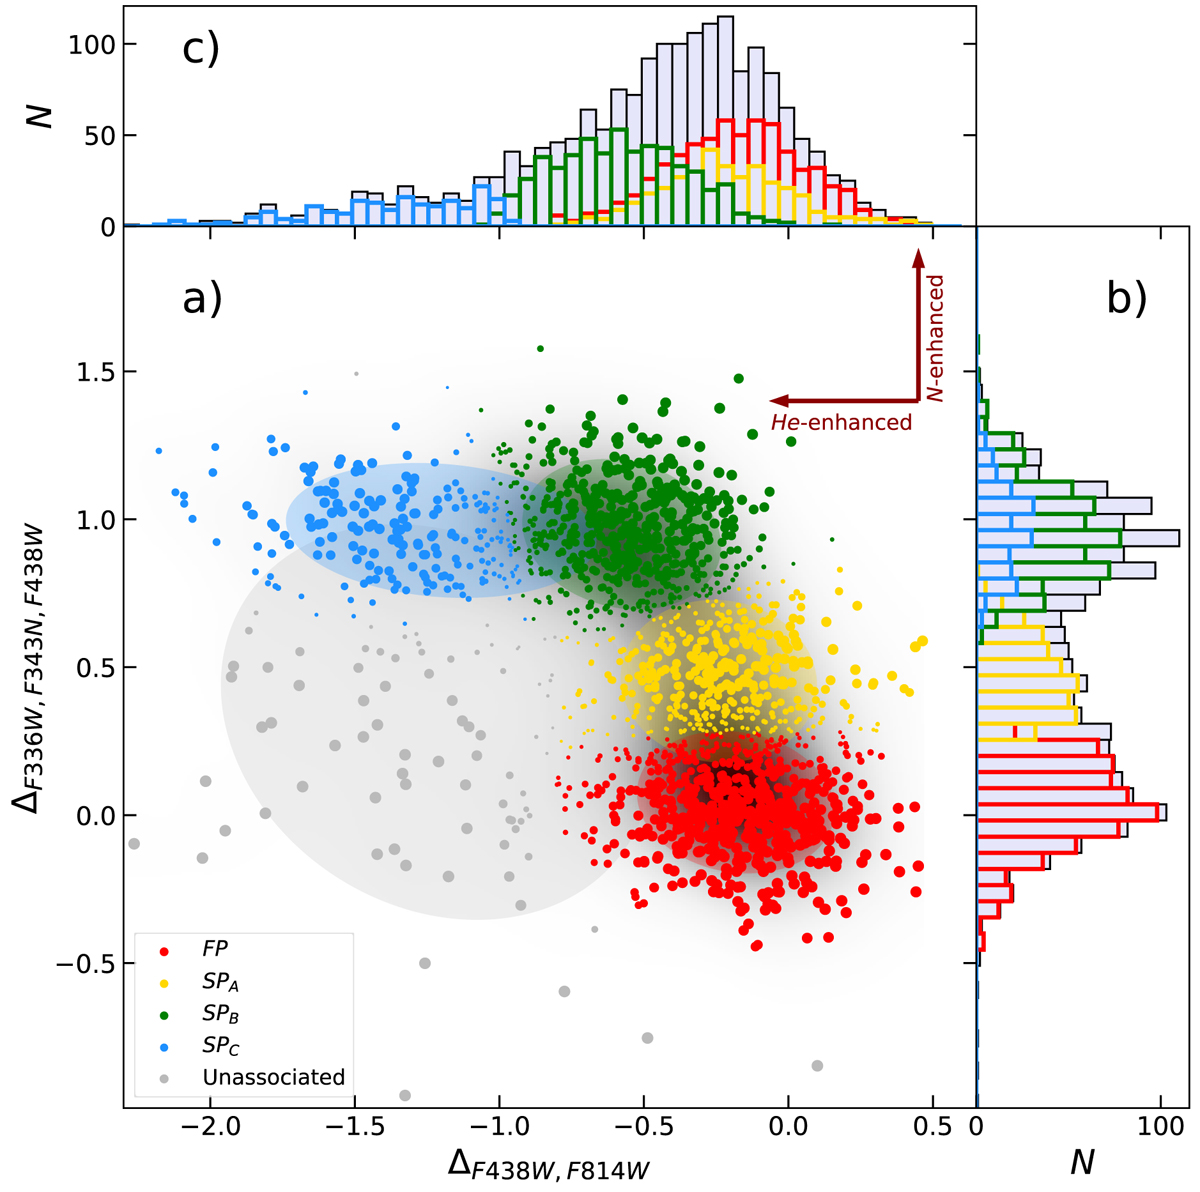
Chromosome map of NGC 2419 RGB stars. Panel a: different populations as selected through the GMM algorithm are highlighted with different colours. A larger marker size indicates an higher probability that a given star belongs to the assigned population. The confidence ellipsoids of each subpopulation fitted with the GMM algorithm are also plotted. Panel b: Histograms of the distribution along ΔF336W, F343N, F438W of the total population and of each subpopulation. Panel c: same as in panel b, but for the distribution along ΔF438W, F814W.
Current usage metrics show cumulative count of Article Views (full-text article views including HTML views, PDF and ePub downloads, according to the available data) and Abstracts Views on Vision4Press platform.
Data correspond to usage on the plateform after 2015. The current usage metrics is available 48-96 hours after online publication and is updated daily on week days.
Initial download of the metrics may take a while.