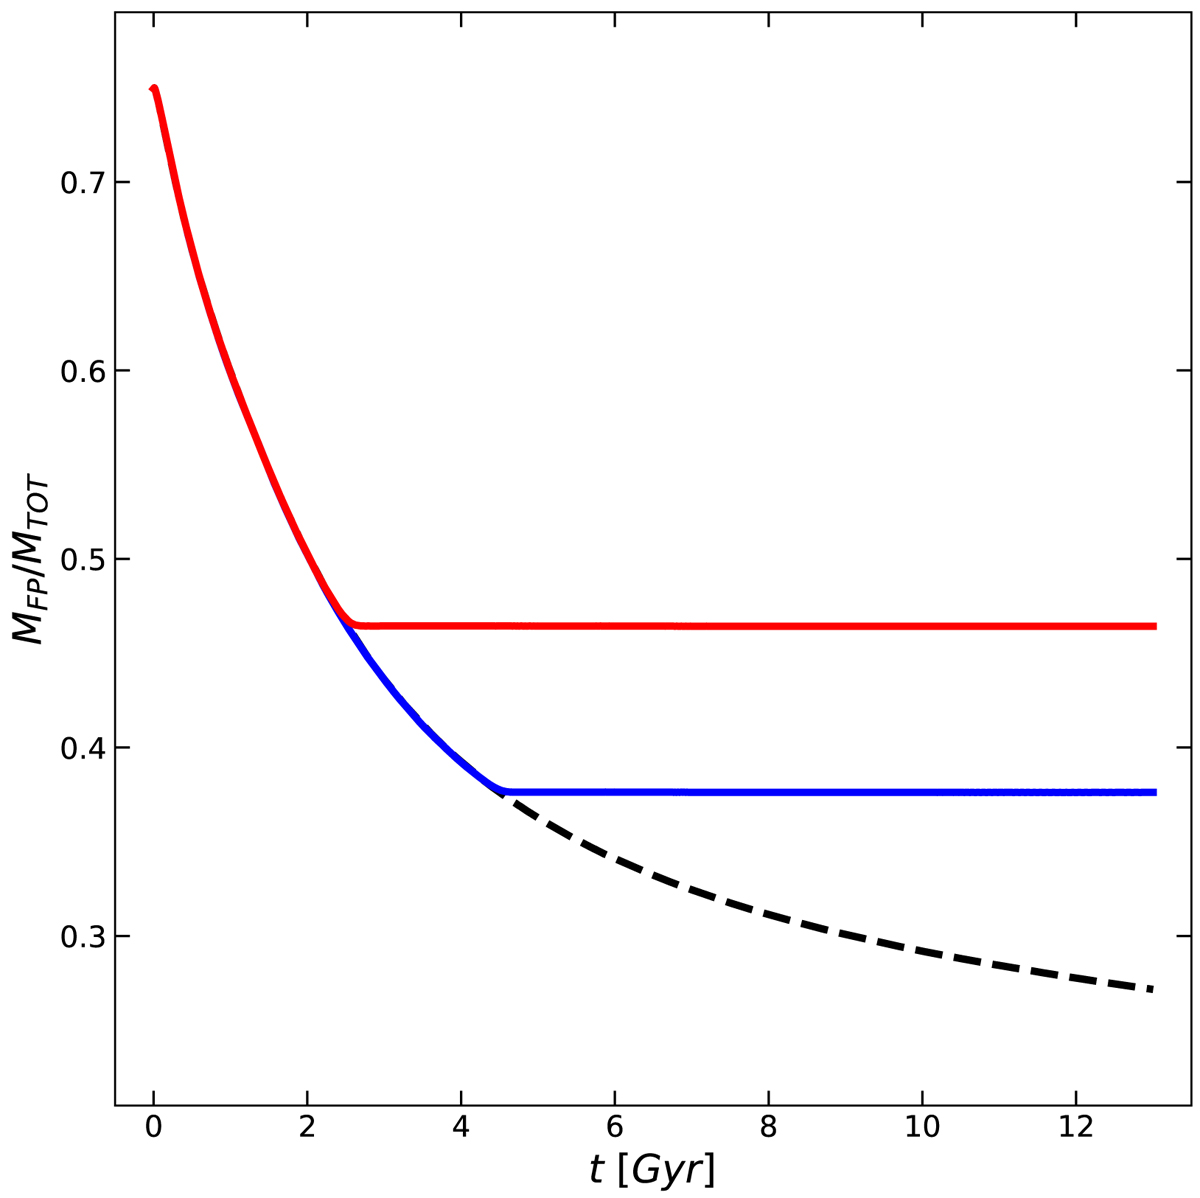
Fig. 6.
Download original image
Time evolution of the ratio of the FP mass to the total cluster mass as obtained by Monte Carlo simulations described in Sect. 3. The black curve corresponds to the simulation in which a cluster was formed and spent its entire lifetime within a Sagittarius-like galaxy. The red and blue curves describe the MFP/MTOT evolution if the cluster is accreted by a Milky Way-like galaxy 2 − 3 Gyr and 4 − 5 Gyr after its formation, respectively.
Current usage metrics show cumulative count of Article Views (full-text article views including HTML views, PDF and ePub downloads, according to the available data) and Abstracts Views on Vision4Press platform.
Data correspond to usage on the plateform after 2015. The current usage metrics is available 48-96 hours after online publication and is updated daily on week days.
Initial download of the metrics may take a while.