Fig. 13.
Download original image
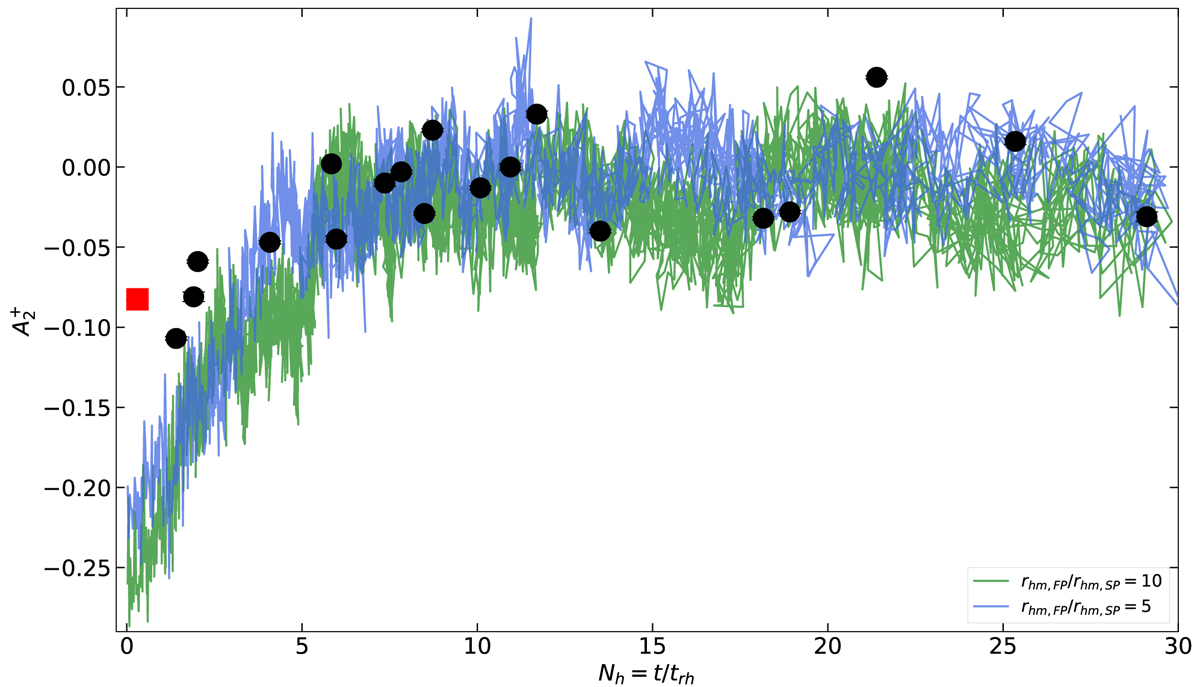
![]() parameter as a function of dynamical age Nh. The black circles are the GCs analysed in Dalessandro et al. (2019a; see also Smolinski et al. 2020), and the red square is NGC 2419. The blue and green lines show the results of the N-body simulations presented by Dalessandro et al. (2019a) following the
parameter as a function of dynamical age Nh. The black circles are the GCs analysed in Dalessandro et al. (2019a; see also Smolinski et al. 2020), and the red square is NGC 2419. The blue and green lines show the results of the N-body simulations presented by Dalessandro et al. (2019a) following the ![]() evolution of clusters born with a FP half-mass radius of five and ten times larger than that of SP stars, respectively.
evolution of clusters born with a FP half-mass radius of five and ten times larger than that of SP stars, respectively.
Current usage metrics show cumulative count of Article Views (full-text article views including HTML views, PDF and ePub downloads, according to the available data) and Abstracts Views on Vision4Press platform.
Data correspond to usage on the plateform after 2015. The current usage metrics is available 48-96 hours after online publication and is updated daily on week days.
Initial download of the metrics may take a while.