| Issue |
A&A
Volume 675, July 2023
|
|
|---|---|---|
| Article Number | A54 | |
| Number of page(s) | 16 | |
| Section | Planets and planetary systems | |
| DOI | https://doi.org/10.1051/0004-6361/202346154 | |
| Published online | 03 July 2023 | |
BEAST detection of a brown dwarf and a low-mass stellar companion around the young bright B star HIP 81208★
1
Institutionen för astronomi, Stockholms universitet, AlbaNova universitetscentrum,
Roslagstullsbacken 21,
106 91
Stockholm, Sweden
e-mail: gayathri.viswanath@astro.su.se
2
INAF - Osservatorio Astronomico di Padova,
Vicolo dell’Osservatorio 5,
35122
Padova, Italy
3
LESIA, Observatoire de Paris, Université PSL, CNRS, Sorbonne Université, Université de Paris,
5 place Jules Janssen,
92195
Meudon, France
4
Cornell Center for Astrophysics and Planetary Science, Department of Astronomy, Cornell University,
404 Space Sciences Building,
Ithaca, NY
14853, USA
5
Jet Propulsion Laboratory, California Institute of Technology,
4800 Oak Grove Drive,
Pasadena CA
91109, USA
6
Department of Physics and Astronomy, University of Rochester,
500 Wilson Blvd,
Rochester, NY
14627, USA
7
Landessternwarte, Zentrum für Astronomie der Universität Heidelberg,
Königstuhl 12,
69117
Heidelberg, Germany
8
Laboratoire J.-L. Lagrange, Université Cote d’Azur, CNRS, Observatoire de la Cote d’Azur, Boulevard de l’Observatoire,
CS 34229,
06304
Nice Cedex 4, France
9
University of Grenoble Alpes, IPAG,
CS 40700,
38058
Grenoble Cedex 9, France
10
Aix Marseille Université, CNRS, LAM, Pôle de l’Étoile Site de Château-Gombert,
38 rue Frédéric Joliot-Curie,
13388
Marseille Cedex 13, France
11
ETH Zurich,
Rämistrasse 101,
8092
Zurich, Switzerland
12
Max Planck Institut für Astronomie,
Königstuhl 17,
69117
Heidelberg, Germany
13
Observatoire de Geneve, University of Geneva,
Ch. de Pegasi 51,
1290
Versoix, Switzerland
14
CRAL, UMR 5574, CNRS,
Université Lyon 1, 9 avenue Charles André,
69561
Saint-Genis-Laval Cedex, France
15
Department of Astronomy, University of Michigan,
1085 S. University Ave,
Ann Arbor, MI
48109, USA
Received:
15
February
2023
Accepted:
7
May
2023
Recent observations by the B-star Exoplanet Abundance Study (BEAST) illustrate the existence of substellar companions around very massive stars. Here, we present the detection of two lower mass companions to a relatively nearby (148.7−1.3+1.5 pc), young (17−4+3 Myr), bright (V = 6.632 ± 0.006 mag), 2.58 ± 0.06 M⊙ B9V star HIP 81208 residing in the Sco-Cen association using the Spectro-Polarimetric High-contrast Exoplanet REsearch (SPHERE) instrument at the Very Large Telescope (VLT) in Chile. Our analysis of the photometry obtained gives mass estimates of 67−7+6 MJ for the inner companion and 0.135−0.013+0.010 M⊙ for the outer companion, indicating that the former is most likely a brown dwarf and the latter a low-mass star. The system is compact but unusual, as the orbital planes of the two companions are likely close to orthogonal. The preliminary orbital solutions we derive for the system indicate that the star and the two companions are likely in a Kozai resonance, rendering the system dynamically very interesting for future studies.
Key words: planets and satellites: detection / brown dwarfs / stars: early-type / techniques: imaging spectroscopy / surveys
© The Authors 2023
 Open Access article, published by EDP Sciences, under the terms of the Creative Commons Attribution License (https://creativecommons.org/licenses/by/4.0), which permits unrestricted use, distribution, and reproduction in any medium, provided the original work is properly cited.
This article is published in open access under the Subscribe to Open model. Subscribe to A&A to support open access publication.
1 Introduction
Most known exoplanets are detected through transit and radial velocity techniques because of the exquisite sensitivity of these latter to planets in small orbits around their host stars (e.g. Mayor & Queloz 1995; Winn et al. 2011). However, both techniques are much less sensitive to planets in wide orbits (several au or larger), and therefore this class of planets has been much less explored. In recent years, a growing population of wide planets has been discovered with direct imaging (e.g. Macintosh et al. 2015; Chauvin et al. 2017; Keppler et al. 2018; Bohn et al. 2020) and, to an increasing extent, in synergy with astrometry (e.g. Brandt et al. 2021; Lacour et al. 2021; Hinkley et al. 2023; Franson et al. 2023; Currie et al. 2023). These techniques are also sensitive to brown dwarf companions (e.g. Janson et al. 2012; Crepp et al. 2016; Currie et al. 2020); while such companions are rare, their high masses and brightnesses make them suitable for detailed characterisation, which can be used to form important links in our understanding of atmospheric conditions down to progressively smaller substellar masses and temperatures.
Direct imaging surveys (e.g. Uyama et al. 2017; Nielsen et al. 2019; Launhardt et al. 2020; Vigan et al. 2021) have studied wide planet and brown dwarf companion demographics in a range of stellar system types, including binaries (e.g. Bonavita et al. 2016; Asensio-Torres et al. 2018), debris disk systems (e.g. Janson et al. 2013; Meshkat et al. 2017), and stars of different masses (e.g. Bowler et al. 2012; Delorme et al. 2012; Wagner et al. 2022). Studying substellar companion demographics as a function of stellar mass can yield insights into the planet and brown dwarf formation processes, and in this context, the most massive stars in the solar neighbourhood, namely B stars, represent an important part of the puzzle. To probe this regime deeply for the first time, we initiated the B-star Exoplanet Abundance Study (BEAST; see Janson et al. 2021a), which is a high-contrast imaging survey using the Spectro-Polarimetric High-contrast Exoplanet REsearch (SPHERE; Beuzit et al. 2019) Extreme Adaptive Optics instrument at the Very Large Telescope (VLT) in Chile to study 85 B stars in the nearby young Sco-Cen region (de Zeeuw et al. 1999). Currently ongoing, BEAST has already discovered several new planets and low-mass substellar companions (Janson et al. 2019, 2021b; Squicciarini et al. 2022).
Here, we report the discovery of two low-mass companions, both in a dynamically unusual orbital configuration around the B9 star HIP 81208. The paper is structured as follows: in Sect. 2, we give the details of the observation of the target and subsequent data reduction. In Sect. 3, we describe the target star and derive some of its basic parameters. Section 4 describes the main results from this work, including characterisation of the candidate properties, a detailed analysis of the spectrum of the inner companion candidate, and analysis of the orbits of the two companion candidates, as well as a discussion on the dynamical stability of the system. The main conclusions from this study are outlined in Sect. 5.
2 Observations and data reduction
The target system, HIP 81208, was observed twice with the SPHERE instrument at the Very Large Telecsope (VLT), both in the context of BEAST. The first observation was acquired on 6 Aug 2019 (MJD 58701.02), and a second-epoch follow-up observation was acquired on 5 April 2022 (MJD 59674.35). Both observations used the standard settings for BEAST (Janson et al. 2021a) in the IRDIFS-EXT mode (Zurlo et al. 2014), which allows simultaneous low-resolution YJH-band spectroscopy using the Integral Field Spectrograph (IFS; Beuzit et al. 2019) and dual-band imaging in the K band with the K12 filter-pair (Vigan et al. 2010) using the Infra-Red Dual-band Imager and Spectrograph (IRDIS; Beuzit et al. 2019).
The main observational sequence was executed in pupil-stabilised mode – which facilitates angular differential imaging (ADI, see Marois et al. 2006) reductions – and utilised the N-ALC-YJH-S coronagraph to enhance the instrumental contrast close to the parent star. This long coronagraphic sequence was complemented by two short pairs of images: A short unsaturated (non-coronagraphic) exposure of the star was acquired before and after the sequence for spectrophotometric calibration purposes, and a short coronagraphic exposure was taken with the so-called waffle mode (Cantalloube et al. 2019) turned on, which generates satellite images of the primary star for astrometric calibration purposes. An empty sky frame was also included in the observational procedure for the purpose of sky subtraction. The long coronagraphic sequence consisted of 16 frames, with three subintegrations of 64 s each. The total integration time on-target was therefore 3072 s in each epoch. The total field rotations during the observations were 51.9 deg in the 2019 epoch and 57.5 deg in the 2022 epoch.
Data reduction was performed according to the regular BEAST procedure (Janson et al. 2021a), with the SPHERE Data Center1 (Delorme et al. 2017) software based on the SPHERE pipeline (Pavlov et al. 2008) for all basic calibration steps including dark and sky subtraction, flat fielding, and spectral extraction. For pixel scale, true north orientation and pupil offset, we used the long-term values given in Maire et al. (2021), which are based on a 5-yr analysis of the astrometric stability of SPHERE that relies on observations of star clusters taken at regular intervals. Accordingly, for both epochs, the pixel scale adopted for IRDIS was 12.258±0.004 mas pixel−1 for K1 band and 12.253±0.003 mas pixel−1 in the K2 band, while the pixel scale for IFS was 7.46 ± 0.02 mas pixel−1. The true north orientation used was −1.77±0.04 deg and the pupil offset was 136± 0.03 deg. For ADI reduction purposes, we used SpeCal (Galicher et al. 2018) for IRDIS in Template Locally Optimised Combination of Images (TLOCI; Marois et al. 2014) mode, and a pipeline for IFS based on Karhunen-Loève Image Projection (KLIP, see e.g. Soummer et al. 2012).
3 Stellar properties
HIP 81208 (alias HD 149274, TYC 7357-207-1, TIC 280474618, Gaia DR3 6020514769906985728, 2MASS J16351384-3543287) is a young bright (V = 6.632 ± 0.006 mag) B9V star (Houk 1982) residing in the Upper Centaurus Lupus (UCL) subregion of the Sco-Cen stellar association (Hoogerwerf 2000), at a distance of  from Earth. Some basic measurements of the star obtained from the literature are listed in Table 1.
The current literature gives no indication of a binary companion to HIP 81208. A potentially interesting Gaia star in the vicinity of HIP 81208 is discussed in Sect. 4.6. The proper motion anomaly (PMa) between the long-term HIPPARCOS-Gaia DR3 and short-term Gaia DR3 proper motion vectors is very low (PMaRA = 0.063 ± 0.056 mas yr−1, PMaDE = 0.090 ± 0.041 mas yr−1; see Kervella et al. 2022), ruling out the existence of any (>0.05 M⊙) binary companion to the star within 3–30 au. There is also no hint of a faint or unresolved astro-metric binary companion within 2–20 au of the star in Gaia DR2, as inferred from the low value of the renormalised unit weight error (RUWE), of namely ρ = 0.898 (Belokurov et al. 2020). Additionally, Stock (2021) analysed the 26 XSHOOTER (Vernet et al. 2011) spectra available in the ESO archive and derived radial velocities with a precision of around 2 km s−1. The radial velocities cover a period of slightly less than 8 yr from 2010 to 2017 and have an rms of about 5 km s−1. The analysis revealed no indications of periodic variations, except for a slightly significant period of 1 yr, which can also be seen in the window function. From this, we conclude that there are no indications of spectroscopic companions to HIP 81208 in the XSHOOTER radial velocities. In the following subsections, we constrain the main parameters of the target, a summary of which is also listed in Table 2.
3.1 Extinction and reddening
Gaia DR3 lists a monochromatic extinction estimate of  mag for the target at λ0 = 541.4 nm (see Creevey et al. 2023, for the definition of A0). AV, the extinction in the Johnson V band centred at ~548 nm, is dependent on the spectrum of the emitting source in the V band and hence is intrinsically different from A0, which is a property of the interstellar medium alone and is affected only by the amount of absorption therein. However, this dependence of AV on the source spectrum is often negligible, especially for small extinctions (A0 < 2 mag), at which A0 and AV follow an almost identity relation (see Fig. 11.4(a) in the Gaia DR3 online documentation2). Therefore, in this case, A0 can be taken as a rough approximation of AV for our target. The STILISM reddening maps3 from Lallement et al. (2018) at the position and distance of HIP 81208 gives a reddening estimate of E(B–V) = 0.011 ± 0.021 mag, which can be translated to an AV value of 0.034 ± 0.064 mag using the relation AV = 3.07×E(B–V) (McCall 2004, appropriate for lightly reddened A0 V stars). Examination of the reddening values for stars within ±4° of the position of HIP 81208 in the Reis et al. (2011) catalogue shows that stars in its vicinity are negligibly reddened until a distance of ~160 pc, and the stars in the distance range 170–180 pc have AV = 0.1–0.2 mag. In particular, four stars (HD 147493, HD147387, HD147149, HD147597) in the immediate vicinity of HIP 81208, with distances of 146–150 pc, have negligible reddening values of E(B–V) = 0.000 ± 0.008, −0.008 ± 0.011, 0.003 ± 0.012, and 0.009 ± 0.011 mag, respectively, with an inferred AV = 0.00 ± 0.03, −0.03 ± 0.05, 0.01 ± 0.05, and 0.04 ± 0.05 mag, respectively. Given the similar distances and positions of these stars in the sky to our target, one can expect them to have comparable reddening and extinction to HIP 81208.
An independent estimate of the reddening and extinction of this B star can be obtained from UBV photometry using the Q-method to calculate the reddening-free Q index (e.g. Johnson & Morgan 1953, see Appendix C.3 of Pecaut & Mamajek 2013). Adopting the U–B colour from Slawson et al. (1992) and the B–V colour from ESA (1997), and the updated calibration of the Q-index to the dereddened (B–V)0 and (U–B)0 colours from Pecaut & Mamajek (2013), we estimate the intrinsic colours to be (B–V)0 = −0.075 ± 0.003 mag and (U–B)0 = −0.228 ± 0.013 mag, with reddening E(B–V) = 0.026 ± 0.009 mag and extinction AV = 0.085 ± 0.030 mag. Additionally, a fit of the Pecaut & Mamajek (2013) main sequence (MS) colour grid to the UBVJHKs photometry for HIP 81208, allowing the E(B–V) to vary, reveals that the reduced χ2 < 1 fits result in estimates of Teff = 10970 ± 350K, E(B–V) = 0.020 ± 0.013 mag and AV=0.064± 0.041 mag for the target.
Both the reddening estimates derived above – using the Q-method and the spectral energy distribution (SED) fitting – rely heavily on the UBV photometry for a single star, namely HIP 81208, and are therefore not independent. However, both these estimates (E(B–V) ≤ 0.02±0.02 mag) are consistent with the STILISM reddening map from Lallement et al. (2018) (E(B–V) = 0.011±0.021 mag), which has the benefit of having already been published, and in addition is also a reddening estimate averaged over a number of stars of varying distances and positions in the vicinity of HIP 81208. The latter estimate is therefore more robust than the other estimates of reddening derived or cited in this section, although the consistency between them adds to its confidence. We therefore adopt the STILISM value of reddening and the inferred interstellar extinction of AV = 0.034±0.064 mag for the target hereafter in this paper.
Basic stellar parameters for HIP 81208 from the literature.
A summary of all the stellar parameters estimated for HIP 81208 in this work.
3.2 Spectral energy distribution and effective temperature
We used the Virtual Observatory SED analyzer (VOSA4) version 7.5 to query for the photometry of HIP 81208 and fit synthetic stellar spectra to the data. The observed spectrum for 78 photometric data points is shown in Fig. 1. We removed several discrepant or redundant photometry points, namely the synthetic Gaia DR3 data (for e.g. U, B, V, R, I) as they were dependent on other available Gaia DR3 photometry, and APASS Sloan photometry. Gaia DR3 photometry from binned Bp and Rp spectra account for 66 of the data points, along with the Gaia DR3 GBP/G/GRP points, and photometry from Tycho (BT, VT), APASS (B, V), 2MASS (J, H, Ks), WISE (W1, W2, W3, W4). For the SED fitting, we assumed a prior range of AV = 0.034 ± 0.064 mag. Using Kurucz 2003 [a/Fe] = 0.0 models (Castelli & Kurucz 2003), the best overall fit that fits all 78 data points had the following parameters:
AV = −0.03 mag, Teff = 10750 ± 125 K, log(g) = 4, [M/H] = −1, ℱbol = (8.43 ± 0.03) × 10−8 erg cm−2 s−1, and ℒbol = 58.27 ± 1.304 ℒ⊙ (log(ℒ/ℒ⊙) = 1.765 ± 0.01). The existing photometry as well as the obtained SED fit do not show any infrared excess up to ~10 µm (see lower panel of Fig. 1), which indicates the possible absence of any disk around HIP 81208. The SED fitting clearly favours models with negligible or zero reddening. The parameters all seem reasonable, except for the low metallicity, which was also found by the Gaia DR3 GSP Phot Aeneas fit to the Bp/Rp spectra (![$\left[ {{M \mathord{\left/ {\vphantom {M H}} \right. \kern-\nulldelimiterspace} H}} \right] = - 1.27_{ - 0.21}^{ + 0.39}$](/articles/aa/full_html/2023/07/aa46154-23/aa46154-23-eq10.png) ). Such a low metallicity is unexpected as the metallicity of Sco-Cen is essentially solar; however, the B9V star may be suffering from some abundance anomaly or other effect (e.g. fast rotation), which may be biasing the SED fitting.
). Such a low metallicity is unexpected as the metallicity of Sco-Cen is essentially solar; however, the B9V star may be suffering from some abundance anomaly or other effect (e.g. fast rotation), which may be biasing the SED fitting.
We obtained a Teff = 10 970 K from the SED fit of the MS colour grid to the UBVJHKs photometry in Sect. 3.1. From the inferred colours from the Q-method described in the same section, the latest version of the Pecaut & Mamajek (2013) table5 suggests that these values of intrinsic colours correspond to a Teff of 11130± 110 K (and indeed very typical for B9V dwarfs).
Furthermore, the star’s spectral type itself (B9V) suggests a Teff of approximately 10 700 K based on values for B9V standard stars by Pecaut & Mamajek (2013).
An additional independent Teff estimate can be derived from the Hβ photometry, β = 2.842±0.005 mag (see Slawson et al. 1992). Using the ATLAS9 model grid from Castelli & Kurucz (2003) for assumed atmospheric parameters log(g) = 4.0, [M/H] =0, and υturb = 2 km s−1, the Slawson Hβ value corresponds to Teff = 10 654 K (we note that adopting υturb = 0 km s−1 has negligible effect, yielding Teff = 10 679 K).
We therefore derived several Teff estimates ranging from 10 654 K to 11 130 K. These five estimates are not quite fully independent, as three of the estimates are connected to the Pecaut & Mamajek (2013) dwarf colour/Teff sequences, but they are consistent with an approximate Teff of 10 840±220 K (rms). This value is within 2.5σ of the Gaia DR3 GSP-phot Aeneas estimate of  .
.
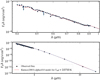 |
Fig. 1 Spectral energy distribution of HIP 81208 obtained with 78 existing photometry points retrieved from VOSA. Also shown is the best-fit stellar model (Kurucz ODFNEW /NOVER, alpha: 0.0 (2003); Castelli & Kurucz 2003) for a Teff = 10 750 K. |
3.3 Luminosity and radius
We calculated a new bolometric luminosity for our target from the AV and Teff obtained in Sects. 3.1 and 3.2 and V mag from Table 1. We converted V to mbol using a bolometric correction of BCυ = −0.447 mag, obtained from interpolating the PM2013 table (refer footnote 5) for a Teff = 10 840 K. The resulting apparent bolometric magnitude is mbol = 6.154 ± 0.064mag. At a distance of 148.7 pc, this corresponds to the absolute magnitude Mbol = 0.292 ± 0.080 mag. This translates to an equivalent luminosity of ℒbol = 60.69 ± 4.46 ℒ⊙ (log(ℒ/ℒ⊙) = 1.783 ± 0.032), which is consistent with previous ℒbol values for HIP 81208 in the literature (e.g. Anderson & Francis 2012).
Using the above derived value for ℒbol and the Teff estimate from Sect. 3.2 (10 840 ± 220 K), we can arrive at an estimate for the radius of the target using the Stefan-Boltzmann law, which gives  .
.
3.4 Stellar age
The stellar age was constrained using the method of isochronal dating of co-moving stars (CMS) introduced in the previous BEAST publications, namely Janson et al. (2021a) and Squicciarini et al. (2022). We adopted the long-term proper motion for HIP 81208 reconstructed by Kervella et al. (2022) for this purpose. The sample of co-moving stars was constructed by querying the Gaia DR3 catalogue within a search radius of 5 deg around the location of our target, for sources possessing similar 2D-projected space motion. A clump of 86 such sources was identified in the velocity space (υα, υδ) through the following cuts on velocity and parallax (ϖ):
 (1)
(1)
Based on their photometry from Gaia DR3 (G, GBP, GRP) and 2MASS (J, H, Ks) bands, we subsequently derived the isochronal ages and masses for all the stars in the group using the MADYS tool (Squicciarini & Bonavita 2022). Three independent evolutionary models, all assuming solar metallicities, were employed to ensure the robustness of the results: BHAC15 (Baraffe et al. 2015), PARSEC (Marigo et al. 2017), and MIST (Choi et al. 2016). The sample was then divided into five mass bins: M/M⊙≤0.4, 0.4<M/M⊙≤0.6, 0.6<M/M⊙≤0.8, 0.8<M/M⊙≤1.4, M/M⊙>1.4. We restricted our age analysis to the most reliable bin of stellar mass (0.8 M⊙ < M ≤ 1.4 M⊙), which contains 9 out of the 86 stars in the sample. The small number of stars in this bin is a consequence of the shape of the initial mass function (IMF; 53 of the fitted stars were M-type stars, i.e. M < 0.6 M⊙) and the fact that not all the stars could be successfully fitted because of factors such as non-optimal quality of photometric data or unresolved binarity. Using the chosen mass bin, we were able to derive a well-defined group age estimate  , which is consistent with previous age estimates for UCL, such as those of Mamajek et al. (2002, 17±1 Myr) and Pecaut et al. (2012, 16±1 Myr).
3.5 Stellar mass and log(g)
To estimate the stellar mass, we used the Parsec tracks (Bressan et al. 2012) version 1.2S (Chen et al. 2015) with AV = 0.034 mag and metallicity [M/H] = 0 and age = 17 Myr. We interpolated for Teff = 10840±220 K and log(ℒ/ℒ⊙) = 1.7831 ±0.0319 to get an estimate for the mass of the star, ℳ* = 2.58±0.06 ℳ⊙, and its surface gravity, log(g) = 4.201±0.011. Uncertainties for ℳ* and log(ɡ) were derived using the upper and lower limits for Teff(±220 K) and log(ℒ/ℒ⊙) (±0.0319). To get the upper limit on the mass and surface gravity, we interpolated the Parsec tracks for ℳ* and log(g) corresponding to Teff = 11060 K and log(ℒ/ℒ⊙) = 1.815. Similarly, to get the lower limits, we interpolated using Teff = 10620 K and log(ℒ/ℒ⊙) = 1.7512. The average of the uncertainties derived from the respective upper and lower limits of ℳ* and log(g) obtained in this way are quoted as the uncertainty for these parameters in this section. The values for ℳ* and log(ɡ) derived here are also consistent with the literature (see e.g. Anders et al. 2022).
4 Results and discussion
Post-processing of the IFS image using ADI reveals a candidate companion, HIP 81208B, at a projected separation of 0.325 ± 0.001′′ (48.33 ± 0.48 au; averaged over the two epochs) north of the primary star. The candidate is almost equally bright in both the epochs (ΔJ = 7.6 ± 0.1 mag), as can be seen in Figs. 2a and 2b, which display the median of the reduced images over the entire IFS YJH-band in the 2019 and 2022 epochs, respectively. The candidate is also detected in the reduced data from IRDIS K1 (ΔK1 = 6.9 ± 0.1 mag) and K2 (ΔK2 = 6.6 ± 0.1 mag) bands in both epochs (refer Figs. 3a and b). In addition, a second candidate companion, HIP 81208C, is also revealed in the IRDIS images at a projected separation of 1.492 ± 0.001″ (221.86 ± 2.09 au, averaged over the two epochs) from the central star. This candidate is not within the field of view (FoV) of the IFS (1.73″ × 1.73″).
Table 3 lists the obtained photometry and astrometry for HIP 81208 B and C from the observations in both epochs. To put both candidates in the same astrometric reference frame, the astrometry was calculated based only on the IRDIS data. The astrometry in the individual IRDIS bands is obtained by inserting a negative point spread function (PSF) in the approximate position of the planet, and minimising the root mean square (rms) of the residuals in an area of ~1λ/D around this position in the reduced data by appropriate changes in both the exact position where the PSF was inserted and the multiplicative factor needed to reproduce its intensity. The final astrometry values listed for the companion are the weighted mean of its values from K1 and K2 bands. The contrast magnitudes for the companions were obtained using a similar procedure, but keeping the position of the companion fixed at the value obtained from the astrometric analysis. For IFS photometry, all the individual 39 channels were considered separately (see Sect. 4.3 for more details) and the contrast magnitudes in Y, J, and H bands were obtained by taking the weighted mean of the respective values over the spectral channels with wavelength between 1–1.1 µm, 1.16–1.33 µm, and 1.5–1.64 µm, respectively. Figure 4 shows the position of the two candidate companions in the K1 – K2, K1 colour–magnitude diagram, along with other known substellar companions, young and/or dusty objects, and some field stars.
4.1 Confirming the physically bound nature of the candidates
In order to confirm whether or not the directly imaged candidates are physical companions to the primary, we study their proper motion (see e.g. Janson et al. 2021a). A physical companion will have a similar proper motion to the star, but one that is different from those of other background sources in the FoV. Aside from the primary star and the two companion candidates HIP 81208 B and C, we identify six other sources detected within the IRDIS (K1, K2) FoV that are common to the data in both epochs. Five additional sources are also seen, but only in one epoch, and these are therefore neglected in the following analysis. We study the astrometric motion of all of the above objects relative to the star between the two epochs (given in Table A.1, along with the obtained photometry), as shown in Fig. 5. Given the magnitude of the two candidates B and C, if they are not physically bound to the target star, they would need to be background stars and would in that case possess a low proper motion tending towards zero, that is, a null proper motion. Their astro-metric positions would then shift between the two epochs as a reflection of the proper motion of the star. This astrometric motion can be predicted and is shown as the black dotted curve in the figure, starting at the position expected for a source co-moving with HIP 81208 (unfilled star) and ending at the position expected from the astrometric shift of a pure background source with null proper motion in the second epoch (black filled star). Also plotted in the figure is the relative astrometric shift of the six additional sources detected in the IRDIS data in both epochs (blue crosses, labelled as ‘prob. bkg objects’) along with the associated error bars. These shifts are large with respect to the predicted motion of a comoving source; the offsets from the position expected for a completely static source are due to their own proper motion, which could be the signature of a reflection of the galactic rotation curve. It can be seen that the motions of the two companion candidates B (green cross) and C (yellow cross) are clearly different from those of these six sources, and are much closer to that of a comoving source. The mean astrometric shift of the six additional sources in the IRDIS data is −12.7 ± 1.5 mas (rms: 5.1 mas) along αcos(δ) and −14.7 ± 1.3 mas (rms: 4.4 mas) along δ, plotted as the thicker blue cross; on the other hand the astrometric shifts along αcos(δ) and δ of HIP 81208 B and C are (7.6 ± 9.6, −62.7 ± 1.4) mas and (−12.9 ± 2.2, −62.5 ± 2.2) mas, respectively. This correspondingly places a confident 10.4 σ and 9.8 σ distinction between the astrometric motion of B and C from the mean astrometric motion of the cloud of background objects detected in the IRDIS field, strongly indicating that these candidates are physically bound to the primary star.
To quantify this indication, we compute the probability that the two companion candidates, if drawn from such a sample of background sources, could possess an astrometric shift that would mimic that of a physically bound companion of the primary. In order to compute such a false alarm probability (FAP), we queried the Gaia EDR3 catalogue (Gaia Collaboration 2020) for field stars near HIP 81208 with a search radius of 5 arcmin. The resulting sample contains 4014 Gaia sources; the 50th percentile of their proper motion distribution (with the 16th and 84th percentiles shown as the lower and upper uncertainty limits) is  mas yr−1 along α* (〈µα*〉) and
  mas yr−1 along δ (〈µδ〉). These sources are shown as the grey dots in Fig. 6, labelled ‘Gaia sources’. In the same figure, we also show the six background sources from IRDIS data as blue crosses, with their proper motion computed as the ratio between the corresponding astrometric shifts with respect to the position expected for a static source and the time baseline between the two epochs. The mean proper motion of these six sources, along with the associated uncertainty, is 〈µα*〉 = −4.77 ± 0.58 mas yr−1 and 〈µδ〉 = −5.50 ± 0.50 mas yr−1 (shown as the thicker blue cross in the figure), which is well within ~1σ of that of the Gaia sample. Similarly, the derived µα* and µδ of HIP 81208 B and C are (2.87 ± 3.62 and −23.53 ± 0.54) mas yr−1and (−4.85 ± 0.84 and −23.46 ± 0.75) mas yr−1, respectively. To estimate the FAP, we define an ‘interesting region’ of proper motion in the figure, similar to Squicciarini et al. (2022), within which a background star might be disguised as a physically bound source. This region employs the following boundaries:
 (2)
(2)
The number of Gaia stars that fall into this region is 12 out of 4014 stars, resulting in a corresponding fraction of ‘interesting objects’ of ~3 × 10⁻³. Given that there are eight source detections in the entire IRDIS FoV, this gives a FAP of ~2%. The probability of having at least two such sources is as low as 2 × 10⁻⁴. The obtained low value of FAP is sufficient to add further robustness to the claim that HIP 81208 B and C are physically bound companions to the primary.
It is also evident from Table A.1 that both the companions B and C are much brighter than all other sources detected in the IRDIS FoV. An average over the K1 and K2 bands over the two epochs would yield K = 13.51 ± 0.06 mag for B and K = 12. 44 ± 0. 06 mag for C. An alternative way to determine if HIP 81208 B and C are background objects would then be to compute the probability that background objects as bright as these can be detected at such small separations from the star. As the two companions are quite bright, we may use the 2MASS catalogue (Skrutskie et al. 2006) – which is complete for uncrowded regions at this magnitude level – to estimate the surface density of background objects as bright as B and C. Searching within a radius of 2 arcmin from HIP 81208, we found 26 and 15 2MASS sources brighter than B and C, respectively. Given the projected separation of the two companions from the star, this corresponds to very low probabilities of respectively 1.9 × 10⁻⁴ and 2.3 × 10⁻³ that B and C are background objects by chance projected very close to HIP 81208.
An underlying possibility that is yet to be investigated is that the two companions, although co-moving as established above, could be UCL members that are not bound to the target. Considering the derived masses of B and C, we first evaluate the probability that B is a free-floating UCL substellar object that was by chance close to the target. For this, we perform a similar analysis to that of Squicciarini et al. (2022) and integrate the normalised IMF of the UCL association from 5 MJ6 to 75 MJ to obtain the fraction of objects in UCL belonging to this mass range. To obtain the expected number of UCL objects in the range of 5–75 MJ, we multiply this fraction by the number of UCL sources (~4021)7. We further divide this value by the area of the UCL subregion as given in Squicciarini et al. (2022) to estimate the corresponding projected density of these objects. Multiplying the projected density with the IRDIS FoV (11″×11″) gives us the number of free-floating substellar objects expected in the IRDIS FoV. Using a binomial distribution, we obtain a FAP of having seen at least one such object across the 47 targets that have been observed at least twice in the BEAST survey of ~5 × 10⁻⁴. Similarly, we also computed the probability that C is a stellar mass UCL member that is not bound to HIP 81208 by repeating the above calculation but considering every possible companion mass from 5 MJ to the most massive UCL star ~15 M⊙. The corresponding value for FAP is ~2.4 × 10⁻³. This probability can be regarded as an upper limit, because this analysis considers all the stars in UCL, including those for which Gaia has resolved the true position. For a more accurate estimation, we should consider only those stars within the IRDIS FoV that are undetected by Gaia (e.g. because of being hidden behind brighter stars); this would mean the sample of interloping stars from which the FAP is computed would be smaller than the current one. Therefore, we can safely say that the probability of seeing at least one UCL member of any stellar mass >5 MJ across all the stars that have been observed twice in the BEAST survey until now by chance due to projection effects is <0.2–0.3%.
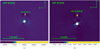 |
Fig. 2 SPHERE IFS YJH band image of HIP 81208 from (a) the 2019 epoch and (b) the 2022 epoch, reduced using a KLIP-based pipeline. The image here is the median taken over the entire wavelength band and shows a bright companion, HIP 81208 B, detected at 0.325 ± 0.001″ north of the primary star (averaged over the two epochs). The pixel scale is 7.46 ± 0.02 mas pixel−1 in both epochs. |
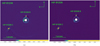 |
Fig. 3 SPHERE IRDIS K band image of HIP 81208 from the (a) 2019 and (b) 2022 epoch observations, reduced using SpeCal in TLOCI mode. Each image here is the median taken over K1 and K2 band images of the respective epoch. Images show the companion HIP 81208 B, as well as a second companion HIP 81208 C detected at 0.325 ± 0.001″ north and 1.492 ± 0.001″ southeast of the primary star, respectively (averaged over the two epochs). The pixel scale was 12.258 ± 0.004 mas pixel−1 for K1 band and 12.253 ± 0.003 mas pixel−1 for K2 band. |
Astrometry of HIP 81208 B and C as obtained from IFS and IRDIS data in the first (2019) and second (2022) epochs, along with the obtained contrast magnitudes in the Y, J, H, K1, and K2 photometric bands.
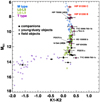 |
Fig. 4 K1 – K2, K1 colour–magnitude diagram, with the candidates HIP 81208B and HIP 81208C shown along with other known substellar companions, young and/or dusty objects, and field stars. |
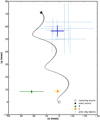 |
Fig. 5 Relative astrometric shifts between the two epochs along α* (x-axis) and δ (y-axis) for all the sources detected in the IRDIS FoV. The black dotted curve shows the expected motion of a pure background source with null proper motion when compared to a source co-moving with the target (the grey shaded region encompasses the uncertainty associated with this motion). The mean astrometric shifts of the probable background objects (blue crosses) detected in the data are shown as a thick blue cross, and those of HIP 81208 B and C are shown as a solid green triangle and a solid yellow square, respectively. |
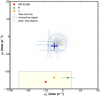 |
Fig. 6 Proper motion in αcos(δ) and δ for the sample of Gaia EDR3 sources within 5 arcmin of the primary, and for the six background sources in the IRDIS data. Also shown are the median proper motion of the six probable background objects as well as the proper motion derived for HIP 81208 B and C using the same symbols as in Fig. 5. The interesting region of proper motion defined by Eq. (2) is over-plotted in the figure as a yellow-shaded region enclosed within black dashed contours. |
4.2 Characterisation of candidate properties
Photometric mass estimates were derived for both the candidates with the help of MADYS based on the average of their respective contrast measurements over the two epochs (shown in Table 3). In particular, the estimate for HIP 81208C is based on IRDIS (K1, K2) bands while that for HIP 81208B is based on both IRDIS and synthetic IFS magnitudes JIFS at 1.246 µm (band width = 0.174 µm) and HIFS at 1.570 µm (band width = 0.132 µm), which were obtained by collapsing the spectral channels 12–21 (1.159–1.333 µm) and 30–38 (1.504–1.636 µm), respectively. The derivation of calibrated apparent magnitudes from contrasts is mediated by suitable photometric data for the primary taken from the literature: 2MASS J, H, and KS for IFS JIFS, HIFS, and the doublet (K1, K2), respectively (shown in Table 1). Given the spectral classification of the primary as a B9V star, the errors introduced by these approximations are well within photometric uncertainties.
MADYS operates by seeking the best match between the vector of input photometry for the object and a selected grid of isochrone and evolutionary track via χ2 minimisation. Evaluation of random uncertainties associated to apparent photometry, parallax, extinction, and age is naturally taken into account in this process in a Monte Carlo fashion. In order to evaluate the impact of theoretical uncertainties on the results, we repeated the mass estimation of each companion twice, employing a different suite of stellar and substellar evolutionary models each time; namely the Ames-Cond models (Allard et al. 2001) and the BHAC15 models. For each candidate, the individual estimates from both repetitions were consistent with one another, and were averaged to get the final mass estimate:
 (3)
(3)
 (4)
(4)
The corresponding Teff returned by the method as a result of the above interpolation scheme were also averaged to get  for B and
  for C. As indicated from Table 6 of Pecaut & Mamajek (2013), which lists intrinsic colours, adopted Teff, and bolometric corrections of 5–30 Myr stars, these values roughly correspond to a spectral type of M5 for B and M4 for C. A comparison of the Teff estimate for B can be made using its observed spectrum over the IFS and IRDIS bands (see Sect. 4.3), giving us some level of confidence as to the derived Teff and spectral type. However, no such comparison can be made for C because it lacks an observed spectrum in the IFS, and so the derived Teff and spectral type for C here should be subjected to careful interpretation.
Grieves et al. (2021) briefly summarises the stellar–substellar mass boundary predictions in the literature. Although the hydrogen-burning mass limit is generally adopted as 80 MJ, the boundary predictions range from 73.3 to 98.5 MJ depending on the choice of models and metallicities (see Dieterich et al. 2018). An even lower mass limit of ~70 MJ was predicted by Dupuy & Liu (2017) based on the astrometric masses of 31 ultracool binaries with component spectral types M7–T5. Comparing the above derived mass estimates for the companions with the stellar–substellar boundary predictions will place HIP 81208C in the stellar regime and HIP 81208B most likely in the brown dwarf regime. However, further observations and more stringent mass constraints are required to definitively confirm whether HIP 81208B is a brown dwarf or a very low mass star.
4.3 Analysis of HIP 81208B spectrum
To determine contrast values for HIP 81208B from the KLIP-reduced IFS data, a negative PSF was injected at the position of the candidate. Monochromatic reductions were then performed based on principal component analysis (PCA) with modes 2–6 in such a way that the standard deviation is minimised within a region of ~1λ/D centred on the position of the candidate. The values obtained for each wavelength with the different PCA modes were averaged to get the final contrast for that wavelength. The uncertainty in the contrast for each wavelength was calculated as the rms scatter of the values obtained by repeating the above same procedure, with the negative PSF inserted, not at the companion position but at five different positions in the image at the same separation from the star as the companion B, and separated by 60, 120, 240, and 300 degrees in position angle. The minimisation of the standard deviation only concerns the intensity of the negative PSF that is inserted and can therefore be performed even without an actual companion present at the location of insertion. The intensity value derived this way can be either positive or negative, depending on the local noise realisation. The contrast values and uncertainties thus obtained for the candidate from the IFS data in both the epochs are plotted against the respective wavelengths in Fig. 7 along with the obtained contrasts using SpeCal from the IRDIS K1 and K2 bands.
To calculate the flux of the companion B corresponding to the contrast values at each wavelength, we interpolated the bestfit theoretical spectrum for the star from Sect. 3.2 (see Fig. 1) scaled to the observed flux levels at the respective wavelengths. The uncertainties in flux are obtained by quadratically summing the uncertainties in contrast and the photon noise at the location of B estimated within an area of ~1λ/D around it. Further, to determine the spectral type of the candidate, we fit theoretical stellar models AMES-Cond 2000 (Allard et al. 2001) and BT-Settl (Allard et al. 2012) to the obtained flux spectrum of the candidate. To determine the right choice for surface gravity, we interpolated the AMES-Cond isochrone corresponding to the estimated age of the target in this work (0.02 Gyr) for the estimated mass of HIP 81208 B in Sect. 4.2 (0.064 M⊙); the corresponding log(g) given by the isochrone is 4.42. The closest available choice of surface gravity among the models is log(ɡ) = 4.5. As an additional check, we also interpolated the AMES-Cond evolutionary track corresponding to a mass of 0.06 M⊙; at a log(ɡ) = 4.5 the age suggested by the evolutionary track is 0.026 Gyr, which is compatible with our age estimate for the target. For these reasons, we chose a log(ɡ) value of 4.5 for the theoretical models in this analysis. The resulting theoretical flux at the surface of the star was scaled to the observed flux level by a factor of R2/D2, where R is the radius of the candidate for the specific temperature of the model as determined from the corresponding model isochrones and evolutionary tracks corresponding to an age of 0.02 Gyr, and D is the distance to HIP 81208 from Earth. Figure 8 shows the reduced χ2 ( ) values between the observed spectrum and the two theoretical models at specific effective temperatures. For both 2019 and 2022 epoch observations, the
  value for both models approaches the ideal value of 1 at the effective temperature of 2900 K, the closest spectral type to which is M5 (Teff = 2880 K) (see Table 6 of Pecaut & Mamajek 2013). Figure 9 shows the observed spectrum for HIP 81208B in both the epochs alongside theoretical models corresponding to the lowest
  (2900 K), as well as for Teff = (2800 K, 3000 K). The obtained Teff here for B from its spectrum and the corresponding spectral type are consistent with the results from MADYS in Sect. 4.2, supporting the reliability of these values. We therefore conclude that HIP 81208B is likely of spectral type M5.
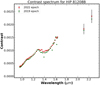 |
Fig. 7 Contrast spectrum for HIP 81208B obtained from reduced IFS data in the YJH band and IRDIS data in K1 and K2 bands, along with the associated uncertainties. The red solid squares represent the contrast obtained from the 2022 observations and the green solid circles represent the contrast obtained from 2019 observations. |
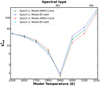 |
Fig. 8
|


4.4 Constraining the orbital parameters
Given the astrometric information of the two companions obtained in two different epochs, it is possible to derive constraints on their orbital parameters. We do this using the Python package orbitize! (Blunt et al. 2020), which is designed to fit the orbits of directly imaged planets. Orbitize! offers two choices of algorithm for fitting orbits: Orbits for the Impatient (OFTI, see Blunt et al. 2017) and Markov chain Monte Carlo (MCMC, see Ford 2005; Vousden et al. 2016). The disadvantage with using MCMC for orbital fitting of long-period orbits is that for cases with less constraints from observations on the orbital parameters, MCMC take a very long time to converge. As the relative displacement between the two epochs for B and C were only 7.8 mas and 3.4 mas, respectively, we had very low orbital coverage for the companions from our observations, and therefore MCMC would not be an ideal choice. This means that our choice of algorithm was OFTI, which is a Bayesian Monte Carlo rejection-sampling method that is ideal for cases where the observations cover only a small fraction of long-period orbits. OFTI takes the separation and position angle of the companion in the different observation epochs, and the parallax and the total mass of the system (star and companion), along with uncertainties, as input and uses built-in8 prior probability distribution functions (PDFs) to compute posterior PDFs of orbital parameters. This computation is based on the orbits that the algorithm accepts from the generated ones, using the technique of rejection-sampling. We ran orbitize! until a total of 106 orbits were accepted by the algorithm for both B and C. The corner plots in Figs. 10a and b show the resulting posterior distribution of the semi-major axis (a), inclination (i), and eccentricity (e) of these orbits (the plots are truncated to include only 98% of the generated orbits for better visibility). The 2D contour plots in the figures illustrate 1σ, 2σ, and 3σ confidence levels on these values. The median orbital parameters for B and C as derived from these posteriors, along with the upper (84%) and lower (16%) quantile intervals (~±1σ), are also shown in the figures, and are listed in Table 4. The orbital periods implied for B and C from their semi-major axis obtained above and their derived masses in Sect. 4.2 are also listed in the table.
The corner plots suggest it is very unlikely that B has a very high eccentricity orbit (>0.7); higher inclinations (>75º) than the predicted quantile limit would favour a much wider orbit, both of which seem of very low probability based on the posteriors. Similarly, for C as well, the probability falls rapidly for higher eccentricities and higher values of orbital distance seem very unlikely. It is noteworthy from these results that the orbital inclination of C is very different from that of B, with the relative inclination between the two companions being ~80º (refer Fig. 11 for the distribution of relative inclinations between the orbits of B and C obtained from the algorithm). Thus, the two orbital planes look roughly orthogonal, making B and C appear to orbit in opposite directions.
Figures 12 and 13 show 20 random orbits drawn from the posterior distributions from the OFTI run for B and C, respectively. The left panels show the orbital motion of the respective companions in RA and DEC over an entire period of these orbits and the right panels show the projected separation ρ (mas) and position angle (PA; in deg) predicted from these orbits over time. Also shown in the plots are the observed ρ and PA of the companions in the two epochs along with error bars.
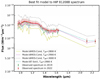 |
Fig. 9 Observed spectrum for HIP 81208B in 2019 (green solid circles) and 2022 (red solid squares) epochs, along with the associated uncertainties in flux. Also plotted are the AMES-Cond 2000 log(g) = 4.5 theoretical model for Teff = 2800, 2900, and 3000 K and the BT-Settl log(ɡ) = 4.5 theoretical model for Teff = 2900 K. The best-fit models to the observed spectrum in both epochs correspond to Teff = 2900 K. |
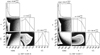 |
Fig. 10 Corner plots for the accepted orbits from OFTI for companions B (a) and C (b). The median values along with upper (84%) and lower (16%) quantile intervals (~±1σ) are shown as dashed vertical lines on the posterior distributions of the respective orbital parameters. The 2D contour plots show the 1σ, 2σ, and 3σ confidence limits to these values. |
Properties of companions HIP 81208B and C determined in this work using astrometric and photometric information from BEAST observations in the two epochs.
4.5 Dynamical stability of the orbits
We can refine the current orbital constraints (depicted in Fig. 10) by ensuring that the configuration is stable for a rimescale comparable to the age of the system (~107 yr). Indeed, it is unlikely that we observe this system immediately before the ejection of one of its components. The stability of a triple system with non-negligible mass ratios requires a well-separated hierarchical structure, with sufficient distance between the orbits. Moreover, if the eccentricities and/or relative inclination are high, then additional secular perturbations can destabilise orbits that were initially well separated. To evaluate the additional constraints ensuing from dynamical stability, we randomly pick 1000 couples of solutions to the orbital fits, and run N-body simulations of their future 107 yr of evolution. We use the IAS 15 integrator in the Rebound package (Rein & Spiegel 2015). We adopt the following values for the masses: M* = 2.58 M⊙, MB = 0.064 M⊙, and MC = 0.135 M⊙. The maximum value of the eccentricity reached by either orbit is displayed in Fig. 14 as a function of the semi-major axes, eccentricities, and relative inclination. Values of more than 1 signify instability (corresponding orbits are indicated as black solid circles in the figure). The results suggest that a large fraction of the orbital solutions (nearly half of them) are actually unstable. In particular, for companion C, the lower right panel of Fig. 14 shows that instability develops starting from ec ≃ 0.5, whatever the relative inclination (the chaos becomes too strong for the system to be locked in a Kozai regime). From the top-middle panel of the figure, we also see that only wide separations (ac > 500 au) are able to help maintain the stability for ec > 0.5; however, such separations are outside the interval of confidence for C (see Table 4). Hence, we can say that large eccentricities (>0.5) are disfavoured for C.
In the simulations, we notice that a significant proportion of solutions reach high eccentricities without becoming unstable. This is characteristic of the Von Zeipel-Lidov-Kozai (ZLK Von Ziepel 1910; Lidov 1962; Kozai 1962) resonance, which occurs when the relative inclination is more than ≃40 degrees and less than ≃130 degrees. Looking at the whole set of solutions, the likelihood that this system is in a configuration of ZLK resonance is around 65% (see Fig. 11). The period of Kozai eccentricity oscillations for a triple system can be approximately estimated as (Takeda & Rasio 2005; Ford et al. 2000):
 (5)
(5)
where P, a, and e are the orbital period, semi-major axis, and eccentricity, respectively, and the indices 0, 1, and 2 are in this case representative of the primary star HIP 81208, the brown dwarf companion B, and the stellar companion C, respectively. For the system HIP 81208, using the derived mass and orbital parameters in Sects. 4.2 and 4.4, the Kozai oscillation period is ≃0.3 Myr, which is much shorter than 17 Myr, which is the age of the system. Therefore, the system has enough time to have undergone at least a few cycles of Kozai oscillations. Such systems are rare and precious, for ZLK resonances are at the core of many astrophysical problems such as hot Jupiters (see Wu & Murray 2003) or black hole mergers (see Liu & Lai 2019). More generally, the relative inclination between the different orbits of a given system is far from well constrained, and could bring important clues as to the formation processes. In this regard, HIP 81208 probes an uncharted regime between the planetary (Dupuy et al. 2022) and stellar masses (Tokovinin 2017), where it is unclear whether coplanarity or random inclinations should be favoured.
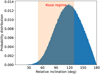 |
Fig. 11 Distribution of the relative inclinations between B and C’s orbits from the sample of solutions obtained by the OFTI algorithm. The light red area corresponds to systems in the ZLK configuration, or Kozai regime. |
4.6 A potential ‘D’ component
In addition to the two companions reported in this study, the star Gaia DR3 6020420074469092608 (2MASS J16360769-3543514, WISEA J163607.70-354351) at a separation of 656.28″ (0.1823°) and position angle of 92.046° is potentially noteworthy. The star is a faint (G = 14.975 ± 0.003 mag; Gaia Collaboration 2020) X-ray-emitting source detected by the Rosat All-Sky Survey (leRASS J163607.7-354351, 2RXS J163607.8-354352; see Boller et al. 2016). Its parallax, 6.6742 ± 0.0297 mas (Gaia Collaboration 2020), differs from that of HIP 81208 only by ~3σ and the proper motion (µα* = −9.622 ± 0.035 mas yr−1, µδ = −24.695 ± 0.029 mas yr−1; Gaia Collaboration 2020) only by ~ 1.12 mas yr−1(856 ± 56 ms−1). Given the total mass of the HIP 81208 triple system, namely Mtot = 2.779 M⊙, the tidal radius of HIP 81208 is then 1.35 pc×(Mtot/M⊙)1/3 = 1.898 pc (Mamajek et al. 2013; Jiang & Tremaine 2010). At a distance of 148.7 pc, this translates to a projected tidal radius of (180/π)×(1.898 pc/148.7 pc) = 0.7313°, or 2632.75″. As the star is within 656.28″of HIP 81208, it is possible that it could be within the tidal influence of our target. This fact, along with the similar parallax and proper motion to HIP 81208, suggest a possibility that this star could be a potential ‘D’ companion in this currently triple system. However, we cannot reliably assess this possibility given the present lack of knowledge about this star. Future observations of Gaia DR3 6020420074469092608 with instruments such as GRAVITY (GRAVITY Collaboration 2017) could help provide more information on its projected 2D motion in the sky. In addition, radial velocity information from future spectroscopic observations will also help determine its 3D motion. If the star shares the same 3D motion in the sky as HIP 81208, this could be a strong indication that it is bound to our target.
5 Conclusions
In this work, we describe our observations of the B9V star HIP 81208 using the SPHERE instrument at VLT as part of the BEAST survey in two different epochs, obtaining both IFS YJH spectroscopy and IRDIS K1 and K2 imaging data for the target. We report the discovery of two lower-mass companions to the star; an inner companion HIP 81208B at a projected separation of 0.325 ± 0.001″ and an outer companion HIP 81208C at a projected separation of 1.492 ± 0.001″. Using its spectrum over the YJH – K1 – K2 wavelength range, we determine that HIP 81208B is of spectral type M5. Analysing the obtained photometry, we estimate the masses of HIP 81208B and C to be  and
and  , respectively, indicating that B is most likely a brown dwarf and C a low-mass star. We confirm that both companions are physically bound to the primary by means of proper motion analysis of the background stars in the data.
Using astrometric information over the two epochs, we were able to constrain the orbits of B and C to the most probable semi-major axis values of  au and
  au, respectively. The relative inclination between the two orbits is high, making them appear to orbit in an opposite sense to each other. Table 4 summarises the main parameters we derived for the two companions in this work. The orbital solutions we derived for the companions indicate that this system is likely to be in a Kozai resonance, in which orbits with high relative inclinations can remain stable despite reaching high values of eccentricity. This means that HIP 81208 is a system of considerable interest; careful further study of this system would help us to understand more about orbital dynamics in systems where the companions are in between planetary and stellar mass regimes.
Our observations therefore provide strong evidence that HIP 81208 is a triple system, with two low-mass companions in a very interesting configuration around the star. If the nearby star Gaia DR3 6020420074469092608 turns out to be physically bound to HIP 81208, the system may even be quadruple. Further observations of HIP 81208 would therefore be of use, both in investigating the possibility of perhaps a ‘D’ component in the now known triple system, and in understanding more about the orbital dynamics in the system. The orbital parameters derived in this study for HIP 81208 B and C are not tightly constrained – as can be seen from their large ±1σ errors – because they are based on a small time baseline. Future BEAST or GRAVITY epochs will aid in providing longer time baseline astrometry for both the companions, which could help establish more stringent constraints on the orbital parameters for this very interesting system.
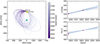 |
Fig. 12 Illustration of 20 random orbits drawn from the posterior distributions from the OFTI run for HIP 81208B. The left panel shows the motion of B in RA and Dec over an entire orbital period for these 20 cases. The adjacent color bar shows the epochs along the orbital positions. The yellow solid circles represent the predicted position of the companion in these orbits in the two observation epochs. The blue star represents the central primary star HIP 81208. The right panel shows the projected separation ρ and PA (deg) of B over time, as predicted from these 20 orbits. The two purple dots on both figures represent the measured values of the respective parameters at the two observation epochs. |
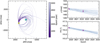 |
Fig. 13 Illustration of 20 random orbits drawn from the posterior distributions from the OFTI run for HIP 81208C. The left panel shows the motion of C in RA and Dec over an entire orbital period for these 20 cases. The change in the position of the companion over the two epochs is very small and the separate data points are not visible as in the previous figure and are therefore represented by a single yellow solid circle. The right panel shows the projected separation ρ and PA (deg) of C over time as predicted from these 20 orbits. The symbols and colour bar hold the same meaning as in the previous figure. |
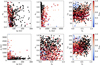 |
Fig. 14 Maximum eccentricity reached by either orbit within 107 yr of evolution depending on the initial orbital elements. Black solid circles depict unstable cases (emax > 1, 44% of the cases). These results were obtained by running N-body simulations starting from 1000 solutions of the orbital fit. Configurations where orbits are crossing or almost crossing are always unstable. Orbits with relative inclination between 40 and 130 degrees are locked in a Kozai resonance, and may experience high eccentricity variations without compromising the stability of the system. |
Acknowledgements
M.J. gratefully acknowledges funding from the Knut and Alice Wallenberg Foundation. A.V. and P.D. acknowledge funding from the European Research Council (ERC) under the European Union’s Horizon 2020 research and innovation programme (grant agreement no. 757561, COBREX; grant agreement no. 885593). This publication makes use of CDS and NASA/ADS services, as well as VOSA, developed under the Spanish Virtual Observatory (https://svo.cab.inta-csic.es) project funded by MCIN/AEI/10.13039/501100011033/through grant PID2020-112949GB-I00. VOSA has been partially updated by using funding from the European Union’s Horizon 2020 Research and Innovation Programme, under Grant Agreement no. 776403 (EXOPLANETS-A). This work has also made use of the SPHERE Data Centre, jointly operated by OSUG/IPAG (Grenoble), PYTHEAS/LAM/CeSAM (Marseille), OCA/Lagrange (Nice), Observatoire de Paris/LESIA (Paris), and Observatoire de Lyon (OSUL/CRAL). This research has made use of the SIMBAD database and VizieR catalogue access tool, operated at CDS, Strasbourg, France. This work has made use of data from the European Space Agency (ESA) mission Gaia (https://www.cosmos.esa.int/gaia), processed by the Gaia Data Processing and Analysis Consortium (DPAC, https://www.cosmos.esa.int/web/gaia/dpac/consortium). Funding for the DPAC has been provided by national institutions, in particular the institutions participating in the Gaia Multilateral Agreement. This work is supported by the French National Research Agency in the framework of the Investissements d’Avenir program (ANR-15-IDEX-02), through the funding of the “Origin of Life” project of the Univ. Grenoble-Alpes. This work is also supported by the PRIN-INAF 2019 “Planetary systems at young ages (PLATEA)”. Part of this research was carried out at the Jet Propulsion Laboratory, California Institute of Technology, under a contract with the National Aeronautics and Space Administration (80NM0018D0004).
Appendix A Properties of IRDIS sources
Astrometric and photometric properties of all the sources detected in the IRDIS FoV in both epochs.
References
- Anders, F., Khalatyan, A., Queiroz, A. B. A., et al. 2022, A&A, 658, A91 [NASA ADS] [CrossRef] [EDP Sciences] [Google Scholar]
- Anderson, E., Francis, C. 2012, Astron. Lett., 38, 331 [NASA ADS] [CrossRef] [Google Scholar]
- Allard, F., Hauschildt, P. H., Alexander, D. R., et al. 2001, ApJ, 556, 357 [Google Scholar]
- Allard, F., Homeier, D., Freytag, B. 2012, Philos. Trans. Roy. Soc. Lond. Ser. A, 370, 2765 [NASA ADS] [Google Scholar]
- Asensio-Torres, R., Janson, M., Bonavita, M., et al. 2018, A&A, 619, A43 [NASA ADS] [CrossRef] [EDP Sciences] [Google Scholar]
- Baraffe, I., Homeier, D., Allard, F., et al. 2015, A&A, 577, A42 [NASA ADS] [CrossRef] [EDP Sciences] [Google Scholar]
- Belokurov, V., Penoyre, Z., Oh, S., et al. 2020, MNRAS, 496, 1922 [Google Scholar]
- Beuzit, J.-L., Vigan, A., Mouillet, D., et al. 2019, A&A, 631, A155 [NASA ADS] [CrossRef] [EDP Sciences] [Google Scholar]
- Blunt, S., Nielsen, E. L., De Rosa, R. J., et al. 2017, AJ, 153, 229 [Google Scholar]
- Blunt, S., Wang, J. J., Angelo, I., et al. 2020, AJ, 159, 89 [NASA ADS] [CrossRef] [Google Scholar]
- Bochanski, J. J., Faherty, J. K., Gagné, J., et al. 2018, AJ, 155, 149 [NASA ADS] [CrossRef] [Google Scholar]
- Bohn, A. J., Kenworthy, M. A., Ginski, C., et al. 2020, ApJ, 898, L16 [Google Scholar]
- Boller, T., Freyberg, M. J., Trümper, J., et al. 2016, A&A, 588, A103 [NASA ADS] [CrossRef] [EDP Sciences] [Google Scholar]
- Bonavita, M., Desidera, S., Thalmann, C., et al. 2016, A&A, 593, A38 [NASA ADS] [CrossRef] [EDP Sciences] [Google Scholar]
- Bowler, B. P., Liu, M. C., Shkolnik, E. L., et al. 2012, ApJ, 753, 142 [NASA ADS] [CrossRef] [Google Scholar]
- Brandt, T. D. 2021, ApJS, 254, 42 [NASA ADS] [CrossRef] [Google Scholar]
- Brandt, G. M., Brandt, T. D., Dupuy, T. J., et al. 2021, ApJ, 915, L16 [NASA ADS] [CrossRef] [Google Scholar]
- Bressan, A., Marigo, P., Girardi, L., et al. 2012, MNRAS, 427, 127 [NASA ADS] [CrossRef] [Google Scholar]
- Cantalloube, F., Dohlen, K., Milli, J., et al. 2019, The Messenger, 176, 25 [NASA ADS] [Google Scholar]
- Castelli, F. Kurucz, R. L. 2003, Modell. Stellar Atmos., 210, A20 [Google Scholar]
- Chauvin, G., Desidera, S., Lagrange, A.-M., et al. 2017, A&A, 605, A9 [Google Scholar]
- Chen, Y., Bressan, A., Girardi, L., et al. 2015, MNRAS, 452, 1068 [Google Scholar]
- Choi, J., Dotter, A., Conroy, C., et al. 2016, ApJ, 823, 102 [Google Scholar]
- Creevey, O. L., Sordo, R., Pailler, F., et al. 2023, A&A, 674, A26 [NASA ADS] [CrossRef] [EDP Sciences] [Google Scholar]
- Crepp, J. R., Gonzales, E. J., Bechter, E. B., et al. 2016, ApJ, 831, 136 [NASA ADS] [CrossRef] [Google Scholar]
- Cutri, R. M., Skrutskie, M. F., van Dyk, S., et al. 2003, VizieR Online Data Catalog: II/246 [Google Scholar]
- Currie, T., Brandt, T. D., Kuzuhara, M., et al. 2020, ApJ, 904, L25 [Google Scholar]
- Currie, T., Brandt, G. M., Brandt, T. D., et al. 2023, Science, 380, 198 [NASA ADS] [CrossRef] [Google Scholar]
- Damiani, F., Prisinzano, L., Pillitteri, I., et al. 2019, A&A, 623, A112 [NASA ADS] [CrossRef] [EDP Sciences] [Google Scholar]
- Delorme, P., Lagrange, A. M., Chauvin, G., et al. 2012, A&A, 539, A72 [NASA ADS] [CrossRef] [EDP Sciences] [Google Scholar]
- Delorme, P., Meunier, N., Albert, D. et al., 2017, in SF2A-2017: Proceedings of the Annual meeting of the French Society of Astronomy and Astrophysics, eds. C. Reylè, P. Di Matteo, F. Herpin, et al. 347 [Google Scholar]
- de Zeeuw, P. T., Hoogerwerf, R., de Bruijne, J. H. J., et al. 1999, AJ, 117, 354 [NASA ADS] [CrossRef] [Google Scholar]
- Dieterich, S. B., Weinberger, A. J., Boss, A. P., et al. 2018, ApJ, 865, 28 [Google Scholar]
- Dupuy, T. J., Liu, M. C. 2017, ApJS, 231, 15 [NASA ADS] [CrossRef] [Google Scholar]
- Dupuy, T., Kraus, A., Kratter, et al. 2022, MNRAS, 512, 648 [CrossRef] [Google Scholar]
- ESA 1997, ESA Special Publication, 1200 [Google Scholar]
- Ford, E. B. 2005, AJ, 129, 1706 [Google Scholar]
- Ford, E. B., Kozinsky, B., Rasio, F. A. 2000, ApJ, 535, 385 [NASA ADS] [CrossRef] [Google Scholar]
- Franson, K., Bowler, B. P., Bonavita, M., et al. 2023, AJ, 165, 39 [NASA ADS] [CrossRef] [Google Scholar]
- Gaia Collaboration 2020, VizieR Online Data Catalog: I/350 [Google Scholar]
- Gaia Collaboration (Vallenari, A., et al.) 2023, A&A, 674, A1 [NASA ADS] [CrossRef] [EDP Sciences] [Google Scholar]
- Galicher, R., Boccaletti, A., Mesa, D., et al. 2018, A&A, 615, 92 [Google Scholar]
- Gaskell, C. M. 1990, BAAS [Google Scholar]
- GRAVITY Collaboration (Abuter, R., et al.) 2017, A&A, 602, A94 [NASA ADS] [CrossRef] [EDP Sciences] [Google Scholar]
- Grieves, N., Bouchy, F., Lendl, M., et al. 2021, A&A, 652, A127 [NASA ADS] [CrossRef] [EDP Sciences] [Google Scholar]
- Hinkley, S., Lacour, S., Marleau, G.-D., et al. 2023, A&A, 671, L5 [NASA ADS] [CrossRef] [EDP Sciences] [Google Scholar]
- Hoogerwerf, R. 2000, MNRAS, 313, 43 [CrossRef] [Google Scholar]
- Houk, N. 1982, Michigan Catalogue of Two-dimensional Spectral Types for the HD stars, ed. N. Houk (Ann Arbor, MI, USA: Department of Astronomy, University of Michigan) [Google Scholar]
- Janson, M., Jayawardhana, R., Girard, J. H., et al. 2012, ApJ, 758, L2 [NASA ADS] [CrossRef] [Google Scholar]
- Janson, M., Brandt, T. D., Moro-Martín, A., et al. 2013, ApJ, 773, 73 [Google Scholar]
- Janson, M., Asensio-Torres, R., André, D., et al. 2019, A&A, 626, A99 [EDP Sciences] [Google Scholar]
- Janson, M., Squicciarini, V., Delorme, P., et al. 2021a, A&A, 646, A164 [NASA ADS] [CrossRef] [EDP Sciences] [Google Scholar]
- Janson, M., Gratton, R., Rodet, L., et al. 2021b, Nature, 600, 231 [NASA ADS] [CrossRef] [Google Scholar]
- Jiang, Y.-F., Tremaine, S. 2010, MNRAS, 401, 977 [CrossRef] [Google Scholar]
- Johnson, H. L., Morgan, W. W. 1953, ApJ, 117, 313 [NASA ADS] [CrossRef] [Google Scholar]
- Kervella, P., Arenou, F., Mignard, F., et al. 2019, A&A, 623, A72 [NASA ADS] [CrossRef] [EDP Sciences] [Google Scholar]
- Kervella, P., Arenou, F., Thévenin, F. 2022, A&A, 657, A7 [NASA ADS] [CrossRef] [EDP Sciences] [Google Scholar]
- Keppler, M., Benisty, M., Müller, A., et al. 2018, A&A, 617, A44 [NASA ADS] [CrossRef] [EDP Sciences] [Google Scholar]
- Kozai, Y. 1962, AJ, 67, 591 [Google Scholar]
- Lacour, S., Wang, J. J., Rodet, L., et al. 2021, A&A, 654, A2 [NASA ADS] [CrossRef] [EDP Sciences] [Google Scholar]
- Lallement, R., Capitanio, L., Ruiz-Dern, L., et al. 2018, A&A, 616, A132 [NASA ADS] [CrossRef] [EDP Sciences] [Google Scholar]
- Launhardt, R., Henning, T., Quirrenbach, A., et al. 2020, A&A, 635, A162 [NASA ADS] [CrossRef] [EDP Sciences] [Google Scholar]
- Leike, R. H., Glatzle, M., Enßlin, T. A. 2020, A&A, 639, A138 [NASA ADS] [CrossRef] [EDP Sciences] [Google Scholar]
- Lidov, M. L. 1962, Planet. Space Sci., 9, 719 [Google Scholar]
- Liu, B., Lai, D. 2019, MNRAS, 483, 4060 [NASA ADS] [CrossRef] [Google Scholar]
- Macintosh, B., Graham, J. R., Barman, T., et al. 2015, Science, 350, 64 [Google Scholar]
- Maire, A.-L., Langlois, M., Delorme, P., et al. 2021, J. Astron. Telescopes Instrum. Syst., 7, 035004 [NASA ADS] [Google Scholar]
- Mamajek, E. E., Meyer, M. R., Liebert, J. 2002, AJ, 124, 1670 [NASA ADS] [CrossRef] [Google Scholar]
- Mamajek, E. E., Bartlett, J. L., Seifahrt, A., et al. 2013, AJ, 146, 154 [Google Scholar]
- Marigo, P., Girardi, L., Bressan, A., et al. 2017, ApJ, 835, 77 [Google Scholar]
- Marois, C., Lafrenière, D., Doyon, R., et al. 2006, ApJ, 641, 556 [Google Scholar]
- Marois, C., Correia, C., Véran, J.-P., et al. 2014, Explor. Formation Evol. Planet. Syst., 299, 48 [NASA ADS] [Google Scholar]
- Mayor, M., Queloz, D. 1995, Nature, 378, 355 [NASA ADS] [CrossRef] [Google Scholar]
- McCall, M. L. 2004, AJ, 128, 2144 [Google Scholar]
- Meshkat, T., Mawet, D., Bryan, M. L., et al. 2017, AJ, 154, 245 [Google Scholar]
- Nielsen, E. L., De Rosa, R. J., Macintosh, B., et al. 2019, AJ, 158, 13 [Google Scholar]
- Pavlov, A., Möller-Nilsson, O., Feldt, M., et al. 2008, Proc. SPIE, 7019, 701939 [Google Scholar]
- Pecaut, M. J., Mamajek, E. E. 2013, ApJS, 208, 9 [NASA ADS] [CrossRef] [Google Scholar]
- Pecaut, M. J., Mamajek, E. E., Bubar, E. J. 2012, ApJ, 746, 154 [NASA ADS] [CrossRef] [Google Scholar]
- Rein, H., Spiegel, D. 2015, MNRAS, 446, 1424 [CrossRef] [Google Scholar]
- Reis, W., Corradi, W., de Avillez, M. A., et al. 2011, ApJ, 734, 8 [NASA ADS] [CrossRef] [Google Scholar]
- Skrutskie, M. F., Cutri, R. M., Stiening, R., et al. 2006, AJ, 131, 1163 [NASA ADS] [CrossRef] [Google Scholar]
- Slawson, R. W., Hill, R. J., Landstreet, J. D. 1992, ApJS, 82, 117 [NASA ADS] [CrossRef] [Google Scholar]
- Soummer, R., Pueyo, L., Larkin, J. 2012, ApJ, 755, L28 [NASA ADS] [CrossRef] [Google Scholar]
- Squicciarini, V., Bonavita, M. 2022, A&A, 666, A15 [NASA ADS] [CrossRef] [EDP Sciences] [Google Scholar]
- Squicciarini, V., Gratton, R., Janson, M., et al. 2022, A&A, 664, A9 [NASA ADS] [CrossRef] [EDP Sciences] [Google Scholar]
- Stock, Lukas, 2021, Spektroskopische Doppelsterne im BEAST B-Stern-Sample, Master Thesis, Ruprecht-Karls-Universität Heidelberg, Germany [Google Scholar]
- Takeda, G., Rasio, F. A. 2005, ApJ, 627, 1001 [NASA ADS] [CrossRef] [Google Scholar]
- Tokovinin, A. 2017, ApJ, 844, 103 [NASA ADS] [CrossRef] [Google Scholar]
- Uyama, T., Hashimoto, J., Kuzuhara, M., et al. 2017, AJ, 153, 106 [Google Scholar]
- Vernet, J., Dekker, H., D’Odorico, S., et al. 2011, A&A, 536, A105 [NASA ADS] [CrossRef] [EDP Sciences] [Google Scholar]
- Vigan, A., Moutou, C., Langlois, M., et al. 2010, MNRAS, 407, 71 [Google Scholar]
- Vigan, A., Fontanive, C., Meyer, M., et al. 2021, A&A, 651, A72 [EDP Sciences] [Google Scholar]
- Von Ziepel, H. 1910, Astron. Nachr., 183, 345 [Google Scholar]
- Vousden, W. D., Farr, W. M., Mandel, I. 2016, MNRAS, 455, 1919 [NASA ADS] [CrossRef] [Google Scholar]
- Wagner, K., Apai, D., Kasper, M., et al. 2022, AJ, 163, 80 [NASA ADS] [CrossRef] [Google Scholar]
- Winn, J. N., Matthews, J. M., Dawson, R. I., et al. 2011, ApJ, 737, L18 [Google Scholar]
- Wu, Y., Murray, N. 2003, ApJ, 589, 605 [NASA ADS] [CrossRef] [Google Scholar]
- Zari, E., Hashemi, H., Brown, A. G. A., et al. 2018, A&A, 620, A172 [NASA ADS] [CrossRef] [EDP Sciences] [Google Scholar]
- Zurlo, A., Vigan, A., Mesa, D., et al. 2014, A&A, 572, A85 [NASA ADS] [CrossRef] [EDP Sciences] [Google Scholar]
Rescaled – considering the limiting magnitude of Gaia – from the actual list of members in Damiani et al. (2019), which was complete only above 15 MJ.
See https://orbitize.readthedocs.io/en/latest/tutorials/Modifying_Priors.html for the complete list of default priors in Orbitize! and the different prior choices.
All Tables
Astrometry of HIP 81208 B and C as obtained from IFS and IRDIS data in the first (2019) and second (2022) epochs, along with the obtained contrast magnitudes in the Y, J, H, K1, and K2 photometric bands.
Properties of companions HIP 81208B and C determined in this work using astrometric and photometric information from BEAST observations in the two epochs.
Astrometric and photometric properties of all the sources detected in the IRDIS FoV in both epochs.
All Figures
|
Fig. 1 Spectral energy distribution of HIP 81208 obtained with 78 existing photometry points retrieved from VOSA. Also shown is the best-fit stellar model (Kurucz ODFNEW /NOVER, alpha: 0.0 (2003); Castelli & Kurucz 2003) for a Teff = 10 750 K. |
| In the text | |
|
Fig. 2 SPHERE IFS YJH band image of HIP 81208 from (a) the 2019 epoch and (b) the 2022 epoch, reduced using a KLIP-based pipeline. The image here is the median taken over the entire wavelength band and shows a bright companion, HIP 81208 B, detected at 0.325 ± 0.001″ north of the primary star (averaged over the two epochs). The pixel scale is 7.46 ± 0.02 mas pixel−1 in both epochs. |
| In the text | |
|
Fig. 3 SPHERE IRDIS K band image of HIP 81208 from the (a) 2019 and (b) 2022 epoch observations, reduced using SpeCal in TLOCI mode. Each image here is the median taken over K1 and K2 band images of the respective epoch. Images show the companion HIP 81208 B, as well as a second companion HIP 81208 C detected at 0.325 ± 0.001″ north and 1.492 ± 0.001″ southeast of the primary star, respectively (averaged over the two epochs). The pixel scale was 12.258 ± 0.004 mas pixel−1 for K1 band and 12.253 ± 0.003 mas pixel−1 for K2 band. |
| In the text | |
|
Fig. 4 K1 – K2, K1 colour–magnitude diagram, with the candidates HIP 81208B and HIP 81208C shown along with other known substellar companions, young and/or dusty objects, and field stars. |
| In the text | |
|
Fig. 5 Relative astrometric shifts between the two epochs along α* (x-axis) and δ (y-axis) for all the sources detected in the IRDIS FoV. The black dotted curve shows the expected motion of a pure background source with null proper motion when compared to a source co-moving with the target (the grey shaded region encompasses the uncertainty associated with this motion). The mean astrometric shifts of the probable background objects (blue crosses) detected in the data are shown as a thick blue cross, and those of HIP 81208 B and C are shown as a solid green triangle and a solid yellow square, respectively. |
| In the text | |
|
Fig. 6 Proper motion in αcos(δ) and δ for the sample of Gaia EDR3 sources within 5 arcmin of the primary, and for the six background sources in the IRDIS data. Also shown are the median proper motion of the six probable background objects as well as the proper motion derived for HIP 81208 B and C using the same symbols as in Fig. 5. The interesting region of proper motion defined by Eq. (2) is over-plotted in the figure as a yellow-shaded region enclosed within black dashed contours. |
| In the text | |
|
Fig. 7 Contrast spectrum for HIP 81208B obtained from reduced IFS data in the YJH band and IRDIS data in K1 and K2 bands, along with the associated uncertainties. The red solid squares represent the contrast obtained from the 2022 observations and the green solid circles represent the contrast obtained from 2019 observations. |
| In the text | |
|
Fig. 8
|
| In the text | |
|
Fig. 9 Observed spectrum for HIP 81208B in 2019 (green solid circles) and 2022 (red solid squares) epochs, along with the associated uncertainties in flux. Also plotted are the AMES-Cond 2000 log(g) = 4.5 theoretical model for Teff = 2800, 2900, and 3000 K and the BT-Settl log(ɡ) = 4.5 theoretical model for Teff = 2900 K. The best-fit models to the observed spectrum in both epochs correspond to Teff = 2900 K. |
| In the text | |
|
Fig. 10 Corner plots for the accepted orbits from OFTI for companions B (a) and C (b). The median values along with upper (84%) and lower (16%) quantile intervals (~±1σ) are shown as dashed vertical lines on the posterior distributions of the respective orbital parameters. The 2D contour plots show the 1σ, 2σ, and 3σ confidence limits to these values. |
| In the text | |
|
Fig. 11 Distribution of the relative inclinations between B and C’s orbits from the sample of solutions obtained by the OFTI algorithm. The light red area corresponds to systems in the ZLK configuration, or Kozai regime. |
| In the text | |
|
Fig. 12 Illustration of 20 random orbits drawn from the posterior distributions from the OFTI run for HIP 81208B. The left panel shows the motion of B in RA and Dec over an entire orbital period for these 20 cases. The adjacent color bar shows the epochs along the orbital positions. The yellow solid circles represent the predicted position of the companion in these orbits in the two observation epochs. The blue star represents the central primary star HIP 81208. The right panel shows the projected separation ρ and PA (deg) of B over time, as predicted from these 20 orbits. The two purple dots on both figures represent the measured values of the respective parameters at the two observation epochs. |
| In the text | |
|
Fig. 13 Illustration of 20 random orbits drawn from the posterior distributions from the OFTI run for HIP 81208C. The left panel shows the motion of C in RA and Dec over an entire orbital period for these 20 cases. The change in the position of the companion over the two epochs is very small and the separate data points are not visible as in the previous figure and are therefore represented by a single yellow solid circle. The right panel shows the projected separation ρ and PA (deg) of C over time as predicted from these 20 orbits. The symbols and colour bar hold the same meaning as in the previous figure. |
| In the text | |
|
Fig. 14 Maximum eccentricity reached by either orbit within 107 yr of evolution depending on the initial orbital elements. Black solid circles depict unstable cases (emax > 1, 44% of the cases). These results were obtained by running N-body simulations starting from 1000 solutions of the orbital fit. Configurations where orbits are crossing or almost crossing are always unstable. Orbits with relative inclination between 40 and 130 degrees are locked in a Kozai resonance, and may experience high eccentricity variations without compromising the stability of the system. |
| In the text | |
Current usage metrics show cumulative count of Article Views (full-text article views including HTML views, PDF and ePub downloads, according to the available data) and Abstracts Views on Vision4Press platform.
Data correspond to usage on the plateform after 2015. The current usage metrics is available 48-96 hours after online publication and is updated daily on week days.
Initial download of the metrics may take a while.