Fig. 5
Download original image
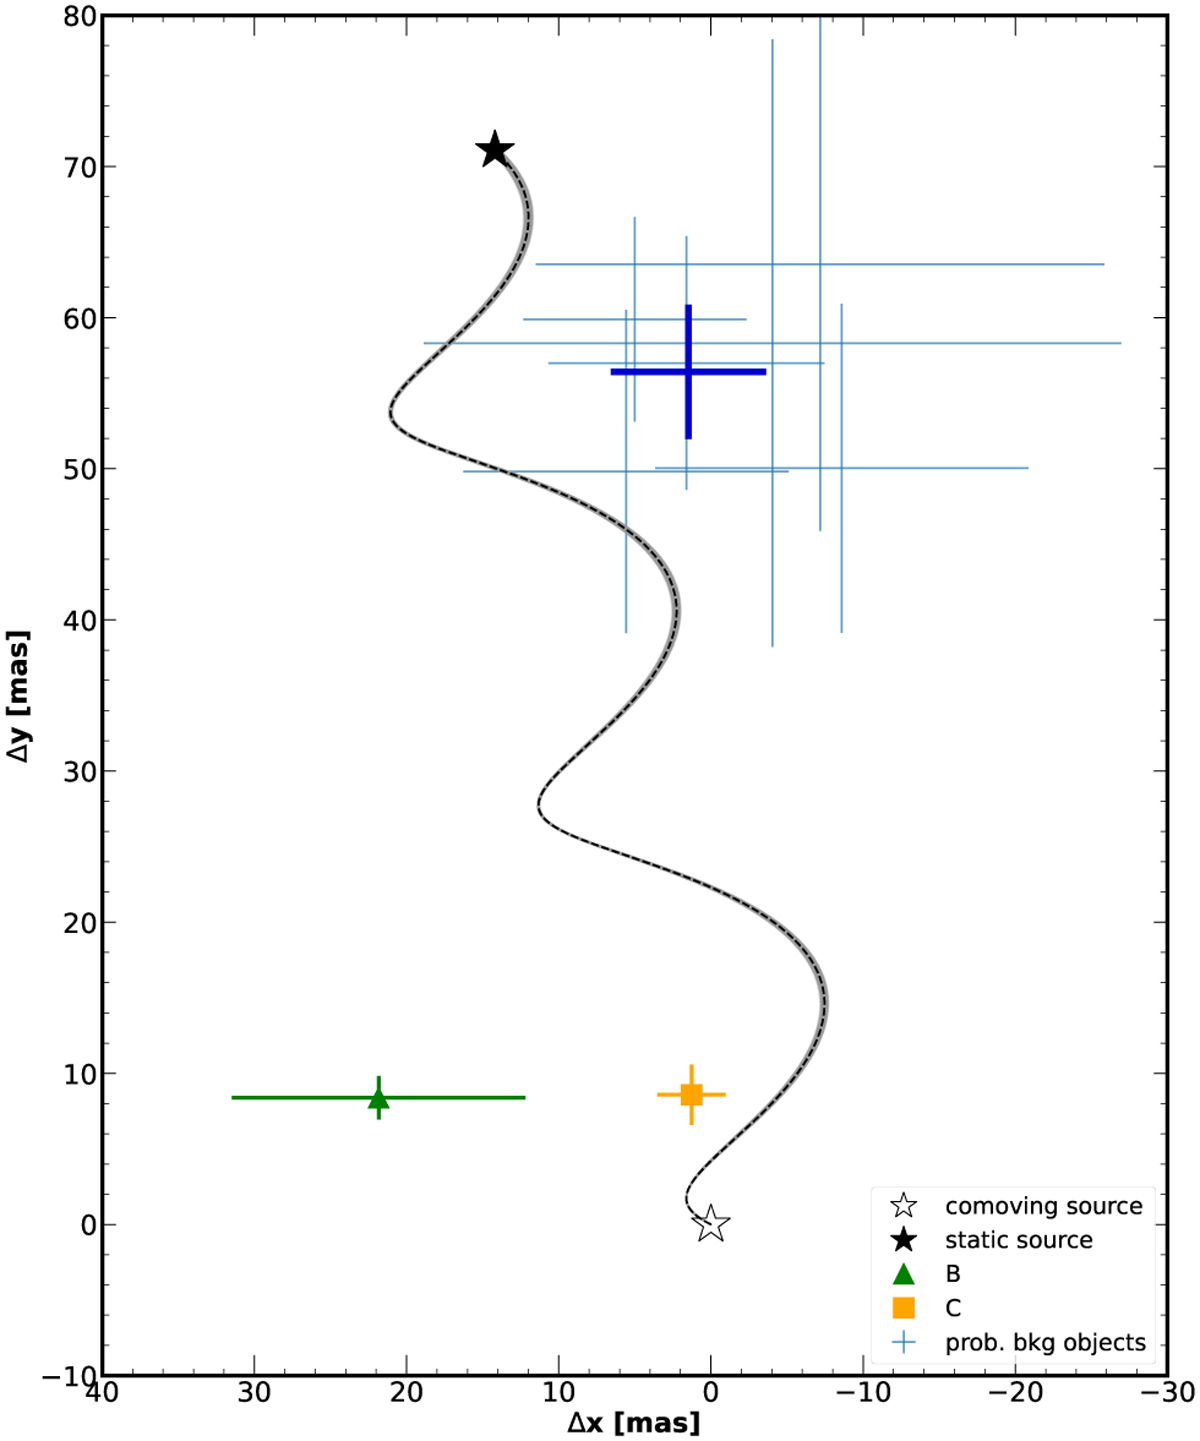
Relative astrometric shifts between the two epochs along α* (x-axis) and δ (y-axis) for all the sources detected in the IRDIS FoV. The black dotted curve shows the expected motion of a pure background source with null proper motion when compared to a source co-moving with the target (the grey shaded region encompasses the uncertainty associated with this motion). The mean astrometric shifts of the probable background objects (blue crosses) detected in the data are shown as a thick blue cross, and those of HIP 81208 B and C are shown as a solid green triangle and a solid yellow square, respectively.
Current usage metrics show cumulative count of Article Views (full-text article views including HTML views, PDF and ePub downloads, according to the available data) and Abstracts Views on Vision4Press platform.
Data correspond to usage on the plateform after 2015. The current usage metrics is available 48-96 hours after online publication and is updated daily on week days.
Initial download of the metrics may take a while.