Fig. 13
Download original image
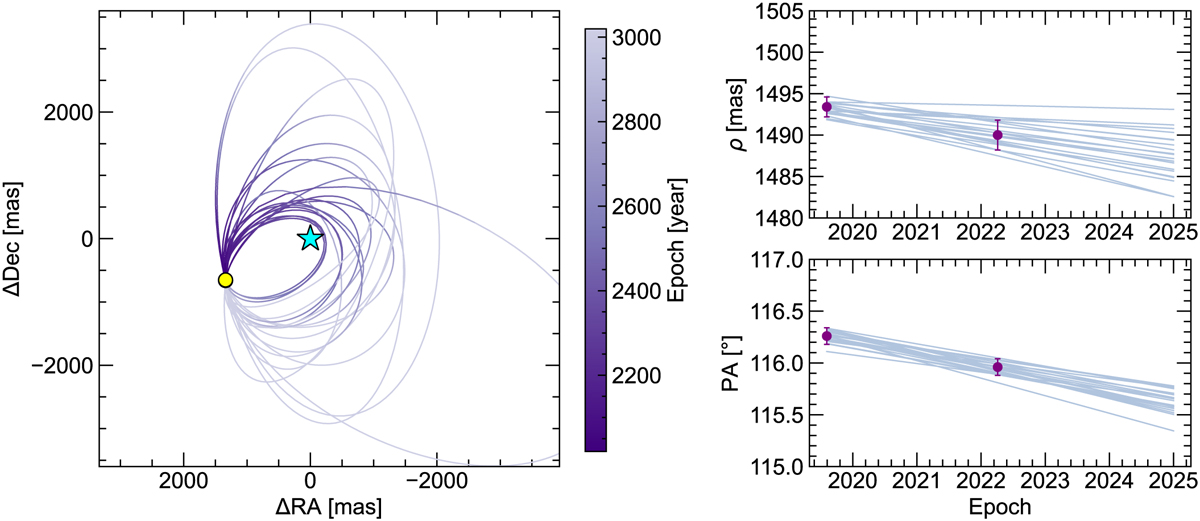
Illustration of 20 random orbits drawn from the posterior distributions from the OFTI run for HIP 81208C. The left panel shows the motion of C in RA and Dec over an entire orbital period for these 20 cases. The change in the position of the companion over the two epochs is very small and the separate data points are not visible as in the previous figure and are therefore represented by a single yellow solid circle. The right panel shows the projected separation ρ and PA (deg) of C over time as predicted from these 20 orbits. The symbols and colour bar hold the same meaning as in the previous figure.
Current usage metrics show cumulative count of Article Views (full-text article views including HTML views, PDF and ePub downloads, according to the available data) and Abstracts Views on Vision4Press platform.
Data correspond to usage on the plateform after 2015. The current usage metrics is available 48-96 hours after online publication and is updated daily on week days.
Initial download of the metrics may take a while.