Fig. 10
Download original image
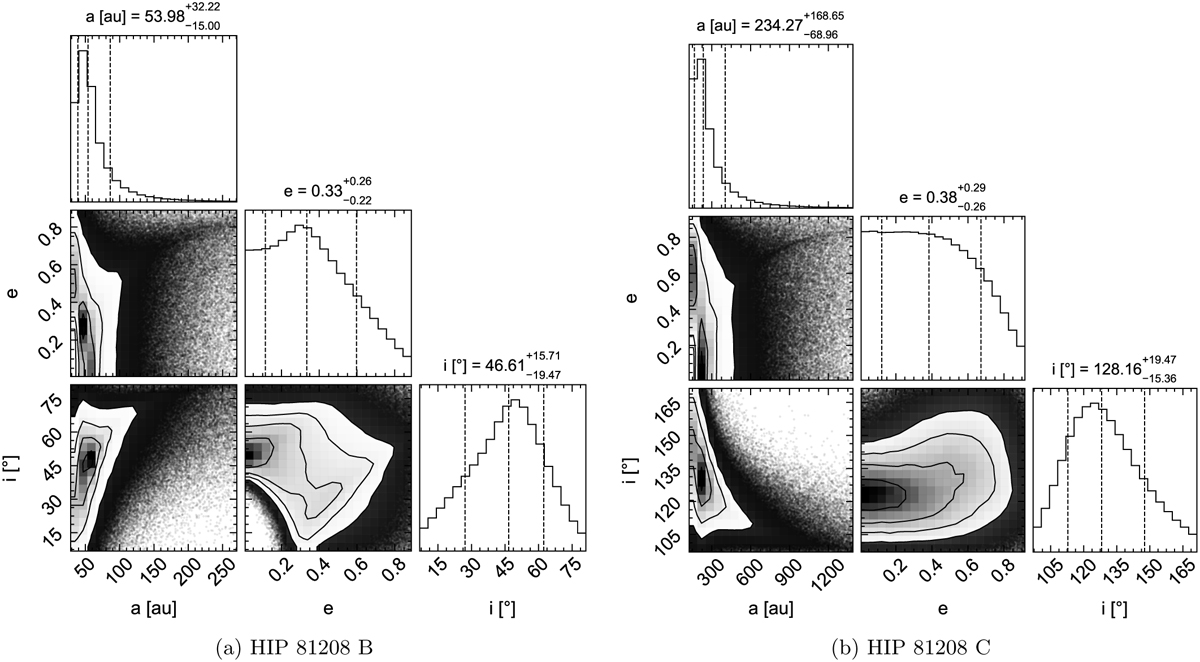
Corner plots for the accepted orbits from OFTI for companions B (a) and C (b). The median values along with upper (84%) and lower (16%) quantile intervals (~±1σ) are shown as dashed vertical lines on the posterior distributions of the respective orbital parameters. The 2D contour plots show the 1σ, 2σ, and 3σ confidence limits to these values.
Current usage metrics show cumulative count of Article Views (full-text article views including HTML views, PDF and ePub downloads, according to the available data) and Abstracts Views on Vision4Press platform.
Data correspond to usage on the plateform after 2015. The current usage metrics is available 48-96 hours after online publication and is updated daily on week days.
Initial download of the metrics may take a while.