| Issue |
A&A
Volume 671, March 2023
|
|
|---|---|---|
| Article Number | A33 | |
| Number of page(s) | 16 | |
| Section | Extragalactic astronomy | |
| DOI | https://doi.org/10.1051/0004-6361/202244983 | |
| Published online | 02 March 2023 | |
Supersoft luminous X-ray sources in galactic nuclei
1
Dipartimento di Fisica e Astronomia, Università di Firenze, Via G. Sansone 1, 50019 Sesto Fiorentino, Firenze, Italy
2
Istituto universitario di Studi superiori di Pavia, Palazzo del Broletto, Piazza della Vittoria 15, 27100 Pavia, Italy
e-mail: andrea.sacchi@iusspavia.it
3
Instituto de Física de Cantabria (CSIC-UC), Avenida de los Castros, 39005 Santander, Spain
4
INAF – Osservatorio Astrofisico di Arcetri, Largo Enrico Fermi 5, 50125 Firenze, Italy
5
Centro de Astrobiología (CAB), CSIC-INTA, Camino Bajo del Castillo s/n, 28692 Villanueva de la Cañada, Madrid, Spain
Received:
15
September
2022
Accepted:
15
December
2022
Context. Tidal disruption events (TDEs) are usually discovered at X-ray or optical wavelengths through their transient nature. A characteristic spectral feature of X-ray detected TDEs is a ‘supersoft’ X-ray emission, not observed in any other extragalactic source, with the exception of a few rapidly variable hyperluminous X-ray sources (HLXs) or supersoft active galactic nuclei (AGN) that are distinguishable by their optical emission.
Aims. The goal of our work is to find extragalactic supersoft sources associated with galactic centres. We expect this category to include overlooked TDEs, supersoft AGN, and nuclear HLXs. Finding such sources would allow for the study of extreme regime accretion on different black hole mass scales.
Methods. We searched for supersoft X-ray sources (SSSs) by cross-correlating optical and X-ray catalogues to select extragalactic near-nuclear sources and we then filtered for very steep spectra (photon index Γ > 3) and high X-ray luminosities (LX > 1041 erg s−1).
Results. With our blind search we retrieved about 60 sources, including 15 previously known supersoft AGN or TDEs, thus demonstrating the efficiency of our selection. Of the remaining sample, 36 sources are optically classified as AGN, although they show steeper-than-usual spectra. The remaining nine previously unknown sources show spectral properties consistent with emission by extremely soft-excess dominated AGN (five sources) or TDEs (four sources). An XMM-Newton follow-up observation of one of these sources confirmed its likely TDE nature.
Conclusions. Our work is the first attempt to discover TDEs by their spectral features rather than their variability, and it has been successful in retrieving known TDEs and in discovering new extreme ultrasoft sources, including four new TDE candidates, one of which is confirmed via follow-up observations.
Key words: galaxies: nuclei / X-rays: galaxies / accretion, accretion disks / galaxies: active
© The Authors 2023
 Open Access article, published by EDP Sciences, under the terms of the Creative Commons Attribution License (https://creativecommons.org/licenses/by/4.0), which permits unrestricted use, distribution, and reproduction in any medium, provided the original work is properly cited.
This article is published in open access under the Subscribe to Open model. Subscribe to A&A to support open access publication.
1. Introduction
Supersoft X-ray sources (SSSs) are objects emitting in the X-ray band with typical effective temperatures kT ∼ 20 − 100 eV and observed luminosities rarely exceeding a few times 1038 erg s−1, but well above what can be produced in stellar coronae (McLaughlin 1942, 1943). Traditionally, SSSs are mostly associated with accreting white dwarfs (WDs), where mass transfer leads to nuclear fusion on the WD surface either in the form of runaway events (as in classical novae) or in a steady manner for some systems with high mass accretion rates. Today ∼80 novae have been observed in the X-ray band including extragalactic ones in the Magellanic Clouds, M31 and M33 (see Della Valle & Izzo 2020 and references therein for a review).
However, novae and/or steady nuclear burning WDs are not the only known extragalactic SSSs, and some intriguing classes of X-ray emitting objects appear to sometimes fall in this very same category. In particular, possible high-luminosity members of this class may include soft ultraluminous X-ray sources (ULXs; Swartz et al. 2004; Liu & Bregman 2005; Walton et al. 2011; Kaaret et al. 2017), tidal disruption events (TDEs; Komossa 2015; Auchettl et al. 2018; Saxton et al. 2020; Gezari 2021), and supersoft active galactic nuclei (AGN) whose X-ray luminosity is almost entirely emitted below ∼2 keV (Terashima et al. 2012; Sun et al. 2013). Heavily obscured AGN may also predominantly shine in the soft X-ray band because reprocessed and/or scattered emission on large scales can easily dominate over the heavily absorbed intrinsic emission for large enough column densities, although the X-ray emission is usually not as steep as in the other classes of objects (Guainazzi et al. 1999; Comastri 2004; Bianchi et al. 2006; Guainazzi & Bianchi 2007).
Ultraluminous X-ray sources are defined as off-nuclear X-ray sources with luminosities exceeding 1039 erg s−1. Detailed observations and modelling in recent years favour an interpretation of the ULX phenomenon in terms of supercritical accretion onto stellar mass black holes and neutron stars (e.g. Middleton et al. 2012, 2015; Bachetti et al. 2014). Unlike typical ULXs, which are often associated with significant emission above 1–2 keV, a sub-class of sources dubbed ultraluminous supersoft X-ray sources (ULSs) are dominated by a thermal-like component with a typical effective temperature of 50 − 200 eV possibly due to reprocessing in an optically thick outflow blocking most or all hard X-ray photons from view (see e.g. Urquhart & Soria 2016; Feng et al. 2016; Pinto et al. 2017). On the other hand, the most luminous examples of ULXs (LX ≳ 1041 erg s−1), known as hyperluminous X-ray sources (HLXs), are of particular interest as they can be considered bona fide intermediate-mass black hole (IMBH) candidates (e.g. Farrell et al. 2009). As the thermal X-ray emission from accretion discs around IMBHs is naturally expected to dominate the soft X-ray band, accreting IMBH candidates are likely to be observed as hyperluminous ULSs. Most ULX (and HLX) searches so far are biased in favour of off-nuclear sources to avoid potential confusion with AGN (see e.g. Barrows et al. 2019). However, IMBHs are also expected to be found in the nuclear regions (e.g. Chilingarian et al. 2018).
Tidal disruption events occur when a star wanders too close to a massive black hole. The tidal forces of the hole tear the star apart and destroy it. The stellar debris is subsequently partly ejected and partly accreted onto the hole generating a bright transient. The study of TDEs is of particular interest as this kind of event offers a unique way to investigate otherwise quiescent (non-AGN) supermassive black holes (SMBHs) that lurk in the centres of most known galaxies. The rapid evolution of the electromagnetic emission from TDEs (Rees 1988; Phinney 1989) also offers a unique opportunity to study different SMBH accretion regimes in the same source on human timescales. The optically thick accretion disc that the stellar debris should form around the hole is predicted to emit thermal radiation with a characteristic temperature of some tens of eV; this blackbody radiation would have a visible tail in the X-ray band, appearing as an extremely steep power-law spectrum. The first TDE candidates were found in the ROSAT All Sky Survey as bright transients with very soft X-ray spectra (Γ ≈ 3 − 5; Bade et al. 1996). X-ray TDEs have typical peak X-ray luminosities in the range of few × 1042 − few × 1044 erg s−1. Their high-luminosity X-ray spectrum is generally well described by thermal spectral models with kT = 40 − 80 eV, often evolving into a harder spectral shape possibly due to an emerging hard X-ray power-law component that may signal the formation, as the Eddington ratio decays, of the optically thin X-ray corona that characterizes the X-ray emission in AGN above 1–2 keV (Wevers 2020). However, the spectral evolution is diverse, and some events actually evolve softening and or maintaining a roughly constant spectral shape (see Saxton et al. 2020 for a review). Currently, the most efficient methods employed to identify TDEs involve the detection of bright transients followed by multi-wavelength observations focused on determining their natures. The bright transients are usually spotted serendipitously, be it in the optical or X-ray band, by the comparison between old catalogues and new observations of large sky portions. Although these methods are efficient in finding new events, it is likely that several TDEs are hidden in available catalogues and archives, being spotted by chance at or near their luminosity peak.
In the X-ray band, the supersoft X-ray emission from TDEs is remarkably different from typical unobscured AGN and can be used to distinguish between the two classes, at least at the zeroth-order. AGN have X-ray spectra that are typically well described with a power-law component with Γ ∼ 1.9 dominating above 1 − 2 keV. In the soft X-rays the spectrum is often dominated by a softer X-ray component that can be phenomenologically described with blackbody emission, typically kT ∼ 100 − 200 eV (Piconcelli et al. 2005). Reflection and absorption components are often superimposed on the general continuum shape described above. While the hard power law is most likely due to inverse-Compton scattering of the softened UV–EUV accretion disc photons in an optically thin and hot (kT ≳ 100 keV or so) X-ray corona, the origin of the soft excess is still debated, although models invoking Comptonization in an optically thick warm (kT ∼ 100 − 200 eV) corona have recently attracted much attention (Done et al. 2012; Petrucci et al. 2018).
Finally, a few X-ray supersoft AGN with peculiar optical and X-ray properties have emerged in recent years. 2XMM J123103.2+110648 (Terashima et al. 2012; Ho et al. 2012) is an optically classified Seyfert 2 galaxy with supersoft X-ray spectrum and significant X-ray variability, mostly associated with a claimed ∼3.8 h periodicity (Lin et al. 2013). Two other very similar objects, GSN 069 (Miniutti et al. 2013, 2019) and RX J1301.9+2747 (Sun et al. 2013; Shu et al. 2017; Giustini et al. 2020), exhibit spectacular recurrent X-ray variability in the form of short-lived and very high-amplitude X-ray bursts occurring every few hours and superimposed to a quiescent constant level (quasi-periodic eruptions, or QPEs, see Miniutti et al. 2019; Giustini et al. 2020). In all three cases, optical spectra show Seyfert-like narrow emission lines but no sign of broad lines, which may indicate past activity and recent re-activation. QPEs were later detected in two other sources with no sign of black hole activity in the optical by eROSITA, and then confirmed with NICER and XMM-Newton follow-up observations (Arcodia et al. 2021). Another QPE candidate was identified in a likely TDE source (Chakraborty et al. 2021). All of these sources are associated with exceptional X-ray variability, no sign of X-ray absorption, supersoft X-ray spectra, and general properties pointing towards relatively low-mass black holes (105 − 106 M⊙) and high mass accretion rates. The peculiar behaviour both in the X-ray and optical bands (i.e. the lack of broad optical emission lines in GSN 069 and RX J1301.9+2747) may perhaps be understood if these sources were long-lived TDEs rather than AGN, and although this point is still being debated, indeed there are convincing signs that this is the case at least for GSN 069 (Sun et al. 2013; Lin et al. 2017a; Shu et al. 2018; Sheng et al. 2021).
Here we present results from a search for SSS X-ray sources associated with the central region of external galaxies restricted to X-ray luminosities exceeding 1041 erg s−1. Our search could in principle reveal a sample of new overlooked TDEs, nearly nuclear supersoft HLXs, and a population of supersoft AGN.
2. Source selection
In order to identify interesting sources we started from the XMM-Newton catalogue of serendipitous sources (4XMM-DR9, Webb et al. 2020). For each of the more than 8 × 10⁵ detections we computed the signal-to-noise ratio in the ultrasoft and soft band (S/N0.2 − 0.5 keV and S/N0.5 − 1 keV, respectively) and the photon index for the ultrasoft to soft and soft to medium (1 − 2 keV) bands (Γ0.2 − 1 keV and Γ0.5 − 2 keV, respectively). As the goal was to filter for reliable supersoft sources, we selected all detections with steep and high-quality spectra in the ultrasoft band (i.e. Γ0.2 − 1 keV > 3, S/N0.2 − 0.5 keV > 7, and S/N0.5 − 1 keV > 3). The selection in the ultrasoft band however allows for little to no absorption (even compared with the average Galactic value). To solve this issue, to the previous selection we added all detections with steep and high-quality spectra in the soft band (Γ0.5 − 2 keV > 3 and S/N0.5 − 1 keV > 7), although, in order to avoid possible contamination by star-forming regions, dominated in the softer X-ray band by thermal and/or photoionized plasma emission, we also imposed a constraint on the ultrasoft to soft photon index: Γ0.2 − 1 keV > −1.
In order to obtain the redshift information we cross-matched our selected sources with four galaxy catalogues that exploit SIMBAD tools: SDSS DR16 (Ahumada et al. 2020), 2dFGRS (Colless et al. 2003), 6dFGS DR3 (Jones et al. 2009), and LCRS (Shectman et al. 1996), listed in order of their dimensions. With the distance information, we computed the X-ray luminosity for each detection in the full 0.2 − 12 keV band and selected only those with LX > 1041 erg s−1. This allows us to exclude possible Galactic SSSs. The sample resulting from this selection is composed of 61 sources.
We also excluded an additional source, SDSS J123408.85+090542.4, which is the brightest cluster galaxy (BCG) of SDSSCGA 1202, a compact cluster (Yoon et al. 2008). Spectral analysis of the soft X-ray emission of this galaxy revealed an optically thin warm gas with solar abundance. This strongly suggests that its emission is due to gas warming up while falling in the potential well of the cluster, ruling out the possibility of accretion phenomena.
Figures 1 and 2 show in the LX − Γ0.2 − 1 keV and LX − Γ0.5 − 2 keV plane, respectively, the 60 selected sources. Figure 1 shows the 31 sources selected in the ultrasoft band, while Fig. 2 the 29 retrieved from the soft band selection.
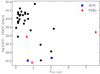 |
Fig. 1. Thirty-one sources selected in the ultrasoft band shown in the LX − Γ0.2 − 1 keV plane. The blue squares and red diamonds show respectively the extreme AGN and TDEs known in the literature. |
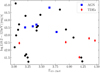 |
Fig. 2. Twenty-nine sources selected in the soft band shown in the LX − Γ0.5 − 2 keV plane. The blue squares and red diamonds show respectively the extreme AGN and TDEs known in the literature. |
Fifteen objects, out of the remaining 60, are well-studied sources with abundant literature. They are characterized by extreme X-ray properties, both in terms of (soft) spectral shape and variability on long and short terms. There are eight TDEs or TDE candidates: 2MASX J02491731-0412521 (Esquej et al. 2007); ASASSN-15oi (Holoien et al. 2016); ASASSN-14li (Maksym et al. 2014); 2XMM J123103.2+110648 (Lin et al. 2017b); 2MASS J12013602+3003052 (Saxton et al. 2012); SDSS J150052.07+015453.8 (Lin et al. 2017a); GSN 069 (Shu et al. 2018; Miniutti et al. 2019; Sheng et al. 2021), which is a convincing TDE candidate but also show huge X-ray bursts along with QPEs and slow decay in luminosity with possible rebrightening; 2MASX J19271951+6533539, a changing look AGN with variability possibly caused by a TDE (Ricci et al. 2020); and 2XMM J141711.0+522541, a likely TDE onto an IMBH appearing as a bright off-nuclear transient (Lin et al. 2016). There are seven extreme AGN, characterized by supersoft X-ray emission coupled with outstanding short and/or long term variability: RX J1301 (Giustini et al. 2020), which is associated with QPEs; 2MASX J10343860+3938277, which exhibits a bright soft excess and quasi-periodic oscillations (Gierliński et al. 2008); the Seyfert galaxies 4U 0708-49 (Boller et al. 2002), 2MASX J13251937-3824524 (Boller et al. 1997), and 2MASX J14062191+2223462 (Mallick & Dewangan 2018), which all show highly variable narrow emission lines; and PHL 1092, a quasar with extremely variable weak lines and also often X-ray-weak narrow lines (Miniutti et al. 2009a).
The presence of these 15 sources in our sample represents a strong and reassuring check of our selection criteria and their effectiveness in retrieving supersoft sources falling into the categories described in the introduction. These 15 sources have been extensively studied and well monitored in the past in the X-ray band, and therefore we do not discuss them here.
For the 45 sources, we retrieved the EPIC data from the XMM-Newton science archive and reduced them following the standard procedure. Data from the EPIC-MOS cameras were merged together. Periods of high background were accounted for by inspecting the light curve of the entire observation and removing the time intervals in question. Source spectra were extracted from a circular region centred on the source position with ≈15″ radius. The background spectra were extracted from source-free regions on the same detector chip as the sources. Due to the supersoft nature of the sources we are interested in, we consider data between 0.2 and 8 keV because most of the X-ray counts are actually concentrated in the very soft X-ray band and the spectra, in particular of the most interesting sources, are background dominated already above ∼5 keV. However, we comment on the possible impact of calibration uncertainties below 0.3 keV (see the EPIC Status of Calibration and Data Analysis1 for details) on a source-by-source basis in our analysis below. We regrouped the spectra in order to have a minimum of one count in each channel, and consequently employed the C-statistic for the fitting procedure. Any further rebinning was adopted solely for graphical purposes. The spectral analysis was performed using the XSPEC package. The standard model we adopted at first for all of our sources is composed of an absorbed blackbody plus power law, redshifted to the source distance (zTBabs × (zbbody + zpowerlw) in XSPEC) with an additional layer of absorption (TBabs) with column density fixed to the Galactic value.
Out of these sources, we identified 30 sources optically classified as broad-line AGN (BLAGN; 19 by Pâris et al. 2018, 4 by Véron-Cetty & Véron 2010, 3 by Pierre et al. 2016, 2 by Rakshit et al. 2017, 1 by Bär et al. 2017, and 1 by Esquej et al. 2013). These sources are characterized by slightly steeper-than-usual X-ray spectra. Their emission, however, is still compatible with their optical classification and likely due to relatively strong soft-excess with blackbody temperatures kT ∼ 100 − 200 eV with their high-energy emission taken into account by a power law. These sources, rather than being outstanding AGN, just represent the soft X-ray bright tail of the AGN population.
We also identified three sources optically classified as Seyfert 2 galaxies. One of these, 2MASX J10181928+3722419, sees its emission in the soft X-ray band dominated by star formation activity rather than accretion (LaMassa et al. 2012). The second, NGC 6264, classified by Véron-Cetty & Véron (2010), hosts an H2O megamaser (Castangia et al. 2013); it is also a well-known Compton-thick AGN. The last one, 2dFGRS TGS243Z047, was classified as a heavily obscured AGN by Lacy et al. (2013).
Two star-formation dominated sources were identifed. 2XMM J021704.5-050214 was classified as an elusive AGN with star-forming activity (Menzel et al. 2016) and 2MASX J17020882+6412210 was classified as a star-forming galaxy by Mickaelian et al. (2018). The X-ray analysis of their emission confirms that their emission is in fact consistent with star formation activity rather than nuclear activity phenomena.
The last source, 2dFGRS TGS431Z029, was classified as a non-active galaxy (Lavaux & Hudson 2011), given the lack of emission line in its optical spectrum. It has a soft X-ray emission distinctive of an obscured, possibly Compton-thick AGN. A dedicated forthcoming publication (Sacchi et al., in prep.) will address in detail the emission by this peculiar source.
The spectral parameters of these 36 sources are collected in Table B.1. Figures B.1 and B.2 show the highest quality spectrum of each source. These sources are not discussed further here.
The remaining nine sources show X-ray emission not immediately consistent with their optical classification. To address their peculiar behaviour, these sources are described and analysed individually in the following section.
3. Peculiar supersoft sources
Here we describe in detail the sources whose X-ray properties do not resemble the typical AGN and/or that deviate from the expected behaviour based on optical classification. We modelled the X-ray emission of our sources using three different models: absorbed blackbody (zTBabs × zbbody in XSPEC); absorbed power law (zTBabs × zpowerlw in XSPEC); and absorbed blackbody plus power law (zTBabs × (zbbody + zpowerlw) in XSPEC). Each spectral component is redshifted to the source distance, and we added an additional layer of absorption (TBabs) with column density fixed to the Galactic value for each spectral model.
When multiple observations were available for the same source, we fitted all observations jointly. We started by keeping all the fitted parameters linked together over different observations, freeing them one at a time and checking for any improvement in the statistics through an F-test with 5% acceptance threshold. The resulting best-fitting models and spectral parameters are reported in Table 1.
Constraints on the spectral fits to the nine supersoft sources.
As per the X-ray light curves, we found no clear short-term variability in our sample. As a cautionary remark, it is worth pointing out that this could be partly due to the fact that the sources are generally faint, and therefore need temporal binning often larger than 1 ks in order to obtain meaningful signal-to-noise ratios in the individual bins. We divided these nine sources into three groups based on their spectral properties, as detailed below.
3.1. Sources with a drop in flux above 2 keV
By visual inspection of our sources, we found that two of them show an extremely soft spectrum mainly because of a steep drop in their flux above ∼2 keV. In order to estimate the importance of the soft excess we compared the emission in the 0.5 − 2 keV and 2 − 10 keV bands. The emission in the hard band was calculated modelling the data above 2 keV with a power law with photon index fixed to 1.9 and fixed Galactic absorption. This was done in order to avoid the fit in the hard band being dominated by the extrapolation of a power-law component that is constrained only by soft data. We note that this differs from the best-fitting parameters reported in Table 1, but it is a better choice in order to isolate the contribution of the two spectral components. In both cases the emission in the hard band is so faint that only upper limits were retrieved. Figure 3 shows the comparison between these supersoft sources and standard (in terms of X-ray properties) PG quasars (Piconcelli et al. 2005; Miniutti et al. 2009b). It is clear that the sources from our sample have much larger soft excess than typical broad line quasars or, in other words, that they are extremely hard X-ray-weak sources, completely dominated by a thermal-like component.
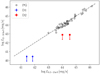 |
Fig. 3. L2−10 keV vs. L0.5−2 keV for PG quasars (black circles) and for our sources (coloured symbols). The dashed line is the bisector. For each of the two sources, the two points refer to different observations. The hard band luminosities are upper limits. |
[CRS2013] 4. labelled D1, has a photometric redshift of z = 0.115 from the SDSS DR8 (Aihara et al. 2011); no optical spectral information is available. Although this source is probably associated with the outskirts of the ACO 2443 cluster (Clarke et al. 2013), its X-ray spectrum strongly deviates from thermal plasma emission (e.g. the apec model in XSPEC). This source has been observed on three occasions: twice by Chandra, in 2010 and 2013, and once by XMM-Newton, in 2015. data were extracted following the standard procedure. The extraction region for source and background were respectively taken as a circular region of ≈2″ around the source position and as a disjointed annulus surrounding it. The data were regrouped to have at least one count in each channel. Spectral fitting was performed on data between 0.3 and 8 keV. The spectrum of the source is best fit by a blackbody with a temperature of about 150 eV and no intrinsic absorption nor power-law component in the hard X-ray band. The source luminosity in the 0.5 − 2 keV range shows significant variability on timescales of years, going from 6.5 to 2.5 × 1042 erg s−1 from the first to the second observation, while it remains constant from the second to the third. The soft X-ray emission of D1 is at least one order of magnitude larger than in PG quasars with respect to that expected from the hard X-ray luminosity upper limit of 3 × 1040 erg s−1. Its X-ray spectrum is shown in Fig. 4.
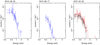 |
Fig. 4. X-ray spectra of the source labelled D1. The blue data are from Chandra, black from the XMM-Newton EPIC-pn camera, and red from the merged EPIC-MOS one. The solid lines show the best-fitting model. |
2XLSSd J021728.4-041346. labelled D2, is located at z = 1.173 and was catalogued as an AGN by spectral energy distribution (SED) fitting (Melnyk et al. 2013; Liu et al. 2016) as only photometric information is available. The source has five XMM-Newton observations; the first three were taken between 8 and 9 January 2007 and here are merged together. The fourth observation was taken in July 2008, and the last in February 2015. The data of all observations were fitted jointly, and the best-fitting model is an extremely steep power law with photon index Γ = 5 (or, almost equivalently, a blackbody with a temperature of about 140 eV). The X-ray luminosity on the 0.5–2 keV range of the source suffers a drop of almost a factor of 3.5, from 4 × 1044 to 1.2 × 1044 erg s−1 between the first and last observation. In each observation the soft X-ray emission is more than one order of magnitude larger in comparison to the standard PG quasars, given that its 2 − 10 keV emission is below 8 × 1042 erg s−1, as shown in Fig. 3. The X-ray spectrum of the source is shown in Fig. 5.
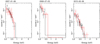 |
Fig. 5. X-ray spectra of the source labelled D2. The colour-coding is the same as in the previous plots. Only the highest signal-to-noise observation of the three performed in July 2008 is shown. |
3.2. Peculiar AGN
Three sources in our sample are optically classified as AGN and are selected here because they exhibit a peculiar supersoft spectral component at least during one observation. As for the previously discussed sources, no clear short-term variability has been found in these sources.
[VV2006] J231419.8-525901, labelled P1, is located at a spectroscopic redshift z = 0.15575 (Jones et al. 2009) and is classified as a Seyfert 1 galaxy (Véron-Cetty & Véron 2006). It was observed once by XMM-Newton, and its spectrum is best fit by a blackbody plus power law model with no intrinsic absorption. The power law is steep and mostly constrained by soft X-ray data below 2 keV, with a photon index Γ > 2.6. What makes this source peculiar is the extremely cold blackbody of just kT ∼ 20 eV dominating the ultrasoft X-ray band. Such a cold thermal-like component, detected in both the EPIC-pn and MOS cameras, is unprecedented in the X-ray spectra of type 1 AGN. The X-ray luminosity of P1 is about 6 × 1041 erg s−1. The X-ray spectrum of the source is shown in Fig. 6.
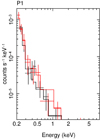 |
Fig. 6. X-ray spectrum of source P1. The colour-coding is the same as in the previous plot. |
2XMM J122517.6+175726, labelled P2, has a spectroscopic redshift z = 0.8053 and is catalogued as a QSO (Pâris et al. 2014). It was observed once in July 2004, and then three times in December 2010. For the first observation we only have data from the EPIC-MOS camera, while for the last three observations we only have EPIC-pn data. We analysed the first observation separately, while the last three were treated together as they were taken only a few days apart. In 2004, given the poor quality of the data, the source spectra were best fit by a simple power-law model (Γ ∼ 3) with a drop in flux below ∼0.4 keV. We modelled this drop with extra-absorption at the source redshift, which results in a column density of  atoms cm−2. The unabsorbed luminosity of the source in the first observation is about 6 × 1044 erg s−1, consistent with the QSO classification. Remarkably, no extra-absorption is present during the 2010 observations, and the spectrum of the source is best fit by a blackbody plus power law model, with a very low blackbody temperature of kT ∼ 20 eV, and the photon index of the power law Γ ∼ 2. The appearance of such a cold thermal-like component makes P2 a similar source to P1 in terms of spectral shape. The luminosity of the source in 2010 is about 1.5 × 1044 erg s−1 and shows a small but statistically significant decrease between the first and last two observations. The X-ray spectrum of the four observations is shown in Fig. 7. We note that the supersoft component is only detected in observations where EPIC-pn data alone are available. We cannot rule out that it is spurious and due to calibration uncertainties. This caveat does not fully apply to source P1 as the supersoft component is consistently detected by both EPIC-pn and EPIC-MOS cameras.
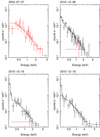 |
Fig. 7. X-ray spectra of source P2. The colour-coding is the same as in the previous plots. |
2XMM J022255.9-051352, labelled P3, is catalogued as a Seyfert 1 galaxy (Véron-Cetty & Véron 2010) and has a spectroscopic redshift z = 0.846478. The source has been observed on four different occasions: once in 2001, twice in 2016, and once in 2017 (although in this last observation the quality of the data is extremely poor). Its X-ray spectrum shows strong spectral variability associated with roughly constant luminosity, although the same caveat highlighted for source P2 should be kept in mind. The best-fitting model for this source is a blackbody with no intrinsic absorption. During the first 2016 observation, the spectrum is dominated by cold blackbody emission with kT ∼ 40 eV, while during the second (two weeks later) the temperature is much higher: kT ∼ 240 eV. In 2001 and 2017 (this last observation has a much lower signal-to-noise ratio), the blackbody temperature is instead kT ∼ 120 eV. Unfortunately, as the supersoft component is only detected in the EPIC-pn data, we cannot rule out the possibility that this component is related to time-dependent calibration uncertainties. The X-ray spectrum of the source is shown in Fig. 8.
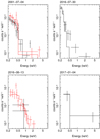 |
Fig. 8. X-ray spectra of source P3. The colour-coding is the same as in the previous plots. |
3.3. Candidate TDEs
Here we present a detailed analysis of four sources that we consider strong TDE candidates, although other scenarios cannot be completely ruled out. Two of these sources (T1 and T2), classified as non-active star-forming galaxies owing to their optical properties, show soft X-ray emission characterized by high luminosity and a steep spectral shape, which strongly favours a TDE interpretation. Unfortunately, these two sources have only one observation, preventing us from studying their long-term evolution. The other two sources (T3 and T4) have instead been observed more than once, and we can therefore provide long-term information coupled with X-ray spectroscopy and optical classification. Below we show the properties of each of these TDE candidates.
2MASX J00414632-2827423, labelled T1, is located at a spectroscopic redshift z = 0.0744 (Colless et al. 2001). It is classified as a non-active galaxy (Paturel et al. 2003). In its sole XMM-Newton observation the spectrum of this source can be well reproduced by a cold blackbody of about 100 eV temperature (kT = 0.11 ± 0.01 keV). The X-ray luminosity of this source is about 2 × 1041 erg s−1. Although a TDE scenario can nicely explain the properties of this source, the source is in the far outskirts of the Sculptor cluster, and hence its X-ray emission could in principle be associated with the diffuse cluster emission. In order to check this hypothesis, we extracted background spectra from different source-free regions (always on the same detector’s chip), but no differences in the spectral fitting results were found. Moreover, the statistical quality of fits made using a thermal plasma emission model (as expected from the cluster’s hot gas) is significantly worse than that obtained with the blackbody model (ΔC = 21.02 with the same degrees of freedom), so that the source appears likely accretion-powered. The X-ray spectrum of the source is shown in Fig. 9.
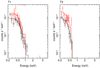 |
Fig. 9. X-ray spectra of the candidate TDEs with only one observation: T1 (left panel) and T2 (right panel). The colour-coding is the same as in the previous plots. |
GAMA 91637, labelled T2, has a spectroscopic redshift z = 0.1775 from the GAMA survey (Driver et al. 2011). This source is optically classified as a non-active galaxy (Liske et al. 2015). It was observed only once with XMM-Newton and its X-ray spectrum is best fit by a cold blackbody (kT ∼ 60 eV) with no intrinsic absorption. We tested once again the blackbody model versus the thermal plasma model. Again we found that a blackbody can describe the data significantly better than the rival thermal plasma model (ΔC = 5.88 for the same degrees of freedom). The X-ray luminosity for this source is ∼4 × 1041 erg s−1, and its X-ray spectrum is shown in Fig. 9.
XXL-AAOmega J234255.95-543001.8, labelled T3, has a spectroscopic redshift z = 0.28633 and, due to the presence of broad emission lines in its optical spectrum, it is catalogued as an AGN (Pierre et al. 2016; Lidman et al. 2016). It was observed with XMM-Newton once in October 2009 and a second time on December 2012. During the first observation the source was not detected; the 3σ upper limit to its luminosity was ∼4 × 1042 erg s−1. This upper limit was computed using the upper limit server2 assuming a kT = 100 eV blackbody spectrum. During the second observation, the luminosity of the source was ∼1.5 × 1043 erg s−1, almost an order of magnitude higher than the upper limit of three years earlier. A blackbody with a temperature kT ∼ 80 eV and no intrinsic absorption can very nicely reproduce the spectrum during this second observation. These X-ray properties appear to be consistent with a TDE detected near its peak, possibly occurring in a pre-existing faint AGN. An alternative scenario involves an extreme variability event from an AGN. The X-ray spectrum of the source is shown in Fig. 10.
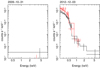 |
Fig. 10. X-ray spectra of source T3. The colour-coding is the same as in the previous plots. |
SDSS J152717.95+164503.2, labelled T4, has a spectroscopic redshift z = 0.0606 from the SDSS DR9 (Ahn et al. 2012). This source, like T1 and T2, is catalogued as a non-active star-forming galaxy with a star formation rate of logSFR = − 0.1192 M⊙ yr−1 (Toba et al. 2014; Duarte Puertas et al. 2017). It had only one archival observation with XMM-Newton, in August 2010. At that epoch the X-ray spectrum of the source can be nicely modelled by a cold blackbody with kT ∼ 60 eV and no intrinsic absorption. Given the optical classification of star-forming galaxies, we challenged the blackbody model with a thermal plasma model (apec model in XSPEC) in order to rule out the possibility that the soft X-ray emission is due to star formation rather than accretion. We found that the blackbody model reproduces the data significantly better (ΔC = 5.36 with the same degrees of freedom). The X-ray luminosity between 0.5 and 2 keV of the source was 1041 erg s−1.
3.4. Follow-up observation of T4
One obvious way to confirm the TDE nature of the four candidates is through a new X-ray observation; the long-term decay of supersoft sources has been used for decades to assess its TDE nature. We asked for new observations with XMM-Newton and the source labelled T4 was re-observed in January 2022. After 12 yr the spectral shape of the source is unchanged, strongly suggesting that we are still observing the source rather than the host galaxy emission, and its X-ray luminosity dropped by a factor ≈20. Its spectrum is shown in Fig. 11.
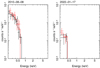 |
Fig. 11. X-ray spectra of T4: the archival one from an observation in 2010 (left panel) and the new one obtained with the pointed observation in 2022 (right panel). The soft flux dropped by a factor of ∼20. The colour-coding is the same as in the previous plots. |
4. Discussion
We presented a sample of supersoft luminous X-ray sources that are associated with the central regions of galaxies with the main goal of identifying a series of potentially interesting objects ranging from overlooked X-ray TDEs to supersoft AGN. Starting from the more than 8 × 10⁵ detections in the latest XMM-Newton catalogue, we obtained a final sample of 60 sources sharing similar spectral features and X-ray luminosities well above 1041 erg s−1. Of these 60 sources, 15 turned out to be well-known TDEs, TDE candidates, or AGN with extreme spectral or variability properties, confirming that our selection criteria can indeed single out the correct population of X-ray sources. By performing a complete X-ray spectral analysis of the remaining 45 sources, we identified 36 objects that are either standard type 1 AGN (although somewhat softer than usual in X-rays) or sources such as obscured AGN and/or star-forming galaxies where the soft X-ray emission is dominated by extended emission. One source, 2dFGRS TGS431Z029, is somewhat peculiar as it exhibits an X-ray spectrum consistent with a heavily obscured AGN despite being classified as a non-active galaxy due to the lack of optical emission lines (Sacchi et al., in prep.). The remaining nine sources have spectral properties that most significantly deviate from the expected behaviour based on optical classification and/or do not resemble those of standard AGN. We focus our discussion on these nine sources.
The X-ray spectra of two sources (D1 and D2) are best described by a blackbody model with a temperature of 140–150 eV (or a steep power law with Γ ∼ 5), rather typical of AGN soft excesses. However, their hard X-ray emission above 2 keV is much fainter than in standard AGN as only upper limits could be derived on the 2–10 keV luminosity, making D1 and D2 two examples of hard X-ray weak sources (or extremely soft excess sources). Long-term variability suggests that their soft X-ray spectrum is not dominated by extended emission nor star formation and that the lack of hard X-ray emission is unlikely to be the signature of Compton-thick AGN. On the other hand, no short-term variability was found in X-rays during any of the observations.
Although only photometric information is available for both D1 and D2, the latter is classified as an AGN by SED fitting, and its X-ray luminosity of a few times 1044 erg s−1 (about two orders of magnitude higher than for D1) is consistent with that classification, although this X-ray luminosity is also consistent with the early stages of TDE evolution. As in AGN, the X-ray spectrum of D2 is reminiscent of narrow-line Seyfert 1 galaxies, often characterized by a prominent soft X-ray excess, and could then represent a particularly extreme version of standard BH accretion, most likely associated with a high accretion rate.
The same interpretation applies to D1 as well. The possibility that D1 (and/or D2) is a TDE observed by chance relatively close to its X-ray peak appears unlikely because of the persistent X-ray emission with only limited dimming over the course of several years (about five and eight years, respectively), and because the inferred temperature of the best-fitting blackbody model is significantly higher than in most other X-ray TDEs. However, some cases of extremely long-lived TDE candidates characterized by higher-than-standard blackbody temperature exist (e.g. Lin et al. 2017b), so that a TDE origin for D1 (and/or D2) cannot be firmly ruled out. On the other hand, the X-ray spectrum of D1 is very similar to that of ULSs where the dominant soft X-ray emission can be understood in terms of optically thick outflows blocking the hard X-ray and reprocessing them into a soft thermal component. The X-ray luminosity in excess of 1042 erg s−1 is much higher than that of typical ULSs and could suggest accretion onto an IMBH. Interestingly, the most convincing IMBH candidate to date, ESO 243-49 HLX-1 (Farrell et al. 2009), is both soft and bright enough to satisfy our search criteria, but was not selected here because of its off-centre location.
Three further sources are classified as peculiar AGN (P1, P2, and P3). They are all spectroscopically classified as AGN (two Seyfert 1 galaxies, and one QSO); what makes them special is the presence of at least one epoch in which an extremely soft X-ray component is observed in the spectrum. When modelled as a simple blackbody, we derive temperatures as low as 20 eV in P1 and P2, and 40 eV in P3 for this cold component. It should noted that the cold component is only detected by the EPIC-pn camera in P2 and P3 as the MOS data were not available at that particular epoch. This could in principle signal that the very soft emission is in fact associated with calibration uncertainties of the EPIC-pn (see the EPIC Status of Calibration and Data Analysis3 for details). However, both EPIC cameras are consistent with each other in the case of the only observation of P1 where a rather clear ∼20 eV thermal component is present together with a steep power law.
The only source in our sample where cold X-ray absorption is detected (in excess of the Galactic one) is P2. This is, however, limited to one observation only. The cold component appears six years later and is associated with unabsorbed X-ray spectra, suggesting the possibility that it may have always been present, but masked by absorption during the first observation. On the other hand, the cold component in P3 is transiently seen in one observation of a source that appears to vary wildly spectrally as the best-fitting temperature of simple blackbody models is seen to vary by more than a factor of 2 in about 15 yr.
Summarizing, the five sources D1, D2, P1, P2, and P3 are likely extreme examples of supersoft state in AGN, even if in some cases we cannot rule out a TDE or accretion on an IMBH. Considering their rarity (our selection narrowed down a few such sources from a parent sample of hundreds of thousands of sources), it is possible that they can be explained as the extreme tail of the standard soft-excess emission in AGN. Alternatively, they could be associated with some unusually rare phenomena different from standard accretion. Further observations, both at X-ray and optical wavelengths, are needed to investigate this open problem better.
The final four sources have properties that make them likely TDE candidates. Three of them (T1, T2, and T4) are spectroscopically classified as non-active galaxies and, in the available XMM-Newton observations, they exhibit a soft thermal-like X-ray spectrum that is typical of X-ray TDEs observed close to their peak. When modelled as blackbodies, we derive temperatures of 60 to 110 eV, with luminosities in the range from 1041 erg s−1 to a few 1042 erg s−1, typical of TDEs. The addition of a hard power-law component did not improve the spectral description in any case. This is consistent with TDE X-ray spectral properties, especially during the early stages (Saxton et al. 2020). As only one observation was available for T1 and T2 (we also checked for archival observations of other instruments, such as Swift and ROSAT, but only upper limits above a few 1043 erg s−1 were available), long-term variability cannot be used to support the TDE classification, but the non-active nature of the host galaxies coupled with the relatively high X-ray luminosities and spectral shape is highly suggestive. As already discussed for D1, these three sources may be instead associated with the very high-luminosity end of the ULS population. If so, they would be potential IMBH candidates that have escaped detection to date because searches for ULXs have always concentrated on off-centre sources to avoid confusion with AGN.
The follow-up observation of T4 with XMM-Newton revealed a flux drop of a factor of ∼20 in the soft X-ray, strongly supporting the TDE interpretation, although we observe no hints of the spectral hardening that is often observed in the later phases of TDEs. All things considered, however, it provides a robust validation of our selection method, indirectly supporting the TDE classification of T1, T2, and T3 as well.
One of the sources that we suggest as a possible TDE candidate (T3) is classified as an AGN, due to the presence of broad emission lines in the optical spectrum. T3 was observed twice by XMM-Newton. It was not detected during the first pointing, while it exhibited a rather typical TDE X-ray spectrum in the second pointing performed about three years later. When detected, the X-ray spectrum is best modelled by a blackbody with a temperature of 80 eV and a rather high luminosity exceeding 1043 erg s−1 in the soft 0.5–2 keV band. Based on the optical classification and X-ray properties, the most appealing interpretation for the behaviour of T3 is that of a TDE occurring in a pre-existing AGN. On the other hand, as the upper limit during the first observation is not tight, we cannot firmly exclude that T3 is an AGN with very weak 2–10 keV emission (if any) and highly variable, particularly cold soft X-ray excess.
The presence in our initial sample, comprising 60 sources, of nine well-known TDEs or strong TDE candidates supports our ability to detect them quite efficiently. This is in fact the lowest limit of our efficiency: our algorithm selected three more TDEs, OGLE16aaa (Zhang et al. 2016), 3XMM J152130.7+074916 (Lin et al. 2015), and 2XMMi J1847 (Lin et al. 2011), which satisfy our criterion, but unfortunately they are not associated with their host galaxy redshift in optical catalogues; instead, two other TDEs, [GHC2009] D23H-1 (Gezari et al. 2009) and PS1-13jw (Kankare et al. 2017), were not selected because their X-ray signal-to-noise ratio is below the chosen threshold.
Assuming that the four sources discussed above (T1-T4) are indeed associated with TDEs, we can attempt a rough estimate of the TDE rate and check its consistency with other results in the literature obtained with different methods. From our data we retrieve (see Appendix for details) a rate of (2.4 ± 0.2)× 10−5 gal−1 yr−1, which falls roughly in the middle of the range of TDE rates deduced from X-ray data (Donley et al. 2002; Esquej et al. 2008; Khabibullin et al. 2014).
5. Conclusions
In this paper we described the selection and properties of a sample of supersoft (Γ > 3) luminous (L > 1041 erg s−1) X-ray sources in the nuclear region of external galaxies by cross-matching the latest releases of XMM-Newton and optical catalogues of galaxies.
Our work resulted in the selection of 60 sources, 15 of which turned out to be known examples of the type of sources we are searching for in our study: TDEs, TDE candidates, and supersoft AGN with often extreme X-ray properties. Of the remaining 45 sources, 36 are likely standard AGN and/or star-forming regions based on their X-ray spectral properties, while 9 were selected as further examples of potentially interesting supersoft and X-ray luminous nuclear sources.
Out of these nine sources, five are extremely soft X-ray-dominated AGN, while the remaining four are most likely newly discovered TDEs. These results confirm that a soft X-ray spectroscopic selection is a powerful and promising way to discover new TDEs and peculiar soft X-ray-dominated sources.
Acknowledgments
We thank Emanuele Nardini and Paolo Esposito for the priceless help, insightful discussion and precious comments. Based on observations obtained with XMM-Newton, an ESA science mission with instruments and contributions directly funded by ESA Member States and NASA. This publication is part of the R&D&I project with reference RTI2018-096686-B-C21, funded by MCIN/ AEI/10.13039/501100011033/ FEDER Una manera de hacer Europa.
References
- Ahn, C. P., Alexandroff, R., Allende Prieto, C., et al. 2012, ApJS, 203, 21 [Google Scholar]
- Ahumada, R., Prieto, C. A., Almeida, A., et al. 2020, ApJS, 249, 3 [Google Scholar]
- Aihara, H., Allende Prieto, C., An, D., et al. 2011, ApJS, 193, 29 [NASA ADS] [CrossRef] [Google Scholar]
- Arcodia, R., Merloni, A., Nandra, K., et al. 2021, Nature, 592, 704 [NASA ADS] [CrossRef] [Google Scholar]
- Auchettl, K., Ramirez-Ruiz, E., & Guillochon, J. 2018, ApJ, 852, 37 [NASA ADS] [CrossRef] [Google Scholar]
- Bachetti, M., Harrison, F. A., Walton, D. J., et al. 2014, Nature, 514, 202 [NASA ADS] [CrossRef] [Google Scholar]
- Bade, N., Komossa, S., & Dahlem, M. 1996, A& A, 309, L35 [NASA ADS] [Google Scholar]
- Bär, R. E., Weigel, A. K., Sartori, L. F., et al. 2017, MNRAS, 466, 2879 [CrossRef] [Google Scholar]
- Barrows, R. S., Mezcua, M., & Comerford, J. M. 2019, ApJ, 882, 181 [NASA ADS] [CrossRef] [Google Scholar]
- Bianchi, S., Guainazzi, M., & Chiaberge, M. 2006, A&A, 448, 499 [NASA ADS] [CrossRef] [EDP Sciences] [Google Scholar]
- Boller, T., Brandt, W. N., Fabian, A. C., & Fink, H. H. 1997, MNRAS, 289, 393 [Google Scholar]
- Boller, T., Fabian, A. C., Sunyaev, R., et al. 2002, MNRAS, 329, L1 [Google Scholar]
- Castangia, P., Panessa, F., Henkel, C., Kadler, M., & Tarchi, A. 2013, MNRAS, 436, 3388 [NASA ADS] [CrossRef] [Google Scholar]
- Chakraborty, J., Kara, E., Masterson, M., et al. 2021, ApJ, 921, L40 [NASA ADS] [CrossRef] [Google Scholar]
- Chilingarian, I. V., Katkov, I. Y., Zolotukhin, I. Y., et al. 2018, ApJ, 863, 1 [Google Scholar]
- Clarke, T. E., Randall, S. W., Sarazin, C. L., Blanton, E. L., & Giacintucci, S. 2013, ApJ, 772, 84 [NASA ADS] [CrossRef] [Google Scholar]
- Colless, M., Dalton, G., Maddox, S., et al. 2001, MNRAS, 328, 1039 [Google Scholar]
- Colless, M., Peterson, B. A., Jackson, C., et al. 2003, ArXiv eprints [arXiv: astro-ph/0306581] [Google Scholar]
- Comastri, A. 2004, in Supermassive Black Holes in the Distant Universe, ed. A. J. Barger, Astrophys. Space Sci. Library, 308, 245 [NASA ADS] [CrossRef] [Google Scholar]
- Della Valle, M., & Izzo, L. 2020, A&ARv, 28, 3 [NASA ADS] [CrossRef] [Google Scholar]
- Done, C., Davis, S. W., Jin, C., Blaes, O., & Ward, M. 2012, MNRAS, 420, 1848 [Google Scholar]
- Donley, J. L., Brandt, W. N., Eracleous, M., & Boller, T. 2002, AJ, 124, 1308 [NASA ADS] [CrossRef] [Google Scholar]
- Driver, S. P., Hill, D. T., Kelvin, L. S., et al. 2011, MNRAS, 413, 971 [Google Scholar]
- Duarte Puertas, S., Vilchez, J. M., Iglesias-Páramo, J., et al. 2017, A&A, 599, A71 [NASA ADS] [CrossRef] [EDP Sciences] [Google Scholar]
- Esquej, P., Saxton, R. D., Freyberg, M. J., et al. 2007, A&A, 462, L49 [NASA ADS] [CrossRef] [EDP Sciences] [Google Scholar]
- Esquej, P., Saxton, R. D., Komossa, S., et al. 2008, A&A, 489, 543 [NASA ADS] [CrossRef] [EDP Sciences] [Google Scholar]
- Esquej, P., Page, M., Carrera, F. J., et al. 2013, A&A, 557, A123 [NASA ADS] [CrossRef] [EDP Sciences] [Google Scholar]
- Farrell, S. A., Webb, N. A., Barret, D., Godet, O., & Rodrigues, J. M. 2009, Nature, 460, 73 [Google Scholar]
- Feng, H., Tao, L., Kaaret, P., & Grisé, F. 2016, ApJ, 831, 117 [Google Scholar]
- Gezari, S. 2021, ARA&A, 59, 21 [NASA ADS] [CrossRef] [Google Scholar]
- Gezari, S., Heckman, T., Cenko, S. B., et al. 2009, ApJ, 698, 1367 [Google Scholar]
- Gierliński, M., Middleton, M., Ward, M., & Done, C. 2008, Nature, 455, 369 [CrossRef] [Google Scholar]
- Giustini, M., Miniutti, G., & Saxton, R. D. 2020, A&A, 636, L2 [NASA ADS] [CrossRef] [EDP Sciences] [Google Scholar]
- Guainazzi, M., & Bianchi, S. 2007, MNRAS, 374, 1290 [Google Scholar]
- Guainazzi, M., Matt, G., Antonelli, L. A., et al. 1999, MNRAS, 310, 10 [Google Scholar]
- Ho, L. C., Kim, M., & Terashima, Y. 2012, ApJ, 759, L16 [NASA ADS] [CrossRef] [Google Scholar]
- Holoien, T. W.-S., Kochanek, C. S., Prieto, J. L., et al. 2016, MNRAS, 455, 2918 [NASA ADS] [CrossRef] [Google Scholar]
- Jones, D. H., Read, M. A., Saunders, W., et al. 2009, MNRAS, 399, 683 [Google Scholar]
- Kaaret, P., Feng, H., & Roberts, T. P. 2017, ARA&A, 55, 303 [Google Scholar]
- Kankare, E., Kotak, R., Mattila, S., et al. 2017, Nat. Astron., 1, 865 [NASA ADS] [CrossRef] [Google Scholar]
- Khabibullin, I., Sazonov, S., & Sunyaev, R. 2014, MNRAS, 437, 327 [Google Scholar]
- Komossa, S. 2015, J. High-Energy Astrophys., 7, 148 [NASA ADS] [CrossRef] [Google Scholar]
- Lacy, M., Ridgway, S. E., Gates, E. L., et al. 2013, ApJS, 208, 24 [Google Scholar]
- LaMassa, S. M., Heckman, T. M., & Ptak, A. 2012, ApJ, 758, 82 [NASA ADS] [CrossRef] [Google Scholar]
- Lavaux, G., & Hudson, M. J. 2011, MNRAS, 416, 2840 [Google Scholar]
- Lidman, C., Ardila, F., Owers, M., et al. 2016, PASA, 33, e001 [NASA ADS] [CrossRef] [Google Scholar]
- Lin, D., Carrasco, E. R., Grupe, D., et al. 2011, ApJ, 738, 52 [NASA ADS] [CrossRef] [Google Scholar]
- Lin, D., Irwin, J. A., Godet, O., Webb, N. A., & Barret, D. 2013, ApJ, 776, L10 [NASA ADS] [CrossRef] [Google Scholar]
- Lin, D., Maksym, P. W., Irwin, J. A., et al. 2015, ApJ, 811, 43 [NASA ADS] [CrossRef] [Google Scholar]
- Lin, D., Carrasco, E. R., Webb, N. A., et al. 2016, ApJ, 821, 25 [Google Scholar]
- Lin, D., Guillochon, J., Komossa, S., et al. 2017a, Nat. Astron., 1, 0033 [Google Scholar]
- Lin, D., Godet, O., Ho, L. C., et al. 2017b, MNRAS, 468, 783 [Google Scholar]
- Liske, J., Baldry, I. K., Driver, S. P., et al. 2015, MNRAS, 452, 2087 [Google Scholar]
- Liu, J.-F., & Bregman, J. N. 2005, ApJS, 157, 59 [NASA ADS] [CrossRef] [Google Scholar]
- Liu, Z., Merloni, A., Georgakakis, A., et al. 2016, MNRAS, 459, 1602 [Google Scholar]
- Maksym, W. P., Miller, J. M., Cenko, S. B., et al. 2014, ATel., 6834, 1 [NASA ADS] [Google Scholar]
- Mallick, L., & Dewangan, G. C. 2018, ApJ, 863, 178 [NASA ADS] [CrossRef] [Google Scholar]
- McLaughlin, D. B. 1942, Popular Astron., 50, 233 [NASA ADS] [Google Scholar]
- McLaughlin, D. B. 1943, Publications of Michigan Observatory, 8, 149 [NASA ADS] [Google Scholar]
- Melnyk, O., Plionis, M., Elyiv, A., et al. 2013, A&A, 557, A81 [NASA ADS] [CrossRef] [EDP Sciences] [Google Scholar]
- Menzel, M. L., Merloni, A., Georgakakis, A., et al. 2016, MNRAS, 457, 110 [NASA ADS] [CrossRef] [Google Scholar]
- Mickaelian, A. M., Harutyunyan, G. S., & Sarkissian, A. 2018, Astron. Lett., 44, 351 [NASA ADS] [CrossRef] [Google Scholar]
- Middleton, M. J., Sutton, A. D., Roberts, T. P., Jackson, F. E., & Done, C. 2012, MNRAS, 420, 2969 [NASA ADS] [CrossRef] [Google Scholar]
- Middleton, M. J., Heil, L., Pintore, F., Walton, D. J., & Roberts, T. P. 2015, MNRAS, 447, 3243 [Google Scholar]
- Miniutti, G., Fabian, A. C., Brandt, W. N., Gallo, L. C., & Boller, T. 2009a, MNRAS, 396, L85 [NASA ADS] [CrossRef] [Google Scholar]
- Miniutti, G., Ponti, G., Greene, J. E., et al. 2009b, MNRAS, 394, 443 [NASA ADS] [CrossRef] [Google Scholar]
- Miniutti, G., Saxton, R. D., Rodríguez-Pascual, P. M., et al. 2013, MNRAS, 433, 1764 [NASA ADS] [CrossRef] [Google Scholar]
- Miniutti, G., Saxton, R. D., Giustini, M., et al. 2019, Nature, 573, 381 [Google Scholar]
- Pâris, I., Petitjean, P., Aubourg, É., et al. 2014, A&A, 563, A54 [NASA ADS] [CrossRef] [EDP Sciences] [Google Scholar]
- Pâris, I., Petitjean, P., Aubourg, É., et al. 2018, A&A, 613, A51 [Google Scholar]
- Paturel, G., Petit, C., Prugniel, P., et al. 2003, A&A, 412, 45 [NASA ADS] [CrossRef] [EDP Sciences] [Google Scholar]
- Petrucci, P. O., Ursini, F., De Rosa, A., et al. 2018, A&A, 611, A59 [NASA ADS] [CrossRef] [EDP Sciences] [Google Scholar]
- Phinney, E. S. 1989, in The Center of the Galaxy, ed. M. Morris, IAU Symp., 136, 543 [NASA ADS] [CrossRef] [Google Scholar]
- Piconcelli, E., Jimenez-Bailón, E., Guainazzi, M., et al. 2005, A&A, 432, 15 [NASA ADS] [CrossRef] [EDP Sciences] [Google Scholar]
- Pierre, M., Pacaud, F., Adami, C., et al. 2016, A&A, 592, A1 [NASA ADS] [CrossRef] [EDP Sciences] [Google Scholar]
- Pinto, C., Alston, W., Soria, R., et al. 2017, MNRAS, 468, 2865 [Google Scholar]
- Rakshit, S., Stalin, C. S., Chand, H., & Zhang, X.-G. 2017, ApJS, 229, 39 [Google Scholar]
- Rees, M. J. 1988, Nature, 333, 523 [Google Scholar]
- Ricci, C., Kara, E., Loewenstein, M., et al. 2020, ApJ, 898, L1 [Google Scholar]
- Saxton, R. D., Read, A. M., Esquej, P., et al. 2012, A&A, 541, A106 [NASA ADS] [CrossRef] [EDP Sciences] [Google Scholar]
- Saxton, R., Komossa, S., Auchettl, K., & Jonker, P. G. 2020, Space Sci. Rev., 216, 85 [NASA ADS] [CrossRef] [Google Scholar]
- Shectman, S. A., Landy, S. D., Oemler, A., et al. 1996, ApJ, 470, 172 [NASA ADS] [CrossRef] [Google Scholar]
- Sheng, Z., Wang, T., Ferland, G., et al. 2021, ApJ, 920, L25 [NASA ADS] [CrossRef] [Google Scholar]
- Shu, X. W., Wang, T. G., Jiang, N., et al. 2017, ApJ, 837, 3 [NASA ADS] [CrossRef] [Google Scholar]
- Shu, X. W., Wang, S. S., Dou, L. M., et al. 2018, ApJ, 857, L16 [NASA ADS] [CrossRef] [Google Scholar]
- Sun, L., Shu, X., & Wang, T. 2013, ApJ, 768, 167 [NASA ADS] [CrossRef] [Google Scholar]
- Swartz, D. A., Ghosh, K. K., Tennant, A. F., & Wu, K. 2004, ApJS, 154, 519 [Google Scholar]
- Terashima, Y., Kamizasa, N., Awaki, H., Kubota, A., & Ueda, Y. 2012, ApJ, 752, 154 [NASA ADS] [CrossRef] [Google Scholar]
- Toba, Y., Oyabu, S., Matsuhara, H., et al. 2014, ApJ, 788, 45 [Google Scholar]
- Urquhart, R., & Soria, R. 2016, MNRAS, 456, 1859 [Google Scholar]
- Véron-Cetty, M. P., & Véron, P. 2006, A&A, 455, 773 [Google Scholar]
- Véron-Cetty, M. P., & Véron, P. 2010, A&A, 518, A10 [Google Scholar]
- Walton, D. J., Roberts, T. P., Mateos, S., & Heard, V. 2011, MNRAS, 416, 1844 [Google Scholar]
- Watson, M. G., Auguères, J. L., Ballet, J., et al. 2001, A&A, 365, L51 [NASA ADS] [CrossRef] [EDP Sciences] [Google Scholar]
- Webb, N. A., Coriat, M., Traulsen, I., et al. 2020, A&A, 641, A136 [NASA ADS] [CrossRef] [EDP Sciences] [Google Scholar]
- Wevers, T. 2020, MNRAS, 497, L1 [NASA ADS] [CrossRef] [Google Scholar]
- Yoon, J. H., Schawinski, K., Sheen, Y.-K., Ree, C. H., & Yi, S. K. 2008, ApJS, 176, 414 [NASA ADS] [CrossRef] [Google Scholar]
- Zhang, W., Yu, W., & Yan, Z. 2016, ATel., 8644, 1 [NASA ADS] [Google Scholar]
Appendix A: Calculation of TDE rate
In order to give an estimate of the rate of TDEs based on the four we found with our methods, we first need to estimate in how many galaxies we would be able to identify one if it occurred. To do so we started by retrieving the list of XMM-Newton pointings, along with the duration of each observation. Then we cross-matched the list with the four galaxy catalogues, paying attention not to double-count the galaxies that are included in more than one catalogue. We selected all of the galaxies within a radius of 14 arcmins from the XMM-Newton pointing to account for the XMM-Newton field of view.
For each galaxy we then computed the minimum observable flux. We did so by taking the exposure time, decreasing it by 30% in order to account for the background flaring, computing the correspondent 7σ sensitivity (adapting the 5σ sensitivity from Watson et al. 2001), and finally multiplying for the vignetting factor taken from Fig. 13 of the XMM-Newton Users Handbook, Issue 2.17, 2019 (ESA: XMM-Newton SOC). Finally, for each galaxy we converted the minimum observable flux in a luminosity threshold (Lth).
As in looking for supersoft hyperluminous sources, we selected only sources with luminosity higher than a chosen threshold (1041 erg/s). We faced a double problem: as the lightcurves of TDEs decrease with time, if the luminosity threshold of a galaxy is higher then 1041 erg/s, we would catch a TDE occurring in it only in the fraction of its lifetime its luminosity is higher then the galaxy luminosity threshold; furthermore, after enough time passed we would not be able to catch it in any galaxies at all. Each galaxy was then counted, weighted with weight w computed as follows:
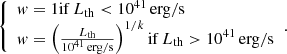
The last expression equals the fraction of time it takes a TDE with light curve slope k to decrease from its peak luminosity to Lth with respect to decreasing to 1041 erg/s. Assuming a classical −5/3 value for the value of the light curve slope, the number of galaxies in which we would have observed a TDE is 55498. Given that we could not keep under control every source of uncertainty, we approximate this number to 55000 and assume a conservative error of 10% on the value.
Finally, we need to assume a value for the visibility window of TDEs (i.e. the amount of time a TDE has luminosity higher than our search threshold of 1041 erg/s); in this case we chose a six-year period. This choice also roughly corresponds to the amount of time a TDE at z = 0.1, with a peak-luminosity of 1044 erg/s, following a t−5/3 light curve with a characteristic time of one month, would remain detectable by XMM-Newton with 7σ sensitivity. This gives us a rate of (1.2 ± 0.2)×10−5 TDEs per galaxy per year. This rate refers only to TDEs presenting a supersoft X-ray emission (thermal TDEs); we can correct for this effect by dividing our estimated rate by the fraction of thermal TDEs in the XMM-Newton catalogue which amounts to roughly 1/2, retrieving a final estimate for the TDEs rate of (2.4 ± 0.2)×10−5 gal−1 yr−1.
Appendix B: Spectral parameters
Figures B.1 and B.2 show the spectra of the sources we did not present in detail in the text, while Table B.1 lists the spectral parameters. The model employed is an absorbed blackbody plus power law (zTbabs × (zBbody + zPowerlw) in XSPEC).
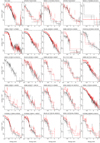 |
Fig. B.1. Spectra of the sources we found to be "standard" AGN. The colour code is the same as in previous plots. The spectral parameters are listed in Table B.1. |
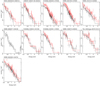 |
Fig. B.2. Spectra of the sources we found to be "standard" AGN. The colour code is the same as in previous plots. The spectral parameters are listed in Table B.1. |
Spectral parameters of the sources we found to be "standard" AGN. Quantities in italic are fixed during the fitting procedure. The uncertainties reported correspond to a change in the fit statistics of ΔC = 1. The unabsorbed luminosity is computed between 0.5 and 2 keV.
All Tables
Spectral parameters of the sources we found to be "standard" AGN. Quantities in italic are fixed during the fitting procedure. The uncertainties reported correspond to a change in the fit statistics of ΔC = 1. The unabsorbed luminosity is computed between 0.5 and 2 keV.
All Figures
|
Fig. 1. Thirty-one sources selected in the ultrasoft band shown in the LX − Γ0.2 − 1 keV plane. The blue squares and red diamonds show respectively the extreme AGN and TDEs known in the literature. |
| In the text | |
|
Fig. 2. Twenty-nine sources selected in the soft band shown in the LX − Γ0.5 − 2 keV plane. The blue squares and red diamonds show respectively the extreme AGN and TDEs known in the literature. |
| In the text | |
|
Fig. 3. L2−10 keV vs. L0.5−2 keV for PG quasars (black circles) and for our sources (coloured symbols). The dashed line is the bisector. For each of the two sources, the two points refer to different observations. The hard band luminosities are upper limits. |
| In the text | |
|
Fig. 4. X-ray spectra of the source labelled D1. The blue data are from Chandra, black from the XMM-Newton EPIC-pn camera, and red from the merged EPIC-MOS one. The solid lines show the best-fitting model. |
| In the text | |
|
Fig. 5. X-ray spectra of the source labelled D2. The colour-coding is the same as in the previous plots. Only the highest signal-to-noise observation of the three performed in July 2008 is shown. |
| In the text | |
|
Fig. 6. X-ray spectrum of source P1. The colour-coding is the same as in the previous plot. |
| In the text | |
|
Fig. 7. X-ray spectra of source P2. The colour-coding is the same as in the previous plots. |
| In the text | |
|
Fig. 8. X-ray spectra of source P3. The colour-coding is the same as in the previous plots. |
| In the text | |
|
Fig. 9. X-ray spectra of the candidate TDEs with only one observation: T1 (left panel) and T2 (right panel). The colour-coding is the same as in the previous plots. |
| In the text | |
|
Fig. 10. X-ray spectra of source T3. The colour-coding is the same as in the previous plots. |
| In the text | |
|
Fig. 11. X-ray spectra of T4: the archival one from an observation in 2010 (left panel) and the new one obtained with the pointed observation in 2022 (right panel). The soft flux dropped by a factor of ∼20. The colour-coding is the same as in the previous plots. |
| In the text | |
|
Fig. B.1. Spectra of the sources we found to be "standard" AGN. The colour code is the same as in previous plots. The spectral parameters are listed in Table B.1. |
| In the text | |
|
Fig. B.2. Spectra of the sources we found to be "standard" AGN. The colour code is the same as in previous plots. The spectral parameters are listed in Table B.1. |
| In the text | |
Current usage metrics show cumulative count of Article Views (full-text article views including HTML views, PDF and ePub downloads, according to the available data) and Abstracts Views on Vision4Press platform.
Data correspond to usage on the plateform after 2015. The current usage metrics is available 48-96 hours after online publication and is updated daily on week days.
Initial download of the metrics may take a while.