Open Access
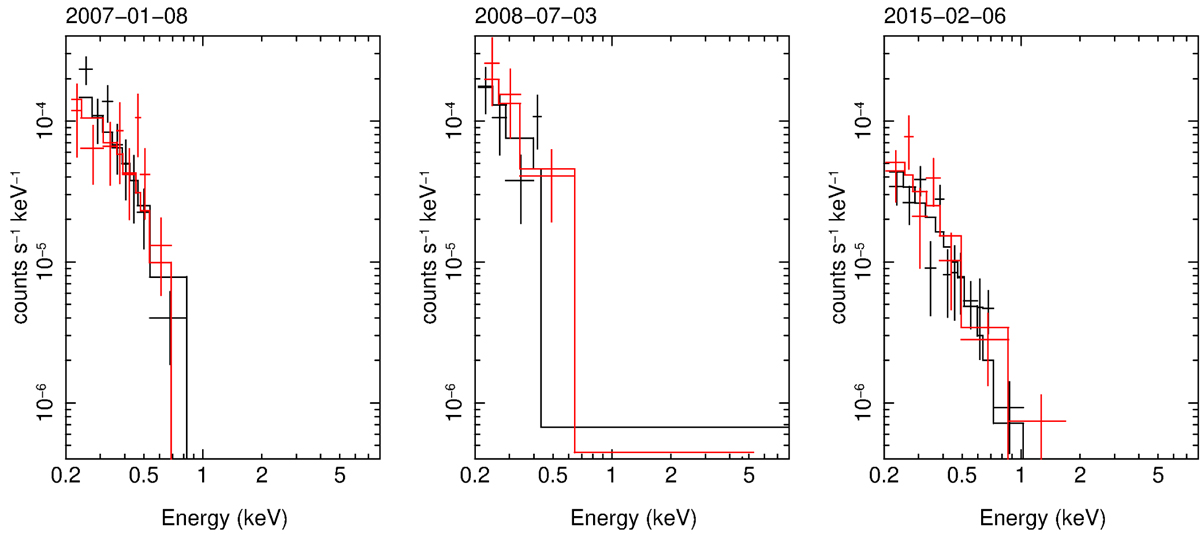
Fig. 5.
Download original image
X-ray spectra of the source labelled D2. The colour-coding is the same as in the previous plots. Only the highest signal-to-noise observation of the three performed in July 2008 is shown.
Current usage metrics show cumulative count of Article Views (full-text article views including HTML views, PDF and ePub downloads, according to the available data) and Abstracts Views on Vision4Press platform.
Data correspond to usage on the plateform after 2015. The current usage metrics is available 48-96 hours after online publication and is updated daily on week days.
Initial download of the metrics may take a while.