Open Access
Fig. 11.
Download original image
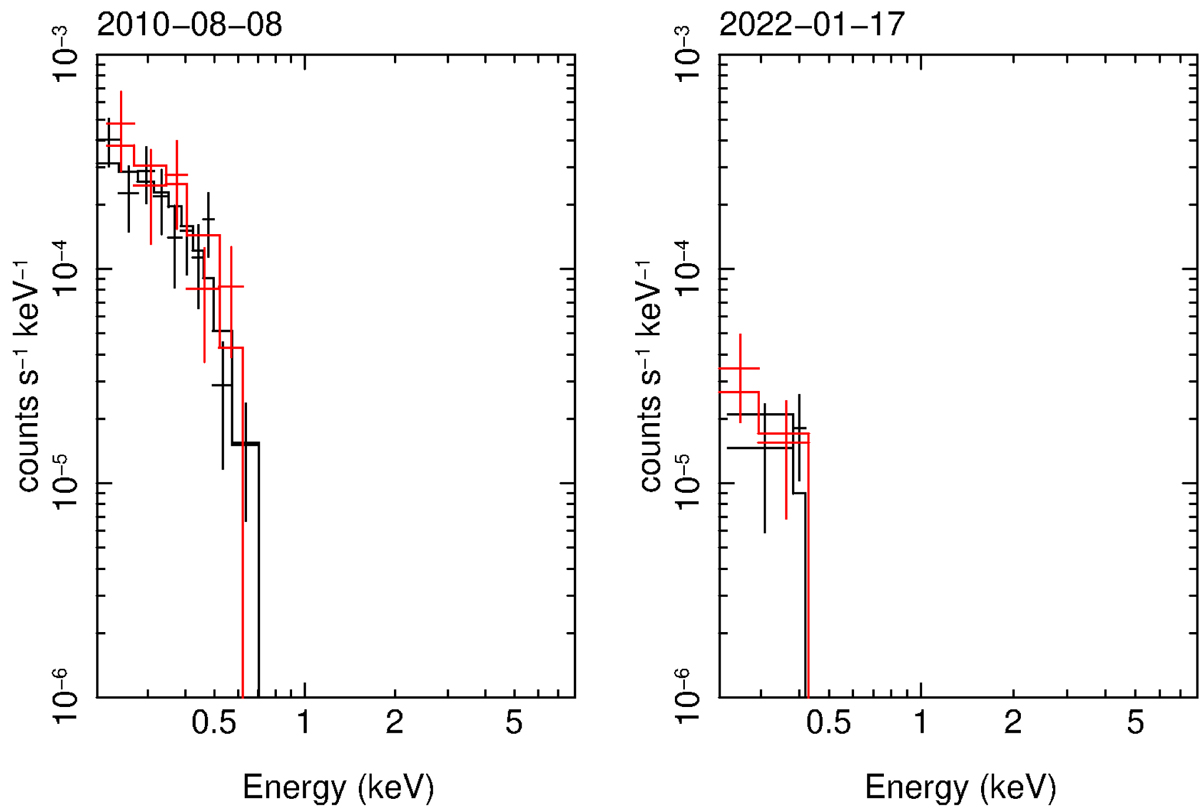
X-ray spectra of T4: the archival one from an observation in 2010 (left panel) and the new one obtained with the pointed observation in 2022 (right panel). The soft flux dropped by a factor of ∼20. The colour-coding is the same as in the previous plots.
Current usage metrics show cumulative count of Article Views (full-text article views including HTML views, PDF and ePub downloads, according to the available data) and Abstracts Views on Vision4Press platform.
Data correspond to usage on the plateform after 2015. The current usage metrics is available 48-96 hours after online publication and is updated daily on week days.
Initial download of the metrics may take a while.