Open Access
Fig. 4.
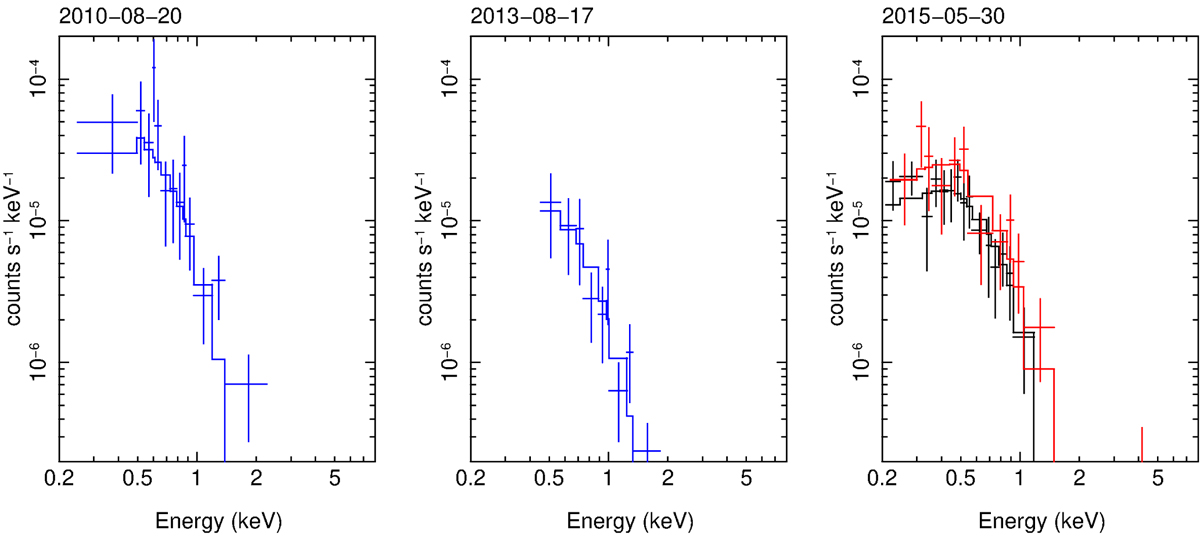
Download original image
X-ray spectra of the source labelled D1. The blue data are from Chandra, black from the XMM-Newton EPIC-pn camera, and red from the merged EPIC-MOS one. The solid lines show the best-fitting model.
Current usage metrics show cumulative count of Article Views (full-text article views including HTML views, PDF and ePub downloads, according to the available data) and Abstracts Views on Vision4Press platform.
Data correspond to usage on the plateform after 2015. The current usage metrics is available 48-96 hours after online publication and is updated daily on week days.
Initial download of the metrics may take a while.