| Issue |
A&A
Volume 672, April 2023
|
|
|---|---|---|
| Article Number | A125 | |
| Number of page(s) | 9 | |
| Section | Interstellar and circumstellar matter | |
| DOI | https://doi.org/10.1051/0004-6361/202244486 | |
| Published online | 12 April 2023 | |
Kinematics signature of a giant planet in the disk of AS 209
1
INAF-Osservatorio Astrofisico di Arcetri,
L.go E. Fermi 5,
50125
Firenze,
Italy
e-mail: This email address is being protected from spambots. You need JavaScript enabled to view it.
2
Dipartimento di Scienza e Alta Tecnologia, Università degli Studi dell’Insubria,
Via Valleggio 11,
22100
Como,
Italy
3
Dipartimento di Fisica, Università degli Studi di Milano,
Via Giovanni Celoria, 16,
20133
Milano, MI,
Italy
Received:
12
July
2022
Accepted:
16
February
2023
Abstract
Observations of dust in protoplanetary disks with the Atacama Large Millimeter Array (ALMA) are revealing the existence of substructures such as rings, gaps, and cavities. This morphology is expected to be the outcome of dynamical interaction between the disks and (embedded) planets. However, other mechanisms are able to produce similar dust substructures. A solution to discriminate the gap formation mechanism is to look at the perturbation induced by the planet on the gas surface density and/or the kinematics. In the case of the disk around AS 209, a prominent gap has been reported in the surface density of CO at r ~ 100 au. A further gas gap was identified at r ~ 200 au. Recently, a localized velocity perturbation was reported in the 12CO J = 2−1 emission along with a clump in 13CO J = 2−1 at nearly 200 au and this was interpreted as a gaseous circumplanetary disk. In this paper, we report a new analysis of ALMA archival observations of 12CO and 13CO J = 2−1 in AS 209. We detected a clear kinematics perturbation (kink) in multiple channels and over a wide azimuth range in both datasets. We compared the observed perturbation with a semianalytic model of velocity perturbations due to planet-disk interaction. Based on our analysis, the observed kink is not consistent with a planet at 200 au, as this would require a low gas-disk scale height (<0.05) in contradiction with the previous estimate (h/r ~ 0.118 at r = 100 au). When we fix the disk scale height to 0.118 (at r = 100 au), we find instead that a planet at 100 au induces a kinematics perturbation similar to the one observed. The kink amplitude in the various channels implies a planet mass of 3–5 MJup. Thus, we conclude that a giant proto-planet orbiting at r ~ 100 au is responsible for the large-scale kink as well as for the perturbed dust and gas surface density previously detected. The position angle of the planet is constrained to be between 60° and 100° (east of north). The 200 au gap visible in the 12CO J = 2−1 moment zero map is likely due to density fluctuations induced by the spiral wake. Future observations using the high-contrast imaging technique in the near- and mid-infrared (e.g., with JWST and/or VLT/ERIS) are needed to confirm the presence and position of such a planet.
Key words: protoplanetary disks / planet-disk interactions
© The Authors 2023
 Open Access article, published by EDP Sciences, under the terms of the Creative Commons Attribution License (https://creativecommons.org/licenses/by/4.0), which permits unrestricted use, distribution, and reproduction in any medium, provided the original work is properly cited.
This article is published in open access under the Subscribe to Open model. This email address is being protected from spambots. You need JavaScript enabled to view it. to support open access publication.
1 Introduction
In the last decade, high angular resolution observations at infrared and (sub)millimeter wavelengths revealed the presence of substructures in the distribution of dust and gas in protoplanetary disks. The most common features detected by the Atacama Large Millimeter Array (ALMA) were rings, cavities, and dust and gas gaps. (e.g., Isella et al. 2016; Fedele et al. 2017; Andrews et al. 2018; Öberg et al. 2021). A common interpretation for the presence of these substructures is that they are the outcome of disk-planet interactions, as probed by, for example, the direct detection of (partially) embedded protoplanets with optical/infrared high-contrast imaging, which is the case for PDS 70 (Keppler et al. 2018) and AB Aur (Currie et al. 2022; Zhou et al. 2022). In most cases, however, direct detection remains elusive, and a valuable indirect technique to infer the presence of an embedded protoplanet involves looking for the perturbation in the gas surface density (e.g., Favre et al. 2019; Toci et al. 2020) and/or kinematics (e.g., Pinte et al. 2018; Teague et al. 2018; Stadler et al. 2023). We report in this paper a new analysis of ALMA archival data of the young protoplanetary system AS 209.
The young pre-main sequence star AS 209 is in the Ophiuchus star forming region at a distance of 121 pc (Gaia Collaboration 2021). The ALMA observations of AS 209 show remarkable substructure, including multiple dust rings and gaps (e.g., Fedele et al. 2018; Andrews et al. 2018; Zhang et al. 2018) and a gas gap at r ~ 50−100 au (Guzmán et al. 2018; Favre et al. 2019; Alarcón et al. 2021). The highly ringed structure in the dust continuum and the gas gap hint at the presence of a 0.2–0.3 Jupiter-mass (MJup) planet orbiting at r ~ 100 au, as suggested by hydrodynamic simulations (Fedele et al. 2018; Zhang et al. 2018; Favre et al. 2019). A further gas gap has been detected in the CO J = 2−1 brightness profile at r ~ 200 au (Teague et al. 2018; Guzmán et al. 2018; Favre et al. 2019) as well as in the near-infrared scattered light image (Avenhaus et al. 2018). This outer gap was detected far beyond the outermost millimeter dust continuum ring centered at r = 120au. Teague et al. (2018) reconstructed the rotation curve from the fitting of the moment map, and they measured a velocity deviation from Keplerian motion of up to 5% in correspondence to this outer gas gap. They ascribed such deviations to changes in the radial gas pressure gradient. A possible explanation of this finding is the presence of a giant planet orbiting at r ~ 200 au. A valuable method for inferring the presence of such a planet is to study the gas kinematics in the CO channels map (e.g., Pinte et al. 2018, 2019). Recently, Bae et al. (2022) reported the detection of a kinematical perturbation in the 12CO channels map and of a circumplanetary disk in 13CO. In this paper, we present a new analysis with a different methodological approach.
2 Data
The analysis presented here is based on archival ALMA observations of 12CO and 13CO J = 2−1 previously published in Favre et al. (2019) and Öberg et al. (2021, program “Molecules with ALMA at Planet-forming Scales”, MAPS). The channel maps are consistent between the two datasets. As the MAPS data have a higher signal-to-noise ratio and a slightly higher angular resolution, we adopted the MAPS spectral cube for the following analysis.
The MAPS observations and data reduction are fully described in Czekala et al. (2021). For our analysis we downloaded the self-calibrated and JvM-corrected dataset (following the calibration described in Jorsater & van Moorsel 1995) with an angular resolution of 0/2 and a channel width of 0.2 km s−1. Casassus & Cárcamo (2022) warned about the JvM correction, as it can overestimate the peak signal-to-noise ratio in the restored images. For this reason, we also show the same dataset without the JvM correction in the appendix. The channels map and the velocity map are shown in Figs. 1 and 2, respectively. The latter corresponds to the velocity map of the peak intensity computed with a quadratic fit using the code BETTERMOMENTS (Teague & Foreman-Mackey 2018).
3 Analysis
We used the code “CO_layers”1 (Pinte et al. 2018) to determine the Keplerian isovelocity regions of the 12CO and 13CO J = 2−1 emitting surfaces. Teague et al. (2018) estimated the emitting surfaces adopting a power-law dependence of z (the height of the 12CO emitting layer over the midplane) on r (radial distance from the star):
 (1)
(1)
Law et al. (2021) performed a different fit using a modified functional form that includes an exponential cutoff:
![Mathematical equation: $z\left( r \right) = {z_0} \cdot {\left( {{r \over {1}}} \right)^\phi } \cdot \exp \left[ { - {{\left( {{r \over {{r_{{\rm{taper}}}}}}} \right)}^\psi }} \right].$](/articles/aa/full_html/2023/04/aa44486-22/aa44486-22-eq2.png) (2)
(2)
We adopted the fit results by Law et al. (2021). In Fig. 1, the Keplerian isovelocity curves are overlaid on the channel maps for the top and bottom surfaces. The previously identified 12CO gap at r ~ 200 au is clearly visible. A deviation from Keplerian velocity (∆υ) is visible in the outer disk in multiple channels and at different azimuth angles. Deviations from Keplerian velocity are clearly detected in both the 12CO and 13CO dataset. The velocity deviation are also clearly visible in the velocity map of the two transitions (Fig. 2).
The overall structure of ∆v resembles a kinematics perturbation (or kink) induced by a planet (e.g., Perez et al. 2015; Pinte et al. 2018, 2019; Bollati et al. 2021). This is in good agreement with the recent results by Bae et al. (2022). We note, however, that the kink is not localized but instead extends to almost the entire disk. Bae et al. (2022) has also reported the detection of a candidate gaseous circumplanetary disk in the 13CO channels map at r = 206 au and PA ~ 170−190°. This structure is spatially coincident with the kink, as shown in Fig. B.1 where the 13CO emission is overlaid on top of the 12CO one. The kink clearly extends over the entire disk, and in a number of channels, it shows a characteristic wiggle in the radial direction.
4 Comparison to semianalytical models
The radial and azimuthal extent of the kink hints at the existence of a giant planet that perturbs the gas density distribution and kinematics. In this scenario, the kink originates at the intersection between the spiral wake and the line channels map. Apart from disk-planet interaction, other mechanisms may also give rise to velocity perturbation, such as vertical shear instability (VSI) and gravitational instability (GI). However, the velocity perturbation produced by VSI is of the order of a few m s−1 (Barraza-Alfaro et al. 2021), much smaller than the kink detected in this paper. Longarini et al. (2021) investigated the velocity perturbation induced by GI. The amplitude of the GI wiggle is consistent with the kink amplitude detected in this work, but the global shape of the velocity field produced by GI differs substantially from the observed velocity map (Fig. 2).
In the following section, we assume the presence of a giant planet as a working hypothesis, and we test whether this presence would be capable of producing a wide-angle kink, and if so, we attempt to put constraints on the position and mass of such a planet. To this end, we compare the observed kink to semianalytic models by Bollati et al. (2021) based on the code Analytical_kinks_master2.
The radial and azimuthal extent of the perturbation in the semianalytic model depends primarily on the planet mass (MP) and orbital distance (RP) and on the disk scale height h/r at r = RP(hP). Bollati et al. (2021) included a viscosity parameter (αm) to artificially dampen the spiral wake. As we observed a large scale kink, we imposed αm = 0. The αm parameter is a free parameter that tunes the strength of the exponential viscous damping of velocity perturbations irrespective of the nature of the viscosity. This parameter was first introduced in Bollati et al. (2021) to account for a possible impact of such damping on the kinks observed in the channel maps. However, in the case of HD 163296, Calcino et al. (2022) showed that this velocity damping prescription is not required, as the planet wake induces secondary kinks in velocity channels that extend far from the planet location (i.e., the semianalytical model successfully reproduces the observations assuming αm=0). Being that the velocity kinks in AS 209 are not localized near the planet but instead spread at all azimuths in a spiral-like shape, we decided to neglect viscous damping as well.
In our model, the disk scale height is given by the ratio of the sound speed (cs) and the Keplerian velocity (υKep). For the sound speed, we assumed a power-law dependence with radius (cs ~ r−q). Thus, the scale height varies with the radius as h/r ∝ r0.5−q. We fixed q = 0.25 (hence h/r ~ r0.25) and the disk scale height (at r = 100 au) to hP = 0.118 (e.g., Law et al. 2021). Once the viscosity damping and the scale height are fixed, the extent and the amplitude of density and velocity perturbation depend only on the planet position and mass. The values of the input parameters are reported in Table 1.
4.1 Planet position
To estimate the planet position, we ran a grid of models inspecting different values of RP and planet position angles (PAP). Initially, we tested the parameters proposed by Bae et al. (2022) (MP = 1.3 MJup, RP = 206 au, PAP =170°). The results are shown in Fig. 3. Through these values, the synthetic kink was localized in a few channels in proximity to the planet, but the model does not reproduce the large-scale structure of the observed perturbation. In particular, the radial and azimuthal extent of the synthetic kink was not consistent with the observations. This is because the outer spiral arm extends to larger distances beyond the disk radius.
As a second step, we tested different values of PAP while keeping the orbital radius fixed at RP = 200 au. In all the models, the extent of the kink did not reconcile with the observations. The only way to reproduce the tightly wound spiral of the observations was to impose a low-scale height value at the planet position (hP < 0.05; Fig. B.2). This is however in contradiction with previous estimates of the disk scale height based on the fit of the spectral energy distribution (e.g., Andrews et al. 2011) and of the CO emitting surfaces (Teague & Foreman-Mackey 2018; Law et al. 2021). Moreover, these simulations did not produce the wiggles observed at r ~ 100−200 au.
The velocity perturbations in Fig. 2 are very extended both radially and azimuthally, and multiple wiggles are clearly visible in each given channel. This may suggest that the outer spiral arm folds more than one time, and for this to happen, the planet must be located within 200 au. The presence of a planet at ~ 100 au has been proposed to explain the gap observed in the dust (e.g., Fedele et al. 2018; Andrews et al. 2018) and gas distribution (Favre et al. 2019). Figure B.2 shows the analytic wake (Rafikov 2002) for RP = 100 au, PAP = 90°, and hP = 0.118 overlaid on the 12CO velocity map. Notably, the outer spiral arm folds multiple times, crossing the velocity channels close to the observed kinks. With the assumption of RP = 100 au, we ran a new grid of models by varying MP and PAP. Models with PAP ~ 60°−110° (east of north) produced a pattern similar to the one observed in Fig. 2. As an example, Fig. 4 shows the predictions of the semianalytic model for the density and velocity perturbation and the synthetic velocity map for the case of MP = 4 MJup and PAP = 90°. The outer spiral arm crosses the velocity channels multiple times, giving rise to several wiggles in each given channel. The radial extent and amplitude (azimuthal offset) of the kink produced by the outer arm increases as the wake moves away from the planet. In proximity to the planet, the perturbation is smaller than the channel width of 0.2 km s−1. All these findings are in agreement with the observed velocity perturbation, strengthening the layer as hypothesis of RP = 100 au. In this scenario, the previously detected gap at r ~ 200 au is most likely due to density fluctuations induced by the outer spiral arm (Fig. 4, top panel).
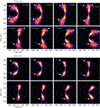 |
Fig. 1 ALMA channels map of AS 209. The figure shows selected velocity channels of 12CO J = 2−1 (top) and 13CO J = 2−1 (bottom). Each panel shows the line emission in a given channel centered at the velocity reported in the top-right corner. The dotted ellipses represent the orbital distances of r = 100 au and r = 200 au at z = 0. The Keplerian isovelocity region was overlaid for the top (solid line) and bottom (dashed) surfaces (see Sect. 3). The arrows point to the deviation from Keplerian velocity. The deviation is detected in multiple channels and over a wide range of azimuth angles both in the 12CO and in the 13CO channels maps. |
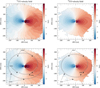 |
Fig. 2 Velocity map of the peak intensity. The figure shows the velocity map of 12CO (left) and 13CO (right) J = −2−1 in the LSR rest frame. The bottom panels show the same maps with the most prominent kinks indicated by the arrows. The large-scale structure of the kink resembles a spiral wake, tentatively represented by the thick gray line. |
Input parameters to “Analytical_kinks_master” (Bollati et al. 2021).
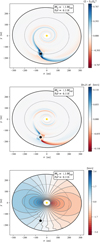 |
Fig. 3 Output of the semianalytic model. The figure shows the density perturbation (top), the deviation from the Keplerian velocity (middle), and the velocity perturbation (bottom) induced in the velocity channels map (channel width of 0.2 km s−1 ). The dashed line represents an orbital distance of 200 au. The planet and disk properties are from Bae et al. (2022, planet mass of 1.3 MJup at 206 au at a position angle of 170°). |
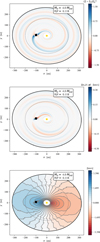 |
Fig. 4 Same as in Fig. 3 but for the representative model with RP = 100 au, MP = 4 MJup, PAP = 90°, and hP = 0.118. |
4.2 Planet mass
To estimate MP, we created a new simulation grid with a fixed RP (100 au), PAP (90°), and hP (0.118). In each given channel the amplitude of the kink (𝒜 [au]) increases with MP. We measured 𝒜 as the offset between the Keplerian and the observed central velocity, and we compared it to the offset in the synthetic velocity map. Figure 5 shows the observed (υo) and the Keplerian (υk) isovelocity curves of the central channel of 12CO. The Keplerian profile is based on Eq. (2), and it refers to the top CO surface layer as fitted by Law et al. (2021). We inspected the central channel at υ = −4:7 km s−1 (corresponding to the disk minor axis) in order to avoid the projection effect of the velocity in the azimuthal direction. We measured 𝒜 as a function of radial projected distance from the star, and for the comparison with the synthetic map, we considered the offset at a projected distance of r = 150 au, which corresponds to the first intersection of the outer spiral arm with the central velocity channel. We note that at larger radial distances, the measurement of the observed offset can be overestimated because of the convolution of two consecutive kinks, as suggested by the semianalytic simulations (Fig. 4, middle panel). The observed offset at r = 150 au is 𝒜 ~13−15 au. Figure 6 shows the model prediction of the kink amplitude as a function of the planet’s mass from the simulation grid. Based on this analysis, we estimate a mass of MP ~ 3.5−5 MJup.
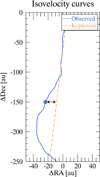 |
Fig. 5 Observed vs. Keplerian isovelocity curves in the central channel. The central channel was adopted as a reference to measure the kink amplitude (𝒜) as the offset between the observed and Keplerian velocity. The Keplerian profile is based on Eq. (2) for the top surface layer. The two dots indicate the position where the offset was measured. |
4.3 Caveats
The estimate of the planet mass and position angle based on the semianalytical model by Bollati et al. (2021) has some limitations. The kink amplitude at the disk minor axis depends on the actual position angle of the planet and where we actually measure the offset. We also note that the planet-induced perturbation was computed at the midplane of the disk (z = 0) and not at the actual height of the CO emitting surface. However, because of the vertical temperature gradient, the spiral can propagate differently at different heights, as demonstrated by Juhász & Rosotti (2018) and Rosotti et al. (2020). The pitch angle of the spiral is expected to increase from the midplane to the higher disk layers because of the higher gas temperature. Modeling the vertical temperature gradient was beyond the scope of this paper. For a detailed discussion on the limitation of the models we used, see Calcino et al. (2022). The remaining parameters of the semianalytical model (q, p, γ) have a minor effect on the estimate of the planet mass (see Bollati et al. 2021).
5 Conclusions
In this paper, we have presented clear evidence of a kink in the velocity field of the disk in AS 209. We confirm the presence of the kink previously detected by Bae et al. (2022) in the 12CO J = 2−1 velocity map, and we report the detection of the kink in the 13CO J = 2−1 map as well. The kink is detected throughout the entire disk at different orbital distances from the star. In the southern region, multiple wiggles are detected with a coherent structure in consecutive channels, consistent with a spiral wake that folds multiple times. A deep gap (both in the dust and gas distribution) and a velocity kink are two of the most evident indications of planet-disk interaction, and the simultaneous occurrence of both strongly points toward the presence of an embedded planet at approximately 100 au.
We compared the observed amplitude of the kink to the expectations based on analytical models of velocity perturbations due to planet-disk interaction, and we conclude that the putative planet orbits at 100 au from the central star and has a mass between approximately 3 and 5 MJup. Our estimate of MP exceeds by an order of magnitude the value reported in Fedele et al. (2018), Zhang et al. (2018), and Favre et al. (2019), who compared the gap properties to hydrodynamic simulations. We note, however, that while the gap width and depth in hydrodynamic simulations do not provide a unique solution for MP, in the case of velocity perturbations, a lower mass planet cannot produce the observed kink amplitude.
The presence of a massive planet at 100 au poses several challenging questions. Unimpeded radial drift is known to lead to very compact dust disks that are much more compact than observed. A common explanation for this discrepancy invokes disk substructures, citing them as a way to slow down dust drift and help the formation of planetesimals through pebble accretion (e.g., Lambrechts & Johansen 2014). As an example, Bae et al. (2015) proposed the formation of vortices during the infall of the protostellar envelope. Another possible explanation is the formation of narrow dust rings at several tens of au by magnetically coupled disk winds (Suriano et al. 2018).
As an alternative formation scenario, a planet at such a large distance can form via gravitational instability, that is, either by rapid solid core formation induced by the instability (Rice et al. 2004) or by direct gas fragmentation (Rice et al. 2005). In the case of disk fragmentation, the theoretical predictions of the initial fragment mass at 100au goes from approximately 2–20 MJup (e.g., Kratter & Lodato 2016, and references therein), which is in good agreement with our estimate.
The evidence gathered so far do not allow us to discriminate between the different planet formation theories and further investigation is needed. In particular, AS 209 is a prime candidate for direct detection of the putative planet in the infrared by either ground- or space-based telescopes, such as VLT/ERIS and JWST.
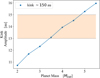 |
Fig. 6 Model prediction of the kink amplitude as a function of the planet’s mass. The planet was assumed to be located at r = 100 au and PA = 90° and with a disk scale height of h/r = 0.118 at RP. Masses that best reproduce the observed kink amplitude fall in the range ~3.5 MJup−4.5 MJup. |
Acknowledgements
We thank the anonymous referee for the thoughtful report and comments that helped to improve the paper. DF acknowledges the support of the Italian National Institute of Astrophysics (INAF) through the INAF Mainstream projects ARIEL and the “Astrochemical Link between Circumstel-lar Disks and Planets”, “Protoplanetary Disks Seen through the Eyes of New-generation Instruments” and by the PRIN-INAF 2019 Planetary Systems At Early Ages (PLATEA). This project has received funding from the European Union’s Horizon 2020 research and innovation programme under the Marie Skłodowska-Curie grant agreement no. 823823 (DUSTBUSTERS).
Appendix A JvM uncorrected data
Casassus & Cárcamo (2022) warned that the JvM correction Jorsater & van Moorsel (1995) can exaggerate the peak signal-to-noise of the restored image. To ensure the reliability of our results, we analyzed the cleaned MAPS image without the JvM correction. Figure B.1 shows a comparison between the JvM-corrected and JvM-uncorretted images of the central channel. The 13CO contours are overlaid on top of the 12CO image for direct comparison. We note that for this comparison, we used the images restored with a beam size of 0.″2, which is slightly higher than the beam size data used in sec.3. The peak signal-to-noise is indeed higher in the first case. Nevertheless, the kink is also clearly visible in the images without the JvM correction. We highlight in particular that the kink was also detected in multiple positions in the uncorrected JvM dataset.
Appendix B Analytic spiral wake in linear regime
Figure B.2 shows the analytic spiral wake on top of the observed 12CO velocity map. The analytic spiral wake was computed following Rafikov (2002). The planet is at r = 100 au and PA=90°, the disk scale height is hP=0.118, and the power exponent of the radial gradient of the sound speed velocity is 0.35. The spiral was computed at the midplane and then projected onto the CO top surface layer as defined by eq. 2. In several channels, the projected spiral wake matches the position of the observed kinks. The projected spiral does not take into account the vertical temperature gradient (see sec. 4.3).
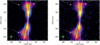 |
Fig. B.1 Central velocity channel. (left) JvM-Corrected image of the central velocity channel. (right) Uncorrected JvM image of the central velocity channel. The cyan contours indicate the 13CO emission. The white lines represent the expected contours in the case of the Keplerian profile for the top (solid) and bottom (dashed) surface (eq. 2). The arrows point to the main deviation from the Keplerian velocity. The restored beam of 072 is shown in the bottom-left corner as a green circle. The 13CO contours are plotted at 3, 5, 7, 9, 15, and 20σ. |
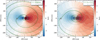 |
Fig. B.2 Velocity map of 12CO. The figure shows the analytic spiral wake overlaid on top of the 12CO velocity map. The gray dot in each image indicates the position of the planet at the midplane. (left) Spiral wake for RP = 100 au. The two curves show the spiral wake at the midplane (green solid line) and the CO top surface layer (dashed gray line). (right) spiral wake for RP= 200 au. The two curves show the wake (projected on the CO top surface layer) for two different values of hP. |
References
- Alarcón, F., Bosman, A. D., Bergin, E. A., et al. 2021, ApJ, 257, 8 [Google Scholar]
- Andrews, S. M., Wilner, D. J., Espaillat, C., et al. 2011, ApJ, 732, 42 [Google Scholar]
- Andrews, S. M., Huang, J., Pérez, L. M., et al. 2018, ApJ, 869, L41 [NASA ADS] [CrossRef] [Google Scholar]
- Avenhaus, H., Quanz, S. P., Garufi, A., et al. 2018, ApJ, 863, 44 [NASA ADS] [CrossRef] [Google Scholar]
- Bae, J., Hartmann, L., & Zhu, Z. 2015, ApJ, 805, 15 [NASA ADS] [CrossRef] [Google Scholar]
- Bae, J., Teague, R., Andrews, S. M., et al. 2022, ApJ, 934, L20 [NASA ADS] [CrossRef] [Google Scholar]
- Barraza-Alfaro, M., Flock, M., Marino, S., & Pérez, S. 2021, A&A, 653, A113 [NASA ADS] [CrossRef] [EDP Sciences] [Google Scholar]
- Bollati, F., Lodato, G., Price, D. J., & Pinte, C. 2021, MNRAS, 504, 5444 [Google Scholar]
- Calcino, J., Hilder, T., Price, D. J., et al. 2022, ApJ, 929, L25 [NASA ADS] [CrossRef] [Google Scholar]
- Casassus, S., & Cárcamo, M. 2022, MNRAS, 513, 5790 [NASA ADS] [CrossRef] [Google Scholar]
- Currie, T., Lawson, K., Schneider, G., et al. 2022, Nat. Astron., 6, 751 [NASA ADS] [CrossRef] [Google Scholar]
- Czekala, I., Loomis, R. A., Teague, R., et al. 2021, ApJS, 257, 2 [NASA ADS] [CrossRef] [Google Scholar]
- Favre, C., Fedele, D., Maud, L., et al. 2019, ApJ, 871, 107 [Google Scholar]
- Fedele, D., Carney, M., Hogerheijde, M. R., et al. 2017, A&A, 600, A72 [NASA ADS] [CrossRef] [EDP Sciences] [Google Scholar]
- Fedele, D., Tazzari, M., Booth, R., et al. 2018, A&A, 610, A24 [NASA ADS] [CrossRef] [EDP Sciences] [Google Scholar]
- Gaia Collaboration (Brown, A. G. A., et al.) 2021, A&A, 649, A1 [NASA ADS] [CrossRef] [EDP Sciences] [Google Scholar]
- Guzmán, V. V., Huang, J., Andrews, S. M., et al. 2018, ApJ, 869, L48 [Google Scholar]
- Isella, A., Guidi, G., Testi, L., et al. 2016, Phys. Rev. Lett., 117, 251101 [NASA ADS] [CrossRef] [Google Scholar]
- Jorsater, S., & van Moorsel, G. A. 1995, AJ, 110, 2037 [Google Scholar]
- Juhász, A., & Rosotti, G. P. 2018, MNRAS, 474, L32 [Google Scholar]
- Keppler, M., Benisty, M., Müller, A., et al. 2018, A&A, 617, A44 [NASA ADS] [CrossRef] [EDP Sciences] [Google Scholar]
- Kratter, K., & Lodato, G. 2016, ARA&A, 54, 271 [NASA ADS] [CrossRef] [Google Scholar]
- Lambrechts, M., & Johansen, A. 2014, A&A, 572, A107 [NASA ADS] [CrossRef] [EDP Sciences] [Google Scholar]
- Law, C. J., Teague, R., Loomis, R. A., et al. 2021, ApJS, 257, 4 [NASA ADS] [CrossRef] [Google Scholar]
- Longarini, C., Lodato, G., Toci, C., et al. 2021, ApJ, 920, L41 [NASA ADS] [CrossRef] [Google Scholar]
- Öberg, K. I., Guzmán, V. V., Walsh, C., et al. 2021, ApJS, 257, 1 [CrossRef] [Google Scholar]
- Perez, S., Dunhill, A., Casassus, S., et al. 2015, ApJ, 811, L5 [NASA ADS] [CrossRef] [Google Scholar]
- Pinte, C., Price, D. J., Ménard, F., et al. 2018, ApJ, 860, L13 [Google Scholar]
- Pinte, C., van der Plas, G., Ménard, F., et al. 2019, Nat. Astron., 3, 1109 [NASA ADS] [CrossRef] [Google Scholar]
- Rafikov, R. R. 2002, ApJ, 569, 997 [Google Scholar]
- Rice, W. K. M., Lodato, G., Pringle, J. E., Armitage, P. J., & Bonnell, I. A. 2004, MNRAS, 355, 543 [NASA ADS] [CrossRef] [Google Scholar]
- Rice, W. K. M., Lodato, G., & Armitage, P. J. 2005, MNRAS, 364, L56 [NASA ADS] [CrossRef] [Google Scholar]
- Rosotti, G. P., Benisty, M., Juhász, A., et al. 2020, MNRAS, 491, 1335 [Google Scholar]
- Stadler, J., Benisty, M., Izquierdo, A., et al. 2023, A&A, 670, L1 [NASA ADS] [CrossRef] [EDP Sciences] [Google Scholar]
- Suriano, S. S., Li, Z.-Y., Krasnopolsky, R., & Shang, H. 2018, MNRAS, 477, 1239 [NASA ADS] [CrossRef] [Google Scholar]
- Teague, R., & Foreman-Mackey, D. 2018, Res. Notes Am. Astron. Soc., 2, 173 [Google Scholar]
- Teague, R., Bae, J., Birnstiel, T., & Bergin, E. A. 2018, ApJ, 868, 113 [Google Scholar]
- Toci, C., Lodato, G., Fedele, D., Testi, L., & Pinte, C. 2020, ApJ, 888, L4 [Google Scholar]
- Zhang, S., Zhu, Z., Huang, J., et al. 2018, ApJ, 869, L47 [Google Scholar]
- Zhou, Y., Sanghi, A., Bowler, B. P., et al. 2022, ApJ, 934, L13 [NASA ADS] [CrossRef] [Google Scholar]
Avaliable at https://github.com/richteague/disksurf.
Available at https://github.com/fbollati/Analytical_Kinks
All Tables
All Figures
|
Fig. 1 ALMA channels map of AS 209. The figure shows selected velocity channels of 12CO J = 2−1 (top) and 13CO J = 2−1 (bottom). Each panel shows the line emission in a given channel centered at the velocity reported in the top-right corner. The dotted ellipses represent the orbital distances of r = 100 au and r = 200 au at z = 0. The Keplerian isovelocity region was overlaid for the top (solid line) and bottom (dashed) surfaces (see Sect. 3). The arrows point to the deviation from Keplerian velocity. The deviation is detected in multiple channels and over a wide range of azimuth angles both in the 12CO and in the 13CO channels maps. |
| In the text | |
|
Fig. 2 Velocity map of the peak intensity. The figure shows the velocity map of 12CO (left) and 13CO (right) J = −2−1 in the LSR rest frame. The bottom panels show the same maps with the most prominent kinks indicated by the arrows. The large-scale structure of the kink resembles a spiral wake, tentatively represented by the thick gray line. |
| In the text | |
|
Fig. 3 Output of the semianalytic model. The figure shows the density perturbation (top), the deviation from the Keplerian velocity (middle), and the velocity perturbation (bottom) induced in the velocity channels map (channel width of 0.2 km s−1 ). The dashed line represents an orbital distance of 200 au. The planet and disk properties are from Bae et al. (2022, planet mass of 1.3 MJup at 206 au at a position angle of 170°). |
| In the text | |
|
Fig. 4 Same as in Fig. 3 but for the representative model with RP = 100 au, MP = 4 MJup, PAP = 90°, and hP = 0.118. |
| In the text | |
|
Fig. 5 Observed vs. Keplerian isovelocity curves in the central channel. The central channel was adopted as a reference to measure the kink amplitude (𝒜) as the offset between the observed and Keplerian velocity. The Keplerian profile is based on Eq. (2) for the top surface layer. The two dots indicate the position where the offset was measured. |
| In the text | |
|
Fig. 6 Model prediction of the kink amplitude as a function of the planet’s mass. The planet was assumed to be located at r = 100 au and PA = 90° and with a disk scale height of h/r = 0.118 at RP. Masses that best reproduce the observed kink amplitude fall in the range ~3.5 MJup−4.5 MJup. |
| In the text | |
|
Fig. B.1 Central velocity channel. (left) JvM-Corrected image of the central velocity channel. (right) Uncorrected JvM image of the central velocity channel. The cyan contours indicate the 13CO emission. The white lines represent the expected contours in the case of the Keplerian profile for the top (solid) and bottom (dashed) surface (eq. 2). The arrows point to the main deviation from the Keplerian velocity. The restored beam of 072 is shown in the bottom-left corner as a green circle. The 13CO contours are plotted at 3, 5, 7, 9, 15, and 20σ. |
| In the text | |
|
Fig. B.2 Velocity map of 12CO. The figure shows the analytic spiral wake overlaid on top of the 12CO velocity map. The gray dot in each image indicates the position of the planet at the midplane. (left) Spiral wake for RP = 100 au. The two curves show the spiral wake at the midplane (green solid line) and the CO top surface layer (dashed gray line). (right) spiral wake for RP= 200 au. The two curves show the wake (projected on the CO top surface layer) for two different values of hP. |
| In the text | |
Current usage metrics show cumulative count of Article Views (full-text article views including HTML views, PDF and ePub downloads, according to the available data) and Abstracts Views on Vision4Press platform.
Data correspond to usage on the plateform after 2015. The current usage metrics is available 48-96 hours after online publication and is updated daily on week days.
Initial download of the metrics may take a while.